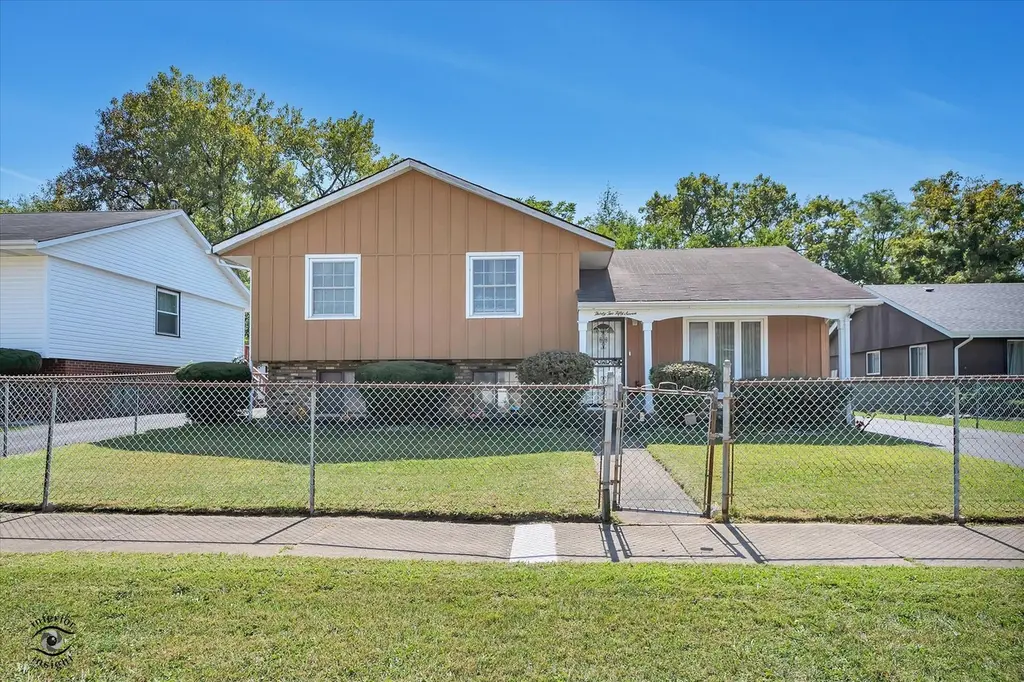
3257 Magnolia Dr · Markham, IL
Flood risk 3/10 · Minor
- FEMA flood zone
- X (unshaded)
- Chance of flooding over 30 yrs
- 0.2%
- Est. flood insurance / yr
- $473 – $860
Fire risk 1/10 · Minimal
- Est. fire insurance / yr
- $804 – $1,492
Heat risk 3/10 · Minor
- Hot days now (above 102°F)
- 7 days/yr
- Hot days in 30 yrs
- 15 days/yr
Wind risk 2/10 · Minimal
- Chance of severe wind over 30 yrs
- —
Air-quality risk 3/10 · Minor
- Unhealthy air days now
- 4 days/yr
- Unhealthy air days in 30 yrs
- 4 days/yr
Risk factors via First Street. Map © Google.
Why this score? — see what drove the F grade
The composite is a weighted blend of 9 inputs, each scored 0–100. Each bar is that input's sub-score; the figure is the points it added to the 100-point composite (weight × sub-score).
- Appreciation +10.0/10.0
- Cash flow +5.2/30.0
- Livability +3.8/5.0
- Rent growth +2.5/5.0
- Condition / age +2.5/5.0
- Schools +1.5/10.0
- 1% rule +1.2/10.0
- DSCR +0.0/10.0
- ARV discount +0.0/15.0
$235,000
🖨 Deal sheet 📄 Offer letter ✓ Due diligence
Listing remarks
Come and see this nicely maintained and updated home where neighbors take great pride in their homes as well! This property is nestled up to the 87-acre Paintbrush Prairie Nature Preserve providing a serene and quiet location in Markham. Paintbrush Prairie is one of five nature preserves in south Cook County collectively known as the Indian Boundary Prairies which also provides a natural sound barrier from interstate 57! This home has been occupied by the same owners for 40 years! Home has state of the art security system as well as beautifully updated kitchen and bathroom. Easy to show and move in ready! Home is being sold as-is.
Key facts
- Serene location
- Updated kitchen
- Updated bathroom
Tags
Property features AI
Finance
- Other: Property offers school bus service, commuter bus access, and interstate access
- HOA & community: No master association fee required
Exterior
- Parking: Detached garage (2 garage spaces) with garage door opener; Concrete driveway
- Utilities: Water source: Lake Michigan; Public sewer
- Home design: Detached single-family home; Split-level design; Fee simple ownership
- Construction: Combination construction materials; Built 51–60 years ago; Built before 1978
- Exterior features: Fenced yard; Nature preserve adjacent
Interior
- Kitchen: Kitchen on main level (11 x 11); Kitchen with blinds and ceramic tile flooring
- Bedrooms: 3 bedrooms; Master bedroom on the second floor (17 x 12); Second bedroom on the second floor (12 x 12); Third bedroom on the second floor (11 x 12)
- Flooring: Carpet in bedrooms, dining room, living room, and master bedroom; Parquet flooring in family room; Ceramic tile in kitchen; Vinyl in laundry room
- Bathrooms: 1 full bath; 1 half bath; Basement has a bathroom
- Heating & cooling: Natural gas heating; Central air conditioning
- Interior features: 7 total rooms; Attic with interior stair; Partial crawl space basement
- Laundry & utility: Laundry room on lower level (14 x 14) with vinyl flooring
Neighborhood map
What this means for you Summary
Snapshot
- This is a 3-bed/1.0-bath single-family listed at $235k.
Deal economics
- At list price, monthly cash flow is $-531 ($-6k/yr) — negative.
- To cash-flow at today's rent, offer at most $141k (40.0% below list).
- To meet the 1% rule (rent ≥ 1% of price), the offer needs to be $146k (37.7% below list).
- Recommended offer: $141k (40.0% below list) — sets the bar for cash-flow.
- Cap rate 3.6% vs local median 10.2% in Markham — below-typical yield; the buyer is paying a premium for something (appreciation thesis, condition, location) that the cap rate doesn't capture.
Location & tenants
- Location reads 76/100 on livability (#186 in IL, #3,539 nationally) — a middle-class / working-renter tenant base. Strengths: commute A+, cost of living A+, housing A+; Watch: crime D, amenities D, employment D.
- Bremen Chsd 228 (suburban): math 15% / reading 17% proficiency, ranked #468 of 620 in IL (top 76%) — low school quality limits family demand, transient renter base, plan for 1-2y turnover.
- Market conditions: 65 active listings in the ZIP; 3 comparable units currently listed for rent nearby; rentals leasing fast (median 6d on market — plan ~1-2 weeks tenant-placement turnaround); 6,272 units permitted in Cook County in 2024 (4,658 in 5+ unit buildings).
Forward outlook
- In year one you build about $25k of equity ($2k loan paydown + $24k appreciation (10.0% local appreciation)).
- By year 2, paydown + projected appreciation supports a ~$40k cash-out refi (75% LTV) — recoverable capital for the next deal without selling this one.
Negotiation context
- It's been on market 34 days — a 3% lower offer ($228k) is reasonable based on typical stale-listing flexibility.
- 2 sale attempts with the ask held roughly flat each time — persistent listings suggest the price (not the market) is what's stuck; bring a comps-based counter.
- Current owner paid $36k; list at $235k implies a 553% gain — meaningful room to come down on a strong offer.
Questions for the listing agent
- What do current leases actually rent for vs. the listed asking? Can we see a recent rent roll and the last 12 months of T-12 income?
- It's been on market 34 days. Have you received any prior offers? Is the seller open to a 40% concession, seller financing, or rate buy-down credit?
- Built in 1973 — when were the roof, HVAC, electrical panel, plumbing, and water heater last replaced?
- Is there a deadline driving the sale (1031 exchange, divorce, estate, relocation)? That informs how much negotiation room exists.
- Schools are F-rated, which usually means shorter tenancies and higher turnover. Who's the typical renter profile here, and what's been the actual vacancy rate?
- Crime grade is D in this area — have there been break-ins, vandalism, or insurance claims at this property in the last 3 years? What carrier currently insures it and at what premium?
- The area grade is low — what's the realistic commute time and amenity access for the typical tenant pool here? Any planned neighborhood developments (good or bad) we should know about?
- What's the average days-on-market for RENTAL listings here right now (not sales)? A rising rental-DOM trend means longer vacancies and softer asking-rent achievability than the comps imply.
- What's the recent tenant-quality profile in this submarket — average credit score on applications, eviction rate, late-payment / NSF rate, and stable-employment percentage? A property-management company in the area should have these aggregated.
- How much new for-sale + rental construction is in the pipeline within 1–3 miles? Heavy new supply typically softens prices + rents 12–24 months out; constrained supply supports both.
Investment metrics
- 1% rule
- 0.62% ✗
- Cap rate
- 3.58%
- Cash-on-cash
- -9.69%
- DSCR
- 0.57
- GRM
- 13.4
CMA / ARV
- ARV (on-the-fly)
- $185,328
- Comps found
- 12
Show comp detail 12 sales within ~0.75 mi
| Address | Dist | Beds/Ba | Sqft | Sold | Price | $/sf | Match |
|---|---|---|---|---|---|---|---|
| 15328 Parkside Dr | 0.52mi | 3/1.0 | 1,224 (+3%) | 3mo | $155,000 | $127 | 68 |
| 3236 Roesner Dr | 0.22mi | 3/1.0 | 1,036 (-13%) | 5mo | $77,000 | $74 | 64 |
| 15315 Cherry Ln | 0.26mi | 3/1.0 | 1,040 (-12%) | 3mo | $195,000 | $188 | 64 |
| 15246 Calitonia Dr | 0.53mi | 3/1.0 | 1,113 (-6%) | 1mo | $137,000 | $123 | 64 |
| 15313 Cherry Ln | 0.27mi | 3/1.0 | 1,036 (-13%) | 3mo | $89,000 | $86 | 64 |
| 15417 Cherry Ln | 0.30mi | 3/1.0 | 1,040 (-12%) | 5mo | $157,000 | $151 | 61 |
| 15823 S Saint Louis Ave | 0.67mi | 3/2.0 | 1,203 (+1%) | 4mo | $220,000 | $183 | 59 |
| 15422 Cherry Ln | 0.32mi | 3/1.5 | 1,040 (-12%) | 4mo | $175,000 | $168 | 59 |
| 15435 Hamlin Ave | 0.64mi | 3/1.0 | 1,107 (-7%) | 3mo | $155,000 | $140 | 56 |
| 15364 Afton Ave | 0.49mi | 3/1.0 | 1,073 (-10%) | 6mo | $167,000 | $156 | 56 |
| 15330 Cherry Ln | 0.34mi | 4/2.0 (+1) | 1,036 (-13%) | 2mo | $249,900 | $241 | 53 |
| 3813 153rd St | 0.68mi | 2/1.0 (-1) | 1,075 (-10%) | 1mo | $268,130 | $249 | 47 |
Match score weights: distance 35% · size 25% · config 20% · recency 20%. Top-matched comps best support the ARV.
Projected returns pro-forma
10.0% appreciation · 3.0% rent growth · sell at horizon
- IRR
- 17.5%
- Equity multiple
- 2.43×
- Total profit
- $94,198
- Equity at exit
- $211,707
- IRR
- 16.5%
- Equity multiple
- 5.62×
- Total profit
- $304,139
- Equity at exit
- $456,553
Cash invested: $65,800 (down + closing). Projections, not guarantees.
Landlord ↔ Tenant lean methodology
- Overall (STATE)
- 43 Moderately Tenant-Leaning
- State Illinois
- 43 Moderately Tenant-Leaning · D+7
- County
- — inherits STATE
- City
- — inherits STATE
ZIP-level market 60428
- Home prices YoY
- 8.5%
- Active inventory
- 65
- Price-to-rent
- 13.4×
Monthly cashflow live
- Estimated rent
- $1,463 medium interval (Pro) →
- Mortgage (P&I)
- −$1,232
- Tax from tax record
- −$357 /mo · $4,287/yr
- Insurance
- −$98
- HOA
- −$0
- Vacancy / Maint / Mgmt
- −$307
- Net cashflow
- $-531
Break-even live
UW: 25.0% down · 7.5% · 30yr · 1.5% tax · 5.0% vac · 8.0% maint · 8.0% mgmt
Financing live
Cash to close
- Down payment
- $58,750
- Closing costs
- $7,050
- Reserves months
- —
- Total cash needed
- —
Loan-product check · same deal, 3 products live
Conventional
25% down · 7.5% · 30yr
- Down + closing
- —
- Monthly P&I
- —
- Monthly cashflow
- —
- DSCR
- —
- Eligible?
- —
Personal DTI + credit; lowest rate.
DSCR
20% down · 8.5% · 30yr
- Down + closing
- —
- Monthly P&I
- —
- Monthly cashflow
- —
- DSCR
- —
- Eligible?
- —
No personal income docs; deal must DSCR.
Hard money
10% down · 12.0% · 12mo
- Down + closing
- —
- Monthly P&I
- —
- Monthly cashflow
- —
- DSCR
- —
- Eligible?
- —
Short-term bridge; refi at stabilization.
Rent comps 3 comps
| Address | Beds | Baths | Sqft | Rent | $/sqft | DOM | Units | Dist |
|---|---|---|---|---|---|---|---|---|
| 3349 147th St Unit 3240 06 Midlothian, IL | 2.0 | 1.0 | 817 | $1,500 | $1.84 | 5d | 1 | 0.93mi |
| 3542 147th St Midlothian, IL | 2.0 | 1.0 | 817 | $1,500 | $1.84 | 6d | 2 | 1.04mi |
| 14521 Richmond Ave Unit 3 Posen, IL | 2.0 | 1.0 | 850 | $1,375 | $1.62 | 24d | 1 | 1.23mi |
Listing history 17 events
-
2026-06-18days on market $235,000 Active 34 DOM
-
2026-06-17days on market $235,000 Active 33 DOM
-
2026-06-16days on market $235,000 Active 32 DOM
-
2026-06-15days on market $235,000 Active 31 DOM
-
2026-06-13days on market $235,000 Active 29 DOM
-
2026-06-09days on market $235,000 Active 25 DOM
-
2026-06-08days on market $235,000 Active 24 DOM
-
2026-06-07days on market $235,000 Active 23 DOM
-
2026-06-04days on market $235,000 Active 20 DOM
-
2026-06-03days on market $235,000 Active 19 DOM
-
2026-06-02days on market $235,000 Active 18 DOM
-
2026-06-01days on market $235,000 Active 17 DOM
-
2026-05-31days on market $235,000 Active 16 DOM
-
2026-05-15$235,000 Active
-
2026-03-13historical
-
2025-09-19Active
-
1978-02-24soldstatus $36,000
ⓘ Source: listings_history table (triggers on properties + properties_extension) + one-shot
backfill from property_details.listing_events for pre-trigger history.
Tax reassessment forecast IL · Partial reset (capped growth)
- Current annual tax
- $4,287 · $357/mo
- Projected year-2 tax
- $4,811 · $401/mo
- Expected delta
- +$524/yr (+$44/mo · 12.2%)
ⓘ Screening estimate from a state-policy table — verify with the county assessor before closing.
Climate risk First Street
- Flood 3/10 Moderate FEMA zone X (unshaded) · 20% chance over 30 yrs
- Wildfire 1/10 Low
- Heat 3/10 Moderate 7 d/yr ≥102°F today · 15 d/yr by 30 yrs out
- Wind 2/10 Low
- Air quality 3/10 Moderate 4 unhealthy d/yr today · 4 by 30 yrs out
Nearby sold comps map
Loading sold comps map…
Walkable amenities ~0.75 mi
Loading nearby amenities…
Taxation est. · year 1
- Rental income
- $17,561
- − Mortgage interest
- −$13,164
- − Property taxes
- −$4,287
- − Insurance
- −$1,175
- − Repairs & maintenance
- −$1,405
- − Management
- −$1,405
- − Depreciation
- −$6,836
- Taxable loss
- −$10,711
- Est. tax savings @ 24.0%
- +$2,571
- After-tax cash flow
- $-3,807/yr
For passive investors: Depreciation is non-cash, so a rental often shows a tax loss while cash-flowing — sheltering income. Rental losses are passive: they offset passive income freely, and up to $25,000/yr can offset ordinary (W-2) income if you actively participate and your MAGI is under $100k (phasing out to $0 by $150k); unused losses carry forward. On sale, claimed depreciation is recaptured at up to 25%, and gains may owe capital-gains tax (a 1031 exchange can defer both). Figures are a year-1 estimate at your 24.0% rate — not tax advice; consult a CPA.
Schools (NCES district)
- District
- Bremen Chsd 228
- NCES district ID
- 1707050
- Math proficiency
- 15% ▼ -4.00%
- Reading proficiency
- 17% ▼ -5.00%
- Median HH income
- $57,625
- Composite
- 15.32/100
- National rank
- #9327
- State rank
- #468 of 620 in IL
Livability — Markham
- Score
- 76/100
- State rank
- #186
- US rank
- #3539
Category grades
Schools grade is shown separately in the Schools card above.
Census & demographics
- Census place
- Markham, IL
- City population
- 10,980
- Population (ZIP)
- 10,980
Population outlook (Cook County) Hauer SSP2
- Today (2025)
- 5,347,519 people
- By 2030
- 5,357,703 · +0.2%
- By 2040
- 5,324,924 · -0.4%
- By 2050
- 5,230,762 · -2.2%
- By 2075
- 4,785,735 · -10.5%
- By 2100
- 4,188,836 · -21.7%
Race, ethnicity, and origin ACS 2023
- Neighborhood character
- Predominantly Black (69%)
- Race & ethnicity
- Black 69% Hispanic / Latino 17% White 11% Two or more races 4%
- Hispanic origin (detail)
- Mexican 16%
- Common ancestry
- Romanian 1% Lithuanian 1% Iranian 1%
- Foreign-born
- 8% · Canada
- Languages at home
- 86% English-only · Spanish 14%
Political lean MEDSL · Cook
- 2024 margin
- Solid D (+42.0) · D 70.4% · R 28.4% · Other 1.2%
- 2008→2024 swing
- -11.4pp toward R · 2008: 53.4pp · 2024: 42.0pp
- All cycles
- 2024: D+42.0 2020: D+50.3 2016: D+53.0 2012: D+49.4 2008: D+53.4
Not yet ingested
- Civics
- —
Market trends
- HPI YoY
- ▲ 23.63%
- Current HPI
- 302.333
- Rent YoY
- —
- Metro
- —
- State GDP YoY
- ▲ 1.59%
- F500 in state
- 60
Industry mix (Fortune 500 HQ in IL)
| Industry | F500 HQs | Revenue |
|---|---|---|
| Insurance | 4 | $201B |
|
||
| Consumer Goods | 4 | $87B |
|
||
| Industrial Machinery | 3 | $64B |
|
||
| Healthcare | 2 | $55B |
|
||
| Retail / Pharmacy | 1 | $148B |
|
||
| Agriculture / Food | 1 | $86B |
|
||
Price history
+552.8% since first listed4 events — show timeline
- 2026-05-15 Listed $235,000 MRED as Distributed by MLS Grid
- 2026-03-13 Listing Removed — MRED as Distributed by MLS Grid
- 2025-09-19 Listed — MRED as Distributed by MLS Grid
- 1978-02-24 Sold (Public Records) $36,000 Public Records
Property tax history
+5.8%/yrLatest (2023): $4,287 · +165.8% YoY. Source: county tax records.
Cash-flow waterfall
monthlySold comps — $/sqft
last 12 mo · ≤1 miLoading sold comps…