8852 W Meadow Brook Cir · Rathdrum, ID
Flood risk 9/10 · Severe
- FEMA flood zone
- AE
- Chance of flooding over 30 yrs
- 0.99%
- Est. flood insurance / yr
- $1,737 – $8,500
Fire risk 6/10 · Moderate
- Est. fire insurance / yr
- $584 – $1,086
Heat risk 2/10 · Minimal
- Hot days now (above 92°F)
- 7 days/yr
- Hot days in 30 yrs
- 15 days/yr
Wind risk 1/10 · Minimal
- Chance of severe wind over 30 yrs
- —
Air-quality risk 8/10 · Major
- Unhealthy air days now
- 15 days/yr
- Unhealthy air days in 30 yrs
- 16 days/yr
Risk factors via First Street. Map © Google.
Why this score? — see what drove the B grade
The composite is a weighted blend of 9 inputs, each scored 0–100. Each bar is that input's sub-score; the figure is the points it added to the 100-point composite (weight × sub-score).
- Cash flow +30.0/30.0
- 1% rule +10.0/10.0
- DSCR +10.0/10.0
- ARV discount +7.5/15.0
- Schools +4.2/10.0
- Condition / age +3.8/5.0
- Livability +3.7/5.0
- Rent growth +2.5/5.0
- Appreciation +0.0/10.0
$59,000
🖨 Deal sheet 📄 Offer letter ✓ Due diligence
Listing remarks
Clean 2 bed 1 bath home newly remodeled. New: Carpet Pad, Carpet, Formica Counters, Toilet, Interior Paint, Lighting, and Deck Paint. Upgraded Appliances.
Key facts
- New lighting
- New carpet
- New deck paint
Tags
Property features AI
Exterior
- Utilities: Public water; Community sewer
- Home design: Manufactured home
- Construction: Aluminum siding; Metal roof; Block foundation; Crawl space (no full basement)
- Exterior features: Covered deck; Open deck; Shed(s); Level lot; Paved road access
Interior
- Kitchen: Electric range; Refrigerator; Dishwasher
- Bedrooms: 2 main-level bedrooms
- Flooring: Carpet; LVP
- Bathrooms: 1 main-level bathroom
- Heating & cooling: Electric heating; Forced air furnace
- Interior features: Washer hookup; Electric dryer hookup
- Laundry & utility: Washer hookup; Electric dryer hookup; Electric water heater
Neighborhood map
What this means for you Summary
Snapshot
- This is a 2-bed/1.0-bath single-family listed at $59k. Condition is rated good.
Deal economics
- At list price, monthly cash flow is $307 ($4k/yr) — positive.
- The deal already cash-flows at list — no discount required.
- Meets the 1% rule at list price ($1k rent vs $59k).
- Recommended offer: $57k (3.0% below list) — sets the bar for market timing.
- Cap rate 21.2% vs local median 1.3% in Rathdrum — top-decile yield for the area; either an underpriced asset or a hidden risk that comps aren't pricing in. Stress-test before assuming the spread holds.
Location & tenants
- Location reads 74/100 on livability (#30 in ID, #4,401 nationally) — a middle-class / working-renter tenant base. Strengths: crime A+, housing A+, health & safety B; Watch: amenities F, commute F.
- Lakeland District (rural): math 41% / reading 57% proficiency, ranked #34 of 92 in ID (top 37%) — families likely to look elsewhere, expect single-tenant / working-renter base with shorter leases.
- Market conditions: 524 active listings in the ZIP; 1,606 units permitted in Kootenai County in 2024 (154 in 5+ unit buildings).
Forward outlook
- Local home prices are declining (-3.0%/yr); year-one equity from $408 of loan paydown is wiped out by about $2k of value loss. Plan a longer hold.
- Kootenai County population projected at +33% by 2050 — long-run rental-demand tailwind backs the buy-and-hold thesis.
- At projected returns (-3.0% appreciation + 3.0% rent growth), your $17k cash investment doubles in ~6 years — after that, you're playing with house money.
Negotiation context
- It's been on market 40 days — a 3% lower offer ($57k) is reasonable based on typical stale-listing flexibility.
Risks & watch-outs
- Watch-outs: flood insurance adds $427/mo.
- Climate carrying-cost: in FEMA flood zone AE (mandatory federal flood insurance); major wildfire risk — expect insurance premiums to compound above CPI over the hold.
Questions for the listing agent
- It's been on market 40 days. Have you received any prior offers? Is the seller open to a 3% concession, seller financing, or rate buy-down credit?
- What's the actual annual flood-insurance premium (NFIP or private), and is the property in a SFHA with mandatory coverage?
- Is there a deadline driving the sale (1031 exchange, divorce, estate, relocation)? That informs how much negotiation room exists.
- What's the average days-on-market for RENTAL listings here right now (not sales)? A rising rental-DOM trend means longer vacancies and softer asking-rent achievability than the comps imply.
- What's the recent tenant-quality profile in this submarket — average credit score on applications, eviction rate, late-payment / NSF rate, and stable-employment percentage? A property-management company in the area should have these aggregated.
- How much new for-sale + rental construction is in the pipeline within 1–3 miles? Heavy new supply typically softens prices + rents 12–24 months out; constrained supply supports both.
Investment metrics
- 1% rule
- 2.45% ✓
- Cap rate
- 21.22%
- Cash-on-cash
- 53.30%
- DSCR
- 3.37
- GRM
- 3.4
CMA / ARV
- ARV (on-the-fly)
- $183,456
- Comps found
- 4
Show comp detail 4 sales within ~0.75 mi
| Address | Dist | Beds/Ba | Sqft | Sold | Price | $/sf | Match |
|---|---|---|---|---|---|---|---|
| 8323 W Meadow Brook Cir | 0.16mi | 2/1.0 | 744 (+2%) | 8mo | $39,000 | $52 | 82 |
| 8274 W Meadowbrook Cir | 0.19mi | 2/1.0 | 728 (0%) | 15mo | $50,000 | $69 | 79 |
| 15036 N Anthony St | 0.26mi | 2/1.0 | 672 (-8%) | 6mo | $169,067 | $252 | 70 |
| 15244 N Alabama | 0.50mi | 2/1.0 | 800 (+10%) | 16mo | $299,900 | $375 | 47 |
Match score weights: distance 35% · size 25% · config 20% · recency 20%. Top-matched comps best support the ARV.
Projected returns pro-forma
-3.0% appreciation · 3.0% rent growth · sell at horizon
- IRR
- 15.5%
- Equity multiple
- 1.62×
- Total profit
- $10,289
- Equity at exit
- $8,797
- IRR
- 24.3%
- Equity multiple
- 3.14×
- Total profit
- $35,307
- Equity at exit
- $5,101
Cash invested: $16,520 (down + closing). Projections, not guarantees.
Landlord ↔ Tenant lean methodology
- Overall (STATE)
- 91 Strongly Landlord-Friendly
- State Idaho
- 91 Strongly Landlord-Friendly · R+18
- County
- — inherits STATE
- City
- — inherits STATE
ZIP-level market 83858
- Home prices YoY
- -22.0%
- Active inventory
- 524
- Price-to-rent
- 3.4×
Monthly cashflow live
- Estimated rent
- $1,445 medium interval (Pro) →
- Mortgage (P&I)
- −$309
- Tax est. 1.5%
- −$74 /mo · $885/yr
- Insurance
- −$25
- Flood insurance flood zone
- −$427 /mo · $5,118/yr
- HOA
- −$0
- Vacancy / Maint / Mgmt
- −$303
- Net cashflow
- $307
Break-even live
UW: 25.0% down · 7.5% · 30yr · 1.5% tax · 5.0% vac · 8.0% maint · 8.0% mgmt
Financing live
Cash to close
- Down payment
- $14,750
- Closing costs
- $1,770
- Reserves months
- —
- Total cash needed
- —
Loan-product check · same deal, 3 products live
Conventional
25% down · 7.5% · 30yr
- Down + closing
- —
- Monthly P&I
- —
- Monthly cashflow
- —
- DSCR
- —
- Eligible?
- —
Personal DTI + credit; lowest rate.
DSCR
20% down · 8.5% · 30yr
- Down + closing
- —
- Monthly P&I
- —
- Monthly cashflow
- —
- DSCR
- —
- Eligible?
- —
No personal income docs; deal must DSCR.
Hard money
10% down · 12.0% · 12mo
- Down + closing
- —
- Monthly P&I
- —
- Monthly cashflow
- —
- DSCR
- —
- Eligible?
- —
Short-term bridge; refi at stabilization.
Listing history 16 events
-
2026-06-19days on market $59,000 Active 40 DOM
-
2026-06-18days on market $59,000 Active 39 DOM
-
2026-06-17days on market $59,000 Active 38 DOM
-
2026-06-16days on market $59,000 Active 37 DOM
-
2026-06-15days on market $59,000 Active 36 DOM
-
2026-06-14days on market $59,000 Active 34 DOM
-
2026-06-13days on market $59,000 Active 33 DOM
-
2026-06-10days on market $59,000 Active 31 DOM
-
2026-06-09days on market $59,000 Active 30 DOM
-
2026-06-08days on market $59,000 Active 29 DOM
-
2026-06-07days on market $59,000 Active 28 DOM
-
2026-06-02days on market $59,000 Active 23 DOM
-
2026-06-01days on market $59,000 Active 22 DOM
-
2026-05-31days on market $59,000 Active 21 DOM
-
2026-05-30days on market $59,000 Active 20 DOM
-
2026-05-09$59,000 Active
ⓘ Source: listings_history table (triggers on properties + properties_extension) + one-shot
backfill from property_details.listing_events for pre-trigger history.
Climate risk First Street
- Flood 9/10 Extreme FEMA zone AE · 99% chance over 30 yrs
- Wildfire 6/10 Major
- Heat 2/10 Low 7 d/yr ≥92°F today · 15 d/yr by 30 yrs out
- Wind 1/10 Low
- Air quality 8/10 Severe 15 unhealthy d/yr today · 16 by 30 yrs out
Nearby sold comps map
Loading sold comps map…
Walkable amenities ~0.75 mi
Loading nearby amenities…
Taxation est. · year 1
- Rental income
- $17,339
- − Mortgage interest
- −$3,305
- − Property taxes
- −$885
- − Insurance
- −$5,414
- − Repairs & maintenance
- −$1,387
- − Management
- −$1,387
- − Depreciation
- −$1,716
- Taxable income
- $3,245
- Est. tax owed @ 24.0%
- −$779
- After-tax cash flow
- $2,908/yr
For passive investors: Depreciation is non-cash, so a rental often shows a tax loss while cash-flowing — sheltering income. Rental losses are passive: they offset passive income freely, and up to $25,000/yr can offset ordinary (W-2) income if you actively participate and your MAGI is under $100k (phasing out to $0 by $150k); unused losses carry forward. On sale, claimed depreciation is recaptured at up to 25%, and gains may owe capital-gains tax (a 1031 exchange can defer both). Figures are a year-1 estimate at your 24.0% rate — not tax advice; consult a CPA.
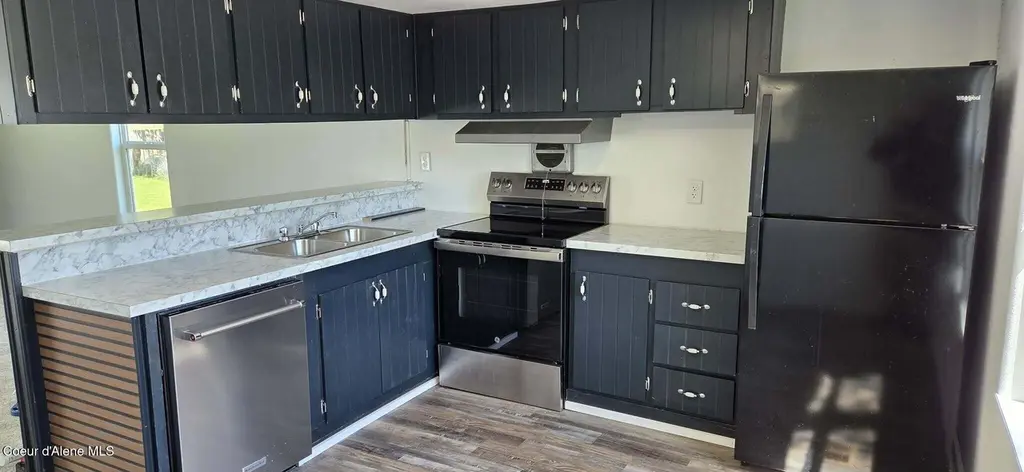
Condition & rehab AI · 12 photos
This home is in good condition with recent cosmetic renovations, making it move-in ready and suitable for both resale and rental markets.
Value-add opportunities
- Both Painting the exterior siding — Enhances curb appeal and can increase both resale and rental value.
- Both Upgrading the flooring to hardwood or tile — Improves the overall aesthetic and can increase both resale and rental value.
- Both Upgrading the appliances to more energy-efficient models — Can increase both resale and rental value by showcasing energy efficiency and modernity.
- Both Adding a smart home system — Can increase both resale and rental value by showcasing modern technology and convenience.
Renovation cost estimate screening
Value-add ROI direction
- Both Painting the exterior siding — Enhances curb appeal and can increase both resale and rental value. ↑
- Both Upgrading the flooring to hardwood or tile — Improves the overall aesthetic and can increase both resale and rental value. ↑
- Both Upgrading the appliances to more energy-efficient models — Can increase both resale and rental value by showcasing energy efficiency and modernity. ↑
- Both Adding a smart home system — Can increase both resale and rental value by showcasing modern technology and convenience. ↑
ⓘ Cost ranges are severity-bucket heuristics (US national rule-of-thumb). Get contractor quotes + a written scope before underwriting a rehab budget.
Schools (NCES district)
- District
- Lakeland District
- NCES district ID
- 1601800
- Math proficiency
- 41% ▼ -6.00%
- Reading proficiency
- 57% ▼ -2.00%
- Median HH income
- $52,454
- Composite
- 42.13/100
- National rank
- #3310
- State rank
- #34 of 92 in ID
Livability — Rathdrum
- Score
- 74/100
- State rank
- #30
- US rank
- #4401
Category grades
Schools grade is shown separately in the Schools card above.
Census & demographics
- Census place
- Rathdrum, ID
- Population (ZIP)
- 19,315
Population outlook (Kootenai County) Hauer SSP2
- Today (2025)
- 177,692 people
- By 2030
- 190,689 · +7.3%
- By 2040
- 214,704 · +20.8%
- By 2050
- 236,510 · +33.1%
- By 2075
- 285,984 · +60.9%
- By 2100
- 316,459 · +78.1%
Race, ethnicity, and origin ACS 2023
- Neighborhood character
- Predominantly White (86%)
- Race & ethnicity
- White 86% Two or more races 10% Hispanic / Latino 7%
- Hispanic origin (detail)
- Mexican 5%
- Common ancestry
- Portuguese 6% Slovak 4% Italian 3%
- Foreign-born
- 2% · Canada
- Languages at home
- 95% English-only · Spanish 3% Russian/Polish/Slavic 0%
Political lean MEDSL · Kootenai
- 2024 margin
- Solid R (+51.9) · D 22.9% · R 74.8% · Other 2.2%
- 2008→2024 swing
- -25.6pp toward R · 2008: -26.3pp · 2024: -51.9pp
- All cycles
- 2024: R+51.9 2020: R+42.9 2016: R+42.5 2012: R+34.3 2008: R+26.3
Not yet ingested
- Civics
- —
Market trends
- HPI YoY
- ▼ -75.25%
- Current HPI
- 266.5011
- Rent YoY
- —
- Metro
- —
- State GDP YoY
- ▲ 4.51%
- F500 in state
- 6
Industry mix (Fortune 500 HQ in ID)
| Industry | F500 HQs | Revenue |
|---|---|---|
| Retail | 1 | $79B |
|
||
| Technology | 1 | $25B |
|
||
| Food / Agriculture | 1 | $6B |
|
||
Price history
1 event — show timeline
- 2026-05-09 Listed $59,000 CDAMLS
Cash-flow waterfall
monthlySold comps — $/sqft
last 12 mo · ≤1 miLoading sold comps…