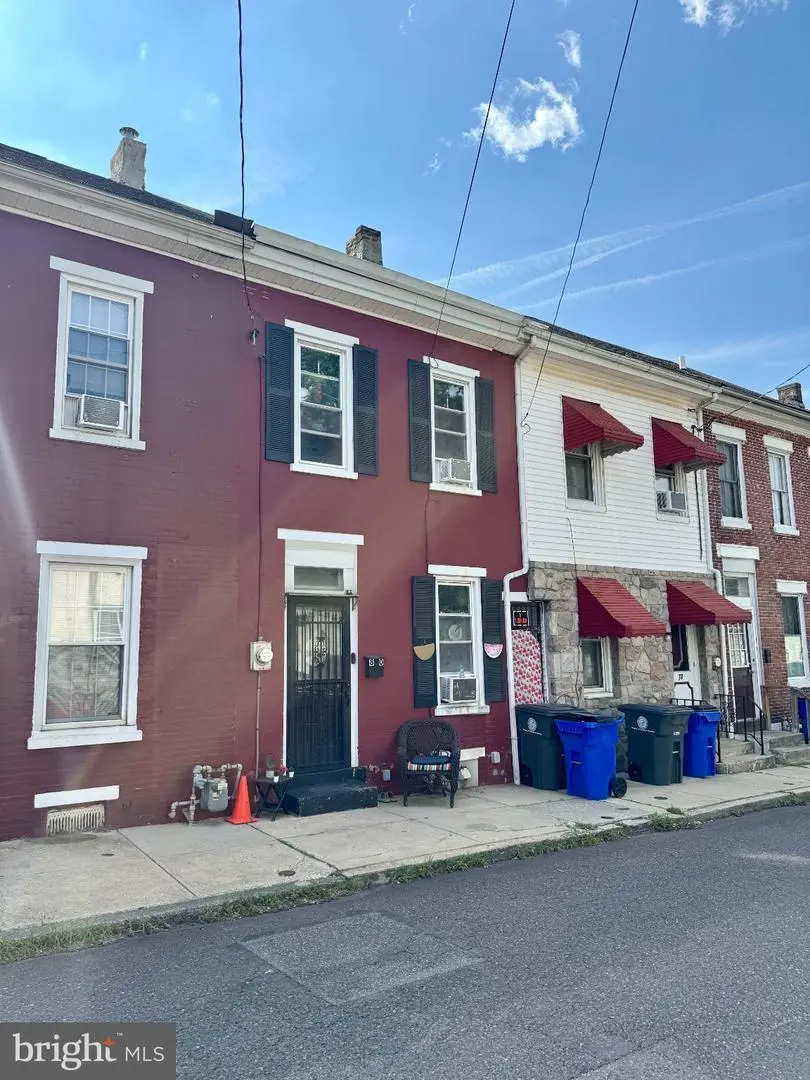
80 N Warren St · Pottstown, PA
Flood risk 1/10 · Minimal
- FEMA flood zone
- X (unshaded)
- Chance of flooding over 30 yrs
- 0.0%
- Est. flood insurance / yr
- $473 – $860
Fire risk 1/10 · Minimal
- Est. fire insurance / yr
- $511 – $949
Heat risk 6/10 · Moderate
- Hot days now (above 102°F)
- 7 days/yr
- Hot days in 30 yrs
- 15 days/yr
Wind risk 4/10 · Minor
- Chance of severe wind over 30 yrs
- 20.0%
Air-quality risk 2/10 · Minimal
- Unhealthy air days now
- 1 days/yr
- Unhealthy air days in 30 yrs
- 3 days/yr
Risk factors via First Street. Map © Google.
Why this score? — see what drove the C+ grade
The composite is a weighted blend of 9 inputs, each scored 0–100. Each bar is that input's sub-score; the figure is the points it added to the 100-point composite (weight × sub-score).
- Cash flow +24.5/30.0
- ARV discount +12.9/15.0
- DSCR +7.9/10.0
- 1% rule +6.9/10.0
- Rent growth +3.7/5.0
- Livability +3.6/5.0
- Condition / age +2.5/5.0
- Schools +1.5/10.0
- Appreciation +0.0/10.0
$135,000
🖨 Deal sheet 📄 Offer letter ✓ Due diligence
Listing remarks MLS
Well maintained 2 bedroom, 1 bath Pottstown row home. Walking distance from shopping and entertainment as well as close to public transportation.
Key facts
- Long term tenant
- Fenced yard
- Kitchen
Tags
Property features AI
Exterior
- Parking: On-street parking
- Utilities: Public water; Public sewer; 100 amp electric service; Natural gas hot water
- Home design: Interior townhouse/rowhouse; Fee simple ownership; Shingle roof
- Construction: Brick construction; Permanent foundation
- Exterior features: Sidewalks; Rear yard
Interior
- Kitchen: Gas oven/range; Refrigerator; Dishwasher not listed
- Bedrooms: Two bedrooms on the first upper level
- Flooring: Fully carpeted areas; Vinyl flooring
- Bathrooms: One full bathroom
- Heating & cooling: Forced air heating (natural gas); Window air conditioning units (electric)
- Interior features: Eat-in kitchen; Unfinished basement
- Laundry & utility: Washer and dryer; Basement laundry
Neighborhood map
What this means for you Summary
Snapshot
- This is a 2-bed/1.0-bath townhouse listed at $135k.
Deal economics
- At list price, monthly cash flow is $276 ($3k/yr) — positive.
- The deal already cash-flows at list — no discount required.
- Meets the 1% rule at list price ($2k rent vs $135k).
- Cap rate 8.7% vs local median 5.0% in Pottstown — top-decile yield for the area; either an underpriced asset or a hidden risk that comps aren't pricing in. Stress-test before assuming the spread holds.
Location & tenants
- Location reads 72/100 on livability (#643 in PA) — a middle-class / working-renter tenant base. Strengths: cost of living A+, housing A+, health & safety A+; Watch: amenities C-, employment D+, crime F.
- Pottstown SD (suburban): math 11% / reading 23% proficiency, ranked #504 of 539 in PA (top 94%) — low school quality limits family demand, transient renter base, plan for 1-2y turnover; 62% free/reduced lunch — lower-income household profile, screen leases tightly.
- Zoned schools: Pottstown Ms (math 6% / reading 20%, grade F, #486 of 512 statewide, top 95%, 915 students, 100% FRL); Pottstown Shs (math 37% / reading 10%, grade F, #379 of 437 statewide, top 87%, 912 students, 100% FRL) — zoned schools average 100% FRL vs 62% district-wide (37 pts higher); higher-poverty schools than district average — tighter screening recommended.
- Market conditions: Rents rising fast (+4.9%/yr); 202 active listings in the ZIP; 30 comparable units currently listed for rent nearby; rentals at typical pace (median 18d on market — plan ~3-4 weeks tenant-placement turnaround); solid renter incomes; 1,936 units permitted in Montgomery County in 2024 (530 in 5+ unit buildings).
Forward outlook
- Local home prices are declining (-3.0%/yr); year-one equity from $933 of loan paydown is wiped out by about $4k of value loss. Plan a longer hold.
- Montgomery County population projected at +5% by 2050 — modest demand growth; plan on rents tracking national, not racing it.
- At projected returns (-3.0% appreciation + 4.9% rent growth), your $38k cash investment doubles in ~10 years — after that, you're playing with house money.
Negotiation context
- Only 1 days on market — expect competitive offers; lowballing is unlikely to land.
- 3 sale attempts since 14y ago with the ask held roughly flat each time — persistent listings suggest the price (not the market) is what's stuck; bring a comps-based counter.
- Current owner paid $44k; list at $135k implies a 207% gain — meaningful room to come down on a strong offer.
Risks & watch-outs
- Watch-outs: built in 1900 — expect roof / HVAC / electrical / plumbing capex.
- Climate carrying-cost: extreme-heat days projected 7→15/yr by 2055 (HVAC capex compounding) — expect insurance premiums to compound above CPI over the hold.
Questions for the listing agent
- Built in 1900 — when were the roof, HVAC, electrical panel, plumbing, and water heater last replaced?
- Is there a deadline driving the sale (1031 exchange, divorce, estate, relocation)? That informs how much negotiation room exists.
- Schools are B-rated — typically a magnet for longer-tenancy family renters. What's the average tenant stay here, and is there a school-zone premium baked into asking?
- Crime grade is F in this area — have there been break-ins, vandalism, or insurance claims at this property in the last 3 years? What carrier currently insures it and at what premium?
- What's the average days-on-market for RENTAL listings here right now (not sales)? A rising rental-DOM trend means longer vacancies and softer asking-rent achievability than the comps imply.
- What's the recent tenant-quality profile in this submarket — average credit score on applications, eviction rate, late-payment / NSF rate, and stable-employment percentage? A property-management company in the area should have these aggregated.
- How much new for-sale + rental construction is in the pipeline within 1–3 miles? Heavy new supply typically softens prices + rents 12–24 months out; constrained supply supports both.
Investment metrics
- 1% rule
- 1.19% ✓
- Cap rate
- 8.75%
- Cash-on-cash
- 8.76%
- DSCR
- 1.39
- GRM
- 7.0
CMA / ARV
- ARV (on-the-fly)
- $153,552
- Comps found
- 12
Show comp detail 12 sales within ~0.75 mi
| Address | Dist | Beds/Ba | Sqft | Sold | Price | $/sf | Match |
|---|---|---|---|---|---|---|---|
| 564 Walnut St | 0.07mi | 2/1.0 | 864 (-6%) | 4mo | $130,000 | $150 | 84 |
| 456 South St | 0.31mi | 2/1.5 | 907 (-1%) | 12mo | $166,900 | $184 | 72 |
| 348-1/2 Lincoln Ave | 0.35mi | 3/1.0 (+1) | 959 (+5%) | 2mo | $120,000 | $125 | 69 |
| 540 Walnut St | 0.09mi | 3/1.0 (+1) | 1,012 (+11%) | 6mo | $169,900 | $168 | 68 |
| 582 Walnut St | 0.06mi | 3/2.0 (+1) | 1,024 (+12%) | 1mo | $270,000 | $264 | 67 |
| 510 Spruce St | 0.62mi | 2/1.0 | 816 (-11%) | 1mo | $70,000 | $86 | 53 |
| 122 Beech St | 0.67mi | 3/1.0 (+1) | 932 (+2%) | 12mo | $228,000 | $245 | 51 |
| 223 N Penn St | 0.54mi | 2/1.0 | 1,008 (+10%) | 16mo | $135,000 | $134 | 44 |
| 215 N Penn St | 0.54mi | 3/1.0 (+1) | 1,024 (+12%) | 8mo | $172,500 | $168 | 43 |
| 516 Spruce St | 0.62mi | 3/1.0 (+1) | 1,035 (+13%) | 6mo | $175,000 | $169 | 39 |
| 865 South St | 0.46mi | 3/1.0 (+1) | 1,013 (+11%) | 22mo | $111,000 | $110 | 37 |
| 907 Queen St | 0.48mi | 3/1.0 (+1) | 1,032 (+13%) | 20mo | $205,000 | $199 | 34 |
Match score weights: distance 35% · size 25% · config 20% · recency 20%. Top-matched comps best support the ARV.
Projected returns pro-forma
-3.0% appreciation · 4.93% rent growth · sell at horizon
- IRR
- -0.7%
- Equity multiple
- 0.97×
- Total profit
- $-1,038
- Equity at exit
- $20,129
- IRR
- 11.0%
- Equity multiple
- 1.94×
- Total profit
- $35,612
- Equity at exit
- $11,672
Cash invested: $37,800 (down + closing). Projections, not guarantees.
Landlord ↔ Tenant lean methodology
- Overall (STATE)
- 62 Landlord-Friendly
- State Pennsylvania
- 62 Landlord-Friendly · EVEN
- County
- — inherits STATE
- City
- — inherits STATE
ZIP-level market 19464
- Rents YoY
- 4.9%
- Active inventory
- 202
- Price-to-rent
- 7.0×
Monthly cashflow live
- Estimated rent
- $1,611 high interval (Pro) →
- Mortgage (P&I)
- −$708
- Tax from tax record
- −$233 /mo · $2,793/yr
- Insurance
- −$56
- HOA
- −$0
- Vacancy / Maint / Mgmt
- −$338
- Net cashflow
- $276
Break-even live
UW: 25.0% down · 7.5% · 30yr · 1.5% tax · 5.0% vac · 8.0% maint · 8.0% mgmt
Financing live
Cash to close
- Down payment
- $33,750
- Closing costs
- $4,050
- Reserves months
- —
- Total cash needed
- —
Loan-product check · same deal, 3 products live
Conventional
25% down · 7.5% · 30yr
- Down + closing
- —
- Monthly P&I
- —
- Monthly cashflow
- —
- DSCR
- —
- Eligible?
- —
Personal DTI + credit; lowest rate.
DSCR
20% down · 8.5% · 30yr
- Down + closing
- —
- Monthly P&I
- —
- Monthly cashflow
- —
- DSCR
- —
- Eligible?
- —
No personal income docs; deal must DSCR.
Hard money
10% down · 12.0% · 12mo
- Down + closing
- —
- Monthly P&I
- —
- Monthly cashflow
- —
- DSCR
- —
- Eligible?
- —
Short-term bridge; refi at stabilization.
Rent comps 30 comps
| Address | Beds | Baths | Sqft | Rent | $/sqft | DOM | Units | Dist |
|---|---|---|---|---|---|---|---|---|
| 420 Chestnut St Unit 2 Pottstown, PA | 2.0 | 1.5 | 1034 | $1,795 | $1.74 | 16d | 1 | 0.22mi |
| 541 Lincoln Ave Pottstown, PA | 3.0 | 1.0 | 1094 | $1,975 | $1.81 | 24d | 1 | 0.24mi |
| 60 N Franklin St Unit 2 Pottstown, PA | 1.0 | 1.0 | 850 | $1,100 | $1.29 | 24d | 1 | 0.26mi |
| 384 E High St Apt 3 Pottstown, PA | 1.0 | 1.0 | 700 | $1,100 | $1.57 | 14d | 1 | 0.31mi |
| 450 South St Pottstown, PA | 3.0 | 1.5 | 1024 | $1,995 | $1.95 | 43d | 1 | 0.32mi |
| 824 E High St Unit 3 Pottstown, PA | 2.0 | 2.0 | 900 | $1,650 | $1.83 | 43d | 1 | 0.32mi |
| 113 S Washington St Unit B Pottstown, PA | 2.0 | 1.0 | 1000 | $1,700 | $1.70 | 5d | 1 | 0.33mi |
| 814 South St Pottstown, PA | 3.0 | 1.0 | 1008 | $1,995 | $1.98 | 24d | 1 | 0.40mi |
| 308 Walnut St Pottstown, PA | 3.0 | 1.0 | 888 | $1,950 | $2.20 | 4d | 1 | 0.43mi |
| 56 S Charlotte St Pottstown, PA | 2.0 | 1.5 | 909 | $1,520 | $1.67 | 1d | 1 | 0.48mi |
| 265 Beech St Pottstown, PA | 1.0 | 1.0 | 600 | $1,150 | $1.92 | 43d | 1 | 0.49mi |
| 262 Beech St Unit 2 Pottstown, PA | 2.0 | 1.0 | 1000 | $1,550 | $1.55 | 43d | 1 | 0.49mi |
| 20 S Hanover St Unit 2B Pottstown, PA | 1.0 | 1.0 | 800 | $1,400 | $1.75 | 17d | 1 | 0.60mi |
| 151 N Hanover St Unit 1 Pottstown, PA | 2.0 | 1.0 | 1000 | $1,600 | $1.60 | 18d | 1 | 0.61mi |
| 148 Walnut St Unit 2 Pottstown, PA | 1.0 | 1.0 | 900 | $1,400 | $1.56 | 24d | 1 | 0.63mi |
| 113 King St Pottstown, PA | 1.0 | 1.0 | 600 | $1,000 | $1.67 | 1d | 1 | 0.69mi |
| 657 N Charlotte St Unit 2 Pottstown, PA | 2.0 | 1.0 | 1050 | $1,700 | $1.62 | 1d | 1 | 0.71mi |
| 261 N York St Unit A Pottstown, PA | 3.0 | 1.0 | 800 | $1,550 | $1.94 | 43d | 1 | 0.74mi |
| 261 N York St Pottstown, PA | 2.0 | 1.0 | 800 | $1,700 | $2.12 | 18d | 1 | 0.74mi |
| 261 N York St Unit F Pottstown, PA | 1.0 | 1.0 | 600 | $1,250 | $2.08 | 24d | 1 | 0.74mi |
| 63 King St Unit 2 Pottstown, PA | 1.0 | 1.0 | 800 | $1,300 | $1.62 | 24d | 1 | 0.74mi |
| 48 Chestnut St #2 Pottstown, PA | 3.0 | 1.0 | 1100 | $1,700 | $1.55 | 43d | 1 | 0.76mi |
| 24 E 5th St Pottstown, PA | 2.0 | 1.0 | 796 | $1,700 | $2.14 | 18d | 1 | 0.79mi |
| 5 E 2nd St Pottstown, PA | 3.0 | 1.5 | 1085 | $2,000 | $1.84 | 2d | 1 | 0.83mi |
| 207 Manatawny St Unit B Pottstown, PA | 2.0 | 1.0 | 900 | $1,350 | $1.50 | 2d | 1 | 0.93mi |
| 1412 Cherry Ln Pottstown, PA | 3.0 | 1.0 | 1080 | $2,200 | $2.04 | 1d | 1 | 1.11mi |
| 644 Kline Ave Pottstown, PA | 2.0 | 1.0–1.5 | 1103 | $2,195 | $1.99 | 1d | 2 | 1.20mi |
| 94 Hillside Dr Pottstown, PA | 2.0 | 1.0 | 965 | $1,862 | $1.93 | 1d | 4 | 1.27mi |
| 422 Upland St Pottstown, PA | 2.0–3.0 | 1.0–2.0 | 1082 | $1,650 | $1.52 | 1d | 5 | 1.29mi |
| 735 Fisher Ave Unit 2 Pottstown, PA | 2.0 | 1.0 | 850 | $1,550 | $1.82 | 24d | 1 | 1.44mi |
Listing history 2 events
-
2026-06-18remarks 461-char remark
-
2026-06-18$135,000 Active 1 DOM
ⓘ Source: listings_history table (triggers on properties + properties_extension) + one-shot
backfill from property_details.listing_events for pre-trigger history.
Tax reassessment forecast PA · Partial reset (capped growth)
- Current annual tax
- $2,793 · $233/mo
- Projected year-2 tax
- $2,793 · $233/mo
- Expected delta
- $0/yr ($0/mo · 0.0%)
ⓘ Screening estimate from a state-policy table — verify with the county assessor before closing.
Climate risk First Street
- Flood 1/10 Low FEMA zone X (unshaded) · 0% chance over 30 yrs
- Wildfire 1/10 Low
- Heat 6/10 Major 7 d/yr ≥102°F today · 15 d/yr by 30 yrs out
- Wind 4/10 Moderate 20% chance of damaging wind over 30 yrs
- Air quality 2/10 Low 1 unhealthy d/yr today · 3 by 30 yrs out
Nearby sold comps map
Loading sold comps map…
Walkable amenities ~0.75 mi
Loading nearby amenities…
Taxation est. · year 1
- Rental income
- $19,338
- − Mortgage interest
- −$7,562
- − Property taxes
- −$2,793
- − Insurance
- −$675
- − Repairs & maintenance
- −$1,547
- − Management
- −$1,547
- − Depreciation
- −$3,927
- Taxable income
- $1,286
- Est. tax owed @ 24.0%
- −$309
- After-tax cash flow
- $3,004/yr
For passive investors: Depreciation is non-cash, so a rental often shows a tax loss while cash-flowing — sheltering income. Rental losses are passive: they offset passive income freely, and up to $25,000/yr can offset ordinary (W-2) income if you actively participate and your MAGI is under $100k (phasing out to $0 by $150k); unused losses carry forward. On sale, claimed depreciation is recaptured at up to 25%, and gains may owe capital-gains tax (a 1031 exchange can defer both). Figures are a year-1 estimate at your 24.0% rate — not tax advice; consult a CPA.
Schools (NCES district)
- District
- Pottstown SD
- NCES district ID
- 4219680
- Math proficiency
- 11% ▼ -12.00%
- Reading proficiency
- 23% ▼ -19.00%
- Median HH income
- $43,739
- Composite
- 14.78/100
- National rank
- #9390
- State rank
- #504 of 539 in PA
Livability — Pottstown
- Score
- 72/100
- State rank
- #643
- US rank
- #6257
Category grades
Schools grade is shown separately in the Schools card above.
Census & demographics
- Census place
- Pottstown, PA
- County
- Montgomery County · 712,331 people
- City population
- 49,101
- Metro
- Philadelphia-Camden-Wilmington, PA-NJ-DE-MD
- Population (ZIP)
- 49,101
- Household income
- $79,787
- Rent vs Own
- Severe rent burden
- 1797.0
Population outlook (Montgomery County) Hauer SSP2
- Today (2025)
- 856,074 people
- By 2030
- 870,887 · +1.7%
- By 2040
- 891,195 · +4.1%
- By 2050
- 896,417 · +4.7%
- By 2075
- 903,212 · +5.5%
- By 2100
- 843,240 · -1.5%
Race, ethnicity, and origin ACS 2023
- Neighborhood character
- Predominantly White (69%)
- Race & ethnicity
- White 69% Black 15% Two or more races 9% Hispanic / Latino 9% Asian 2%
- Hispanic origin (detail)
- Mexican 2% Puerto Rican 5%
- Common ancestry
- Romanian 7% Polish 2% Iranian 2%
- Foreign-born
- 6% · Canada, China
- Languages at home
- 92% English-only · Spanish 4% Arabic 1% Other Indo-European 1%
Political lean MEDSL · Montgomery
- 2024 margin
- Strong D (+22.8) · D 60.9% · R 38.1% · Other 1.1%
- 2008→2024 swing
- +2.0pp toward D · 2008: 20.8pp · 2024: 22.8pp
- All cycles
- 2024: D+22.8 2020: D+26.3 2016: D+21.1 2012: D+14.3 2008: D+20.8
Not yet ingested
- Civics
- —
Market trends
- HPI YoY
- ▼ -253.73%
- Current HPI
- 271.9399
- Rent YoY
- ▲ 4.93%
- Metro
- Philadelphia-Camden-Wilmington, PA-NJ-DE-MD
- State GDP YoY
- ▲ 1.68%
- F500 in state
- 34
Industry mix (Fortune 500 HQ in PA)
| Industry | F500 HQs | Revenue |
|---|---|---|
| Healthcare | 2 | $309B |
|
||
| Insurance | 2 | $27B |
|
||
| Telecommunications / Media | 1 | $124B |
|
||
| Industrial Distribution | 1 | $22B |
|
||
| Financial Services | 1 | $20B |
|
||
| Chemicals / Materials | 1 | $18B |
|
||
Price history
+125.4% since first listed8 events — show timeline
- 2026-06-18 Listed $135,000 BRIGHT MLS
- 2012-12-24 Sold (Public Records) $44,000 Public Records
- 2012-12-21 Sold (MLS) $44,000 TREND
- 2012-12-21 Sold (MLS) $44,000 BRIGHT MLS
- 2012-11-05 Pending — TREND
- 2012-10-28 Listing Removed — BRIGHT MLS
- 2012-10-08 Listed $59,900 TREND
- 2012-10-08 Listed $59,900 BRIGHT MLS
Property tax history
+2.1%/yrLatest (2026): $2,793 · +5.1% YoY. Source: county tax records.
Cash-flow waterfall
monthlySold comps — $/sqft
last 12 mo · ≤1 miLoading sold comps…