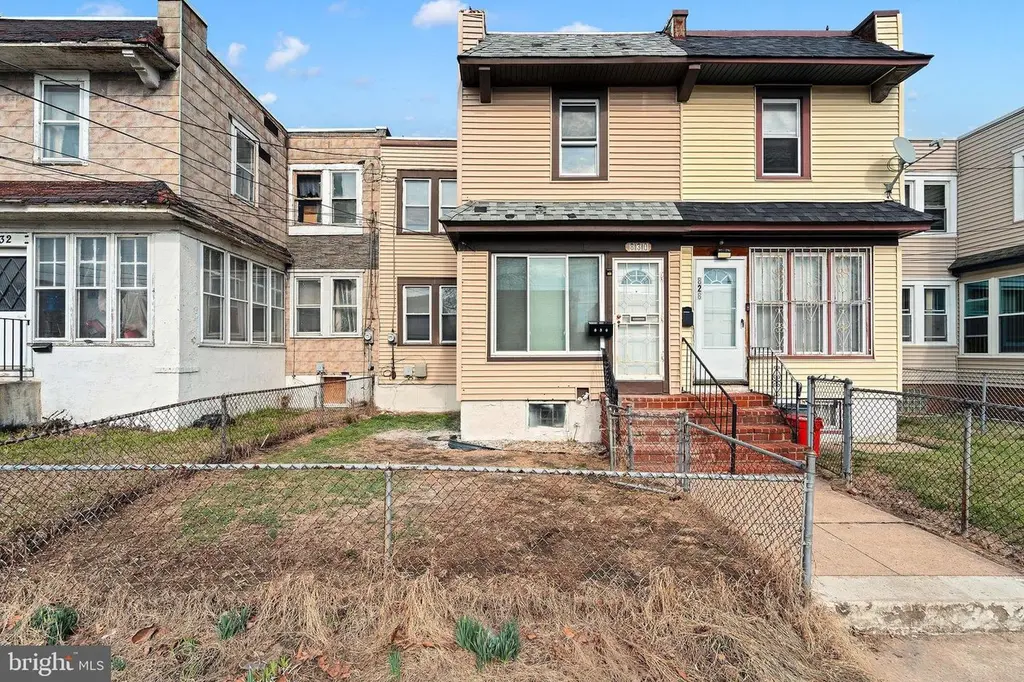
830 N 32nd St · Camden, NJ
Flood risk 1/10 · Minimal
- FEMA flood zone
- X (unshaded)
- Chance of flooding over 30 yrs
- 0.0%
- Est. flood insurance / yr
- $507 – $1,088
Fire risk 1/10 · Minimal
- Est. fire insurance / yr
- $526 – $976
Heat risk 7/10 · Major
- Hot days now (above 104°F)
- 7 days/yr
- Hot days in 30 yrs
- 15 days/yr
Wind risk 6/10 · Moderate
- Chance of severe wind over 30 yrs
- 27.0%
Air-quality risk 4/10 · Minor
- Unhealthy air days now
- 5 days/yr
- Unhealthy air days in 30 yrs
- 6 days/yr
Risk factors via First Street. Map © Google.
Why this score? — see what drove the D+ grade
The composite is a weighted blend of 9 inputs, each scored 0–100. Each bar is that input's sub-score; the figure is the points it added to the 100-point composite (weight × sub-score).
- Cash flow +16.3/30.0
- ARV discount +15.0/15.0
- DSCR +5.1/10.0
- 1% rule +4.2/10.0
- Livability +3.5/5.0
- Rent growth +2.5/5.0
- Condition / age +2.5/5.0
- Schools +0.7/10.0
- Appreciation +0.0/10.0
$225,000
🖨 Deal sheet 📄 Offer letter ✓ Due diligence
Listing remarks
Recently remodeled 3 Bedroom home situated in the extremely desirable Cramer Hill section of BOOMING Camden! Property features updated flooring, fresh custom paint job, recessed lighting & six-paneled doors throughout. Sun room at entrance is bright and airy, with an abundance of natural light flooding in through a wall of windows, leading to a spacious living room with cozy stone fireplace. Renovated kitchen offers new LVP flooring, stylish blue-grey shaker cabinets, quartz countertops with an island & stainless steel appliances. Three generously sized bedrooms are located upstairs, along with a full bathroom offering tiled floor, matching custom tiled tub surround, high-effici
Key facts
- Sun room
- Natural light
- Updated flooring
Tags
Neighborhood map
What this means for you Summary
Snapshot
- This is a 3-bed/1.0-bath single-family listed at $225k.
Deal economics
- At list price, monthly cash flow is $125 ($2k/yr) — positive.
- The deal already cash-flows at list — no discount required.
- To meet the 1% rule (rent ≥ 1% of price), the offer needs to be $206k (8.4% below list).
- Recommended offer: $206k (8.4% below list) — sets the bar for 1% rule.
Location & tenants
- Location reads 70/100 on livability (#262 in NJ) — a middle-class / working-renter tenant base. Strengths: amenities A+, commute A+, cost of living A; Watch: schools F, crime F, employment F.
- Camden City School District (urban): math 3% / reading 16% proficiency, ranked #472 of 472 in NJ (top 100%) — low school quality limits family demand, transient renter base, plan for 1-2y turnover; 86% free/reduced lunch — lower-income household profile, screen leases tightly.
- Market conditions: 59 active listings in the ZIP; 10 comparable units currently listed for rent nearby; rentals at typical pace (median 24d on market — plan ~3-4 weeks tenant-placement turnaround); 1,018 units permitted in Camden County in 2024 (509 in 5+ unit buildings).
Forward outlook
- Local home prices are declining (-3.0%/yr); year-one equity from $2k of loan paydown is wiped out by about $7k of value loss. Plan a longer hold.
- Camden County population projected to shrink 8% by 2050 — rents likely to lag national; underwrite the cash flow, not the appreciation.
Negotiation context
- It's been on market 36 days — a 3% lower offer ($218k) is reasonable based on typical stale-listing flexibility.
- Current owner paid $150k; list at $225k implies a 50% gain — meaningful room to come down on a strong offer.
Risks & watch-outs
- Watch-outs: built in 1920 — expect roof / HVAC / electrical / plumbing capex.
- Climate carrying-cost: major wind risk, 27% chance of damaging wind over 30y; extreme-heat days projected 7→15/yr by 2055 (HVAC capex compounding) — expect insurance premiums to compound above CPI over the hold.
Questions for the listing agent
- It's been on market 36 days. Have you received any prior offers? Is the seller open to a 8% concession, seller financing, or rate buy-down credit?
- Built in 1920 — when were the roof, HVAC, electrical panel, plumbing, and water heater last replaced?
- Is there a deadline driving the sale (1031 exchange, divorce, estate, relocation)? That informs how much negotiation room exists.
- Schools are F-rated, which usually means shorter tenancies and higher turnover. Who's the typical renter profile here, and what's been the actual vacancy rate?
- Crime grade is F in this area — have there been break-ins, vandalism, or insurance claims at this property in the last 3 years? What carrier currently insures it and at what premium?
- The area grade is low — what's the realistic commute time and amenity access for the typical tenant pool here? Any planned neighborhood developments (good or bad) we should know about?
- What's the average days-on-market for RENTAL listings here right now (not sales)? A rising rental-DOM trend means longer vacancies and softer asking-rent achievability than the comps imply.
- What's the recent tenant-quality profile in this submarket — average credit score on applications, eviction rate, late-payment / NSF rate, and stable-employment percentage? A property-management company in the area should have these aggregated.
- How much new for-sale + rental construction is in the pipeline within 1–3 miles? Heavy new supply typically softens prices + rents 12–24 months out; constrained supply supports both.
Investment metrics
- 1% rule
- 0.92% ✗
- Cap rate
- 6.96%
- Cash-on-cash
- 2.38%
- DSCR
- 1.11
- GRM
- 9.1
CMA / ARV
- ARV (on-the-fly)
- $288,248
- Comps found
- 12
Show comp detail 12 sales within ~0.75 mi
| Address | Dist | Beds/Ba | Sqft | Sold | Price | $/sf | Match |
|---|---|---|---|---|---|---|---|
| 840 N 30th St | 0.19mi | 3/1.0 | 1,088 (+3%) | 14mo | $240,000 | $221 | 74 |
| 908 Bergen | 0.10mi | 3/1.0 | 921 (-12%) | 14mo | $204,900 | $222 | 63 |
| 370 N 34th St | 0.49mi | 3/2.0 | 986 (-6%) | 1mo | $270,000 | $274 | 62 |
| 2423 Sherman Ave | 0.56mi | 2/1.0 (-1) | 994 (-6%) | 3mo | $95,000 | $96 | 57 |
| 1627 44th St | 0.58mi | 3/2.0 | 1,092 (+4%) | 6mo | $339,000 | $310 | 57 |
| 2825 Thompson St | 0.49mi | 3/2.0 | 1,144 (+9%) | 8mo | $150,000 | $131 | 52 |
| 1615 47th St | 0.72mi | 4/1.0 (+1) | 1,066 (+1%) | 11mo | $325,000 | $305 | 50 |
| 1408 Hillside Ter | 0.47mi | 4/2.0 (+1) | 1,140 (+8%) | 6mo | $325,000 | $285 | 50 |
| 243 N 40th St | 0.71mi | 3/2.0 | 1,120 (+6%) | 6mo | $229,900 | $205 | 47 |
| 435 N 41st St | 0.58mi | 3/1.0 | 1,175 (+12%) | 7mo | $369,000 | $314 | 47 |
| 1542 44th St | 0.59mi | 3/1.5 | 1,162 (+10%) | 10mo | $280,000 | $241 | 45 |
| 2738 Lincoln Ave | 0.49mi | 4/2.0 (+1) | 920 (-12%) | 5mo | $320,000 | $348 | 43 |
Match score weights: distance 35% · size 25% · config 20% · recency 20%. Top-matched comps best support the ARV.
Projected returns pro-forma
-3.0% appreciation · 3.0% rent growth · sell at horizon
- IRR
- -12.5%
- Equity multiple
- 0.55×
- Total profit
- $-28,499
- Equity at exit
- $33,548
- IRR
- -3.5%
- Equity multiple
- 0.77×
- Total profit
- $-14,568
- Equity at exit
- $19,454
Cash invested: $63,000 (down + closing). Projections, not guarantees.
Landlord ↔ Tenant lean methodology
- Overall (STATE)
- 21 Tenant-Leaning
- State New Jersey
- 21 Tenant-Leaning · D+6
- County
- — inherits STATE
- City
- — inherits STATE
ZIP-level market 08105
- Home prices YoY
- -30.6%
- Active inventory
- 59
- Price-to-rent
- 9.1×
Monthly cashflow live
- Estimated rent
- $2,060 high interval (Pro) →
- Mortgage (P&I)
- −$1,180
- Tax from tax record
- −$229 /mo · $2,747/yr
- Insurance
- −$94
- HOA
- −$0
- Vacancy / Maint / Mgmt
- −$433
- Net cashflow
- $125
Break-even live
UW: 25.0% down · 7.5% · 30yr · 1.5% tax · 5.0% vac · 8.0% maint · 8.0% mgmt
Financing live
Cash to close
- Down payment
- $56,250
- Closing costs
- $6,750
- Reserves months
- —
- Total cash needed
- —
Loan-product check · same deal, 3 products live
Conventional
25% down · 7.5% · 30yr
- Down + closing
- —
- Monthly P&I
- —
- Monthly cashflow
- —
- DSCR
- —
- Eligible?
- —
Personal DTI + credit; lowest rate.
DSCR
20% down · 8.5% · 30yr
- Down + closing
- —
- Monthly P&I
- —
- Monthly cashflow
- —
- DSCR
- —
- Eligible?
- —
No personal income docs; deal must DSCR.
Hard money
10% down · 12.0% · 12mo
- Down + closing
- —
- Monthly P&I
- —
- Monthly cashflow
- —
- DSCR
- —
- Eligible?
- —
Short-term bridge; refi at stabilization.
Rent comps 10 comps
| Address | Beds | Baths | Sqft | Rent | $/sqft | DOM | Units | Dist |
|---|---|---|---|---|---|---|---|---|
| 106 N 34th St Unit B Camden, NJ | 3.0 | 2.0 | 900 | $1,950 | $2.17 | 24d | 1 | 0.74mi |
| 4601 High St Pennsauken, NJ | 1.0–2.0 | 1.0 | 800 | $1,675 | $2.09 | 3d | 4 | 0.74mi |
| 2752 Mickle St Camden, NJ | 3.0 | 1.0 | 1450 | $1,850 | $1.28 | 16d | 1 | 0.90mi |
| 324 S 27th St Camden, NJ | 3.0 | 1.0 | 1152 | $1,900 | $1.65 | 24d | 1 | 1.10mi |
| 4621 Woodland Ave Pennsauken, NJ | 3.0 | 1.5 | 1148 | $2,200 | $1.92 | 24d | 1 | 1.11mi |
| 380 Garden Ave Camden, NJ | 2.0 | 2.0 | 1184 | $2,100 | $1.77 | 24d | 1 | 1.13mi |
| 2323 Browning Rd Pennsauken, NJ | 3.0 | 1.0 | 923 | $2,500 | $2.71 | 24d | 1 | 1.14mi |
| 1535 Gross Ave Pennsauken, NJ | 3.0 | 1.0 | 1272 | $2,150 | $1.69 | 24d | 1 | 1.16mi |
| 2277 Hollinshed Ave Pennsauken, NJ | 3.0 | 1.5 | 1164 | $2,400 | $2.06 | 24d | 1 | 1.38mi |
| 5729 Irving Ave Pennsauken, NJ | 3.0 | 1.5 | 1200 | $2,150 | $1.79 | 16d | 1 | 1.48mi |
Listing history 4 events
-
2026-04-21status Pending
-
2026-03-16$225,000 Active
-
2026-02-05soldstatus $150,000
-
1986-07-30soldstatus $29,000
ⓘ Source: listings_history table (triggers on properties + properties_extension) + one-shot
backfill from property_details.listing_events for pre-trigger history.
Tax reassessment forecast NJ · Partial reset (capped growth)
- Current annual tax
- $2,747 · $229/mo
- Projected year-2 tax
- $4,175 · $348/mo
- Expected delta
- +$1,428/yr (+$119/mo · 52.0%)
ⓘ Screening estimate from a state-policy table — verify with the county assessor before closing.
Climate risk First Street
- Flood 1/10 Low FEMA zone X (unshaded) · 0% chance over 30 yrs
- Wildfire 1/10 Low
- Heat 7/10 Severe 7 d/yr ≥104°F today · 15 d/yr by 30 yrs out
- Wind 6/10 Major 27% chance of damaging wind over 30 yrs
- Air quality 4/10 Moderate 5 unhealthy d/yr today · 6 by 30 yrs out
Nearby sold comps map
Loading sold comps map…
Walkable amenities ~0.75 mi
Loading nearby amenities…
Taxation est. · year 1
- Rental income
- $24,723
- − Mortgage interest
- −$12,603
- − Property taxes
- −$2,747
- − Insurance
- −$1,125
- − Repairs & maintenance
- −$1,978
- − Management
- −$1,978
- − Depreciation
- −$6,545
- Taxable loss
- −$2,254
- Est. tax savings @ 24.0%
- +$541
- After-tax cash flow
- $2,041/yr
For passive investors: Depreciation is non-cash, so a rental often shows a tax loss while cash-flowing — sheltering income. Rental losses are passive: they offset passive income freely, and up to $25,000/yr can offset ordinary (W-2) income if you actively participate and your MAGI is under $100k (phasing out to $0 by $150k); unused losses carry forward. On sale, claimed depreciation is recaptured at up to 25%, and gains may owe capital-gains tax (a 1031 exchange can defer both). Figures are a year-1 estimate at your 24.0% rate — not tax advice; consult a CPA.
Schools (NCES district)
- District
- Camden City School District
- NCES district ID
- 3402640
- Math proficiency
- 3% ▼ -6.00%
- Reading proficiency
- 16% ▬ 0.00%
- Median HH income
- $25,845
- Composite
- 6.85/100
- National rank
- #9981
- State rank
- #472 of 472 in NJ
Livability — Camden
- Score
- 70/100
- State rank
- #262
- US rank
- #7721
Category grades
Schools grade is shown separately in the Schools card above.
Census & demographics
- Census place
- Camden, NJ
- City population
- 20,865
- Population (ZIP)
- 26,681
Population outlook (Camden County) Hauer SSP2
- Today (2025)
- 507,964 people
- By 2030
- 502,182 · -1.1%
- By 2040
- 485,602 · -4.4%
- By 2050
- 465,630 · -8.3%
- By 2075
- 419,986 · -17.3%
- By 2100
- 369,492 · -27.3%
Race, ethnicity, and origin ACS 2023
- Neighborhood character
- Predominantly Hispanic (71%)
- Race & ethnicity
- Hispanic / Latino 71% Black 24% Two or more races 11% Asian 2% White 1% Native American 1%
- Hispanic origin (detail)
- Mexican 9% Puerto Rican 33% Dominican 20%
- Common ancestry
- Russian 1%
- Foreign-born
- 28% · Canada, Vietnam
- Languages at home
- 36% English-only · Spanish 59% French/Haitian/Cajun 2% Vietnamese 1%
Political lean MEDSL · Camden
- 2024 margin
- Strong D (+27.4) · D 63.0% · R 35.5% · Other 1.5%
- 2008→2024 swing
- -8.8pp toward R · 2008: 36.2pp · 2024: 27.4pp
- All cycles
- 2024: D+27.4 2020: D+33.5 2016: D+32.4 2012: D+36.6 2008: D+36.2
Not yet ingested
- Civics
- —
Market trends
- HPI YoY
- ▼ -130.41%
- Current HPI
- 295.6492
- Rent YoY
- —
- Metro
- —
- State GDP YoY
- ▲ 2.05%
- F500 in state
- 34
Industry mix (Fortune 500 HQ in NJ)
| Industry | F500 HQs | Revenue |
|---|---|---|
| Consumer Goods | 3 | $31B |
|
||
| Pharmaceuticals | 2 | $153B |
|
||
| Technology | 2 | $21B |
|
||
| Insurance | 2 | $20B |
|
||
| Healthcare | 2 | $19B |
|
||
| Financial Services | 1 | $70B |
|
||
Price history
+675.9% since first listed4 events — show timeline
- 2026-04-21 Pending — BRIGHT MLS
- 2026-03-16 Listed $225,000 BRIGHT MLS
- 2026-02-05 Sold (Public Records) $150,000 Public Records
- 1986-07-30 Sold (Public Records) $29,000 Public Records
Property tax history
+4.9%/yrLatest (2025): $2,747 · +4.1% YoY. Source: county tax records.
Cash-flow waterfall
monthlySold comps — $/sqft
last 12 mo · ≤1 miLoading sold comps…