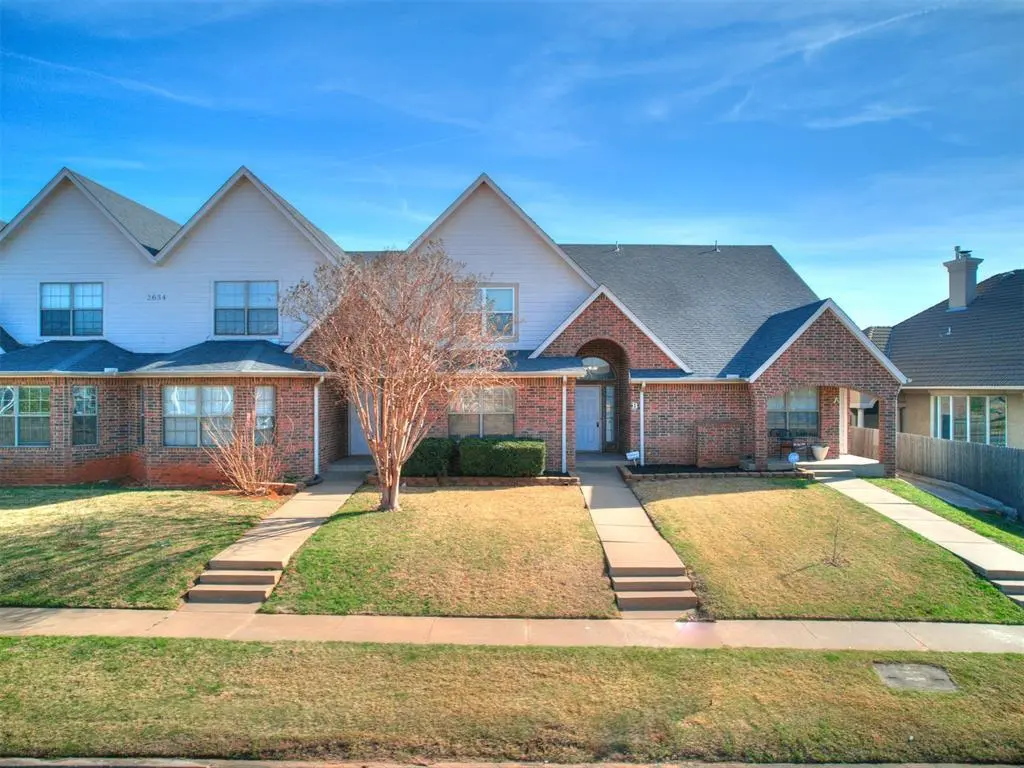
2634 Featherstone Rd Unit B · Oklahoma City, OK
Flood risk 1/10 · Minimal
- FEMA flood zone
- X (unshaded)
- Chance of flooding over 30 yrs
- 0.0%
- Est. flood insurance / yr
- $507 – $1,088
Fire risk 1/10 · Minimal
- Est. fire insurance / yr
- $2,463 – $4,575
Heat risk 6/10 · Moderate
- Hot days now (above 107°F)
- 7 days/yr
- Hot days in 30 yrs
- 19 days/yr
Wind risk 2/10 · Minimal
- Chance of severe wind over 30 yrs
- 4.0%
Air-quality risk 2/10 · Minimal
- Unhealthy air days now
- 1 days/yr
- Unhealthy air days in 30 yrs
- 1 days/yr
Risk factors via First Street. Map © Google.
Why this score? — see what drove the D grade
The composite is a weighted blend of 9 inputs, each scored 0–100. Each bar is that input's sub-score; the figure is the points it added to the 100-point composite (weight × sub-score).
- Cash flow +12.8/30.0
- ARV discount +7.5/15.0
- 1% rule +5.2/10.0
- Livability +4.0/5.0
- DSCR +3.8/10.0
- Schools +3.6/10.0
- Rent growth +3.0/5.0
- Condition / age +2.5/5.0
- Appreciation +0.0/10.0
$174,900
🖨 Deal sheet (PDF) 📄 Offer letter ✓ Due diligence
Listing remarks
* * PRICE IMPROVEMENT OF $5,100.00 * * NEW PAINT & FLOORING THROUGHOUT — INCREDIBLE VALUE IN A FANTASTIC LOCATION located in Edmond School District! Welcome home to this charming 3-bedroom, 2-bath condominium featuring an attached 2-car garage, perfectly located in the heart of NW Oklahoma City. Enjoy quick access to local turnpikes, shopping, dining, Quail Springs Mall, and all the conveniences the area has to offer. Step inside to find fresh updates throughout, including brand-new luxury vinyl plank flooring on the main level, creating a warm and inviting space to relax or gather with friends and family. The first floor offers a flexible bedroom or office with a closet and
Key facts
- Attached garage
- New flooring
- New paint
Tags
Property features AI
Finance
- Other: Home reported as vacant; Handicap accessible
- Financial info: Loan qualification: Yes
- HOA & community: Mandatory association dues; Association fee includes common area maintenance and exterior maintenance
Exterior
- Parking: 2-car garage
- Utilities: No storm shelter
- Home design: Residential condominium; Two-level property; North-facing
- Construction: Brick and frame construction; Shingle roof (replaced/updated 2013); Slab foundation
- Exterior features: Covered porch; Interior lot
Interior
- Kitchen: Free-standing electric range/oven
- Bedrooms: 3 bedrooms
- Bathrooms: 2 full bathrooms
- Heating & cooling: Electric heating
- Interior features: In-law plan; Accessible bedroom; Accessible central living area; Living area
- Laundry & utility: Slab foundation (utility access at slab)
Neighborhood map
What this means for you Summary
Snapshot
- This is a 3-bed/2.0-bath condo listed at $175k.
Deal economics
- At list price, monthly cash flow is $-18 ($-211/yr) — negative.
- To cash-flow at today's rent, offer at most $172k (1.8% below list).
- Meets the 1% rule at list price ($2k rent vs $175k).
- Recommended offer: $170k (3.0% below list) — sets the bar for market timing.
- Cap rate 6.2% vs local median 3.7% in Oklahoma City — top-decile yield for the area; either an underpriced asset or a hidden risk that comps aren't pricing in. Stress-test before assuming the spread holds.
Location & tenants
- Location reads 80/100 on livability (#3 in OK, #1,635 nationally) — a professional / high-income tenant draw. Strengths: amenities A+, commute A+, cost of living A+; Watch: crime F.
- Edmond (suburban): math 38% / reading 40% proficiency, ranked #11 of 270 in OK (top 4%) — families likely to look elsewhere, expect single-tenant / working-renter base with shorter leases.
- Zoned schools: Angie Debo Es (math 32% / reading 27%, grade F, #255 of 845 statewide, top 35%, 579 students, 0% FRL); Summit Ms (math 22% / reading 27%, grade F, #97 of 345 statewide, top 31%, 940 students, 0% FRL); Santa Fe Hs (math 36% / reading 52%, grade F, #18 of 447 statewide, top 4%, 2,796 students, 0% FRL) — zoned schools average 0% FRL vs 22% district-wide (22 pts lower); this property's tenant base skews higher-income than the district average.
- Market conditions: Rents rising (+2.0%/yr); 338 active listings in the ZIP; 40 comparable units currently listed for rent nearby; rentals at typical pace (median 18d on market — plan ~3-4 weeks tenant-placement turnaround); 5,365 units permitted in Oklahoma County in 2024 (569 in 5+ unit buildings).
- This rent runs 33% of the median local income ($65k/yr) — at the standard rent-burdened threshold; future hikes will face affordability resistance.
Forward outlook
- Local home prices are declining (-3.0%/yr); year-one equity from $1k of loan paydown is wiped out by about $5k of value loss. Plan a longer hold.
- Oklahoma County population projected at +41% by 2050 — long-run rental-demand tailwind backs the buy-and-hold thesis.
Negotiation context
- It's been on market 47 days — a 3% lower offer ($170k) is reasonable based on typical stale-listing flexibility.
Risks & watch-outs
- Climate carrying-cost: extreme-heat days projected 7→19/yr by 2055 (HVAC capex compounding) — expect insurance premiums to compound above CPI over the hold.
Questions for the listing agent
- What do current leases actually rent for vs. the listed asking? Can we see a recent rent roll and the last 12 months of T-12 income?
- It's been on market 47 days. Have you received any prior offers? Is the seller open to a 3% concession, seller financing, or rate buy-down credit?
- What does the HOA fee cover, when was the last increase, and are there any pending special assessments or reserve-fund shortfalls?
- Any open or pending special assessments — roof, HVAC, plumbing, elevator, façade? What's the per-unit balance and payoff schedule, and is the seller paying it off at close or rolling it to the buyer?
- Is there a deadline driving the sale (1031 exchange, divorce, estate, relocation)? That informs how much negotiation room exists.
- Schools are F-rated, which usually means shorter tenancies and higher turnover. Who's the typical renter profile here, and what's been the actual vacancy rate?
- Crime grade is F in this area — have there been break-ins, vandalism, or insurance claims at this property in the last 3 years? What carrier currently insures it and at what premium?
- The area grade is low — what's the realistic commute time and amenity access for the typical tenant pool here? Any planned neighborhood developments (good or bad) we should know about?
- What's the average days-on-market for RENTAL listings here right now (not sales)? A rising rental-DOM trend means longer vacancies and softer asking-rent achievability than the comps imply.
- What's the recent tenant-quality profile in this submarket — average credit score on applications, eviction rate, late-payment / NSF rate, and stable-employment percentage? A property-management company in the area should have these aggregated.
- How much new apartment / multifamily construction is in the pipeline within 1–3 miles? Heavy new supply (>2% of stock underway) typically softens rents 12–24 months out; light construction supports rent growth.
Investment metrics
- 1% rule
- 1.02% ✓
- Cap rate
- 6.17%
- Cash-on-cash
- -0.43%
- DSCR
- 0.98
- GRM
- 8.1
CMA / ARV
No comps found within radius.
Projected returns pro-forma
-3.0% appreciation · 2.05% rent growth · sell at horizon
- IRR
- -18.2%
- Equity multiple
- 0.37×
- Total profit
- $-30,990
- Equity at exit
- $26,078
- IRR
- -12.5%
- Equity multiple
- 0.29×
- Total profit
- $-34,581
- Equity at exit
- $15,122
Cash invested: $48,972 (down + closing). Projections, not guarantees.
Landlord ↔ Tenant lean methodology
- Overall (STATE)
- 83 Strongly Landlord-Friendly
- State Oklahoma
- 83 Strongly Landlord-Friendly · R+20
- County
- — inherits STATE
- City
- — inherits STATE
ZIP-level market 73120
- Rents YoY
- 2.0%
- Active inventory
- 338
- Price-to-rent
- 8.1×
Monthly cashflow live
- Estimated rent
- $1,790 high interval (Pro) →
- Mortgage (P&I)
- −$917
- Tax from tax record
- −$158 /mo · $1,900/yr
- Insurance
- −$73
- HOA
- −$283
- Vacancy / Maint / Mgmt
- −$376
- Net cashflow
- $-18
Break-even live
Sensitivity live
| Price | -10% $81 | -5% $32 | +0% $-18 | +5% $-67 | +10% $-117 |
|---|---|---|---|---|---|
| Rent | -10% $-159 | -5% $-88 | +0% $-18 | +5% $53 | +10% $124 |
| Rate | -1.0pp $71 | -0.5pp $27 | base $-18 | +0.5pp $-63 | +1.0pp $-109 |
UW: 25.0% down · 7.5% · 30yr · 1.5% tax · 5.0% vac · 8.0% maint · 8.0% mgmt
Financing live
Cash to close
- Down payment
- $43,725
- Closing costs
- $5,247
- Reserves months
- —
- Total cash needed
- —
Loan-product check · same deal, 3 products live
Conventional
25% down · 7.5% · 30yr
- Down + closing
- —
- Monthly P&I
- —
- Monthly cashflow
- —
- DSCR
- —
- Eligible?
- —
Personal DTI + credit; lowest rate.
DSCR
20% down · 8.5% · 30yr
- Down + closing
- —
- Monthly P&I
- —
- Monthly cashflow
- —
- DSCR
- —
- Eligible?
- —
No personal income docs; deal must DSCR.
Hard money
10% down · 12.0% · 12mo
- Down + closing
- —
- Monthly P&I
- —
- Monthly cashflow
- —
- DSCR
- —
- Eligible?
- —
Short-term bridge; refi at stabilization.
Rent comps 40 comps
| Address | Beds | Baths | Sqft | Rent | $/sqft | DOM | Units | Dist |
|---|---|---|---|---|---|---|---|---|
| 2638 Cedar Tree Rd Oklahoma City, OK | 3.0 | 2.5 | 1650 | $1,945 | $1.18 | 25d | 1 | 0.06mi |
| 2609 Featherstone Rd Oklahoma City, OK | 1.0–2.0 | 1.0–2.0 | 769 | $1,150 | $1.50 | 3d | 34 | 0.11mi |
| 2540 NW 132nd Pl Oklahoma City, OK | 3.0 | 2.5 | 1385 | $2,400 | $1.73 | 25d | 1 | 0.20mi |
| 2523 NW 132nd Pl Oklahoma City, OK | 3.0 | 2.5 | 1328 | $2,450 | $1.84 | 25d | 1 | 0.22mi |
| 2610 Crescent Ave Oklahoma City, OK | 3.0 | 2.5 | 1387 | $2,125 | $1.53 | 23d | 1 | 0.23mi |
| 2608 Crescent Ave Oklahoma City, OK | 3.0 | 2.5 | 1600 | $2,345 | $1.47 | 23d | 1 | 0.24mi |
| 2533 NW 129th St Oklahoma City, OK | 3.0 | 2.0 | 1500 | $2,200 | $1.47 | 25d | 1 | 0.26mi |
| 2533 NW 129th St Oklahoma City, OK | 3.0 | 2.5 | 1497 | $2,200 | $1.47 | 6d | 1 | 0.26mi |
| 2501 Patti Pl Oklahoma City, OK | 3.0 | 2.0 | 1377 | $1,600 | $1.16 | 45d | 1 | 0.39mi |
| 12831 Stratford Dr Oklahoma City, OK | 1.0–3.0 | 1.0–2.0 | 1122 | $3,736 | $3.33 | 3d | 22 | 0.44mi |
| 2611 Silvertree Dr Oklahoma City, OK | 3.0 | 2.0 | 1500 | $1,550 | $1.03 | 45d | 1 | 0.47mi |
| 2841 Indian Creek Blvd Oklahoma City, OK | 2.0 | 2.0 | 1129 | $1,100 | $0.97 | 18d | 1 | 0.51mi |
| 2841 Indian Creek Blvd Oklahoma City, OK | 2.0 | 2.0 | 1129 | $1,100 | $0.97 | 25d | 1 | 0.51mi |
| 12821 Stratford Dr Oklahoma City, OK | 2.0 | 2.0 | 1043 | $1,078 | $1.03 | 3d | 1 | 0.53mi |
| 2700 Indian Creek Blvd Oklahoma City, OK | 1.0–3.0 | 1.0–2.0 | 1261 | $1,549 | $1.23 | 4d | 5 | 0.59mi |
| 2401 NW 122nd St Oklahoma City, OK | 1.0–2.0 | 1.0–2.0 | 844 | $899 | $1.06 | 25d | 1 | 0.67mi |
| 12701 N Pennsylvania Ave Oklahoma City, OK | 3.0 | 1.0–2.0 | 912 | $1,595 | $1.75 | 3d | 15 | 0.68mi |
| 14200 N May Ave Oklahoma City, OK | 1.0–3.0 | 1.0–2.0 | 1031 | $1,725 | $1.67 | 3d | 17 | 0.69mi |
| 12323 Cedar Springs Ln Oklahoma City, OK | 3.0 | 2.5 | 1524 | $1,500 | $0.98 | 45d | 1 | 0.72mi |
| 12305 Cedar Springs Ln Oklahoma City, OK | 2.0 | 2.5 | 1472 | $1,250 | $0.85 | 45d | 1 | 0.77mi |
| 14300 N May Ave Oklahoma City, OK | 1.0–3.0 | 1.0–2.0 | 923 | $1,620 | $1.75 | 4d | 15 | 0.77mi |
| 2600 Watermark Blvd Oklahoma City, OK | 1.0–2.0 | 1.0–2.5 | 1066 | $1,567 | $1.47 | 3d | 10 | 0.88mi |
| 14320 Mezzaluna Ave Oklahoma City, OK | 2.0 | 2.0 | 1267 | $1,619 | $1.28 | 16d | 1 | 0.88mi |
| 2300 NW 145th St Oklahoma City, OK | 1.0–3.0 | 1.0–2.0 | 1000 | $2,225 | $2.23 | 3d | 12 | 0.89mi |
| 14327 N Pennsylvania Ave Unit 36G Oklahoma City, OK | 2.0 | 1.0 | 950 | $1,100 | $1.16 | 3d | 1 | 0.93mi |
| 2400 Watermark Blvd Oklahoma City, OK | 2.0 | 2.0 | 1267 | $1,679 | $1.33 | 23d | 1 | 0.97mi |
| 14425 N Pennsylvania Ave Unit 20B Oklahoma City, OK | 2.0 | 2.0 | 1134 | $1,299 | $1.15 | 25d | 1 | 1.00mi |
| 14712 Mezzaluna Blvd Oklahoma City, OK | 1.0–2.0 | 1.0–2.0 | 898 | $1,950 | $2.17 | 25d | 25 | 1.01mi |
| 14433 N Pennsylvania Ave Unit 27A Oklahoma City, OK | 3.0 | 2.0 | 1360 | $1,750 | $1.29 | 3d | 1 | 1.02mi |
| 2701 Watermark Blvd Oklahoma City, OK | 1.0–3.0 | 1.0–2.0 | 1047 | $1,800 | $1.72 | 3d | 19 | 1.05mi |
| 14201 N Kentucky Ave Oklahoma City, OK | 1.0–2.0 | 1.0–2.0 | 905 | $2,340 | $2.59 | 3d | 18 | 1.11mi |
| 2529 NW 116th St Oklahoma City, OK | 3.0 | 2.0 | 1625 | $1,650 | $1.02 | 45d | 1 | 1.11mi |
| 2532 NW 116th St Oklahoma City, OK | 4.0 | 2.0 | 1860 | $2,805 | $1.51 | 25d | 1 | 1.14mi |
| 1919 NW 142nd St Oklahoma City, OK | 2.0 | 2.0 | 1100 | $1,280 | $1.16 | 25d | 1 | 1.19mi |
| 2126 NW 118th St Oklahoma City, OK | 2.0 | 2.5 | 1360 | $1,445 | $1.06 | 25d | 1 | 1.22mi |
| 2221 NW 117th St Oklahoma City, OK | 3.0 | 2.5 | 1627 | $1,625 | $1.00 | 4d | 1 | 1.23mi |
| 14300 N Pennsylvania Ave Oklahoma City, OK | 1.0–2.0 | 1.0–2.0 | 844 | $1,029 | $1.22 | 3d | 1 | 1.24mi |
| 13600 N Blackwelder Ave Oklahoma City, OK | 3.0 | 1.0–2.0 | 850 | $1,995 | $2.35 | 3d | 27 | 1.25mi |
| 11417 N May Ave Unit D Oklahoma City, OK | 3.0 | 2.0 | 1275 | $1,345 | $1.05 | 4d | 1 | 1.26mi |
| 14520 N Pennsylvania Ave Oklahoma City, OK | 1.0–3.0 | 1.0–2.0 | 1024 | $1,710 | $1.67 | 3d | 12 | 1.27mi |
HOA detail condo
- Monthly dues
- $283 · $3,396/yr
- Assessments
- None detected in remarks — confirm with the listing agent.
Listing history 3 events
-
2026-05-13status Pending
-
2026-04-25price $174,900
-
2026-03-27$180,000 Active
ⓘ Source: listings_history table (triggers on properties + properties_extension) + one-shot
backfill from property_details.listing_events for pre-trigger history.
Tax reassessment forecast OK · Resets to sale price
- Current annual tax
- $1,900 · $158/mo
- Projected year-2 tax
- $1,900 · $158/mo
- Expected delta
- $0/yr ($0/mo · 0.0%)
ⓘ Screening estimate from a state-policy table — verify with the county assessor before closing.
Climate risk First Street
- Flood 1/10 Low FEMA zone X (unshaded) · 0% chance over 30 yrs
- Wildfire 1/10 Low
- Heat 6/10 Major 7 d/yr ≥107°F today · 19 d/yr by 30 yrs out
- Wind 2/10 Low 4% chance of damaging wind over 30 yrs
- Air quality 2/10 Low 1 unhealthy d/yr today · 1 by 30 yrs out
Nearby sold comps map
Loading sold comps map…
Walkable amenities ~0.75 mi
Loading nearby amenities…
Taxation est. · year 1
- Rental income
- $21,476
- − Mortgage interest
- −$9,797
- − Property taxes
- −$1,900
- − Insurance
- −$874
- − Repairs & maintenance
- −$1,718
- − Management
- −$1,718
- − HOA
- −$3,396
- − Depreciation
- −$5,088
- Taxable loss
- −$3,016
- Est. tax savings @ 24.0%
- +$724
- After-tax cash flow
- $513/yr
For passive investors: Depreciation is non-cash, so a rental often shows a tax loss while cash-flowing — sheltering income. Rental losses are passive: they offset passive income freely, and up to $25,000/yr can offset ordinary (W-2) income if you actively participate and your MAGI is under $100k (phasing out to $0 by $150k); unused losses carry forward. On sale, claimed depreciation is recaptured at up to 25%, and gains may owe capital-gains tax (a 1031 exchange can defer both). Figures are a year-1 estimate at your 24.0% rate — not tax advice; consult a CPA.
Schools (NCES district)
- District
- Edmond
- NCES district ID
- 4010590
- Math proficiency
- 38% ▼ -12.00%
- Reading proficiency
- 40% ▼ -12.00%
- Median HH income
- $73,212
- Composite
- 35.88/100
- National rank
- #4814
- State rank
- #11 of 270 in OK
Livability — Oklahoma City
- Score
- 80/100
- State rank
- #3
- US rank
- #1635
Category grades
Schools grade is shown separately in the Schools card above.
Census & demographics
- Census place
- Oklahoma City, OK
- County
- Oklahoma County · 771,644 people
- City population
- 498,656
- Metro
- Oklahoma City, OK
- Population (ZIP)
- 35,559
- Household income
- $64,745
- Rent vs Own
- Severe rent burden
- 2029.0
Population outlook (Oklahoma County) Hauer SSP2
- Today (2025)
- 911,875 people
- By 2030
- 982,413 · +7.7%
- By 2040
- 1,130,468 · +24.0%
- By 2050
- 1,288,422 · +41.3%
- By 2075
- 1,711,482 · +87.7%
- By 2100
- 2,088,448 · +129.0%
Race, ethnicity, and origin ACS 2023
- Neighborhood character
- Diverse neighborhood (Simpson 0.62)
- Race & ethnicity
- White 57% Black 21% Two or more races 11% Hispanic / Latino 7% Native American 3% Asian 2%
- Hispanic origin (detail)
- Mexican 4%
- Common ancestry
- Italian 3% Slovak 2% Lithuanian 2%
- Foreign-born
- 7% · Canada, China, Jamaica
- Languages at home
- 92% English-only · Spanish 4% French/Haitian/Cajun 1% Other Asian/Pacific 1%
Political lean MEDSL · Oklahoma
- 2024 margin
- Toss-up / Even · D 48.0% · R 49.7% · Other 2.3%
- 2008→2024 swing
- +15.1pp toward D · 2008: -16.8pp · 2024: -1.7pp
- All cycles
- 2024: R+1.7 2020: R+1.1 2016: R+10.5 2012: R+16.7 2008: R+16.8
Not yet ingested
- Civics
- —
Market trends
- HPI YoY
- ▼ -279.69%
- Current HPI
- 227.2832
- Rent YoY
- ▲ 2.05%
- Metro
- Oklahoma City, OK
- State GDP YoY
- ▲ 1.55%
- F500 in state
- 6
Industry mix (Fortune 500 HQ in OK)
| Industry | F500 HQs | Revenue |
|---|---|---|
| Energy | 3 | $48B |
|
||
Price history
-2.8% since first listed3 events — show timeline
- 2026-05-13 Pending — MLSOK
- 2026-04-25 Price Changed $174,900 MLSOK
- 2026-03-27 Listed $180,000 MLSOK
Property tax history
+4.1%/yrLatest (2025): $1,900 · +5.3% YoY. Source: county tax records.
Cash-flow waterfall
monthlySold comps — $/sqft
last 12 mo · ≤1 miLoading sold comps…