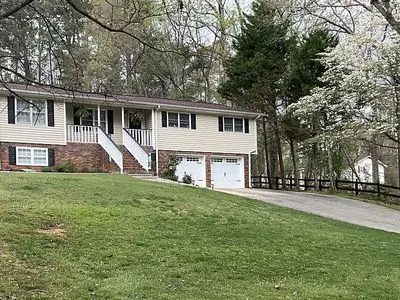
1049 Washington Ave · Woodstock, GA
Flood risk 1/10 · Minimal
- FEMA flood zone
- X (unshaded)
- Chance of flooding over 30 yrs
- 0.0%
- Est. flood insurance / yr
- $473 – $860
Fire risk 1/10 · Minimal
- Est. fire insurance / yr
- $963 – $1,789
Heat risk 5/10 · Moderate
- Hot days now (above 102°F)
- 7 days/yr
- Hot days in 30 yrs
- 17 days/yr
Wind risk 4/10 · Minor
- Chance of severe wind over 30 yrs
- 20.0%
Air-quality risk 4/10 · Minor
- Unhealthy air days now
- 5 days/yr
- Unhealthy air days in 30 yrs
- 7 days/yr
Risk factors via First Street. Map © Google.
Why this score? — see what drove the D+ grade
The composite is a weighted blend of 9 inputs, each scored 0–100. Each bar is that input's sub-score; the figure is the points it added to the 100-point composite (weight × sub-score).
- ARV discount +15.0/15.0
- Cash flow +12.9/30.0
- Schools +4.2/10.0
- DSCR +3.9/10.0
- Livability +3.7/5.0
- Rent growth +3.5/5.0
- 1% rule +3.0/10.0
- Condition / age +2.5/5.0
- Appreciation +0.0/10.0
$440,000
🖨 Deal sheet 📄 Offer letter ✓ Due diligence
Listing remarks
Welcome to this Brick Ranch Charmer with extra in-law suite on lower level! This is very well-maintained home with 3-bedrooms, 2-baths on main level plus 2 bedrooms, kitchen, bathroom and living room on lower level. Home is offering airy space filled with light, comfort of one level living, and character. House sits on large 0.89 acres lot and it is located in well-established neighborhood without HOA, just minutes (1.1miles) from downtown Woodstock. Inside, you & acirc; & euro; & trade; ll find freshly painted rooms, hardwood floors throughout the main level, good size bedrooms upstairs, and a thoughtful open layout that maximizes livability without wasted space. The kitchen fe
Key facts
- Built 1974
Neighborhood map
What this means for you Summary
Snapshot
- This is a 3-bed/2.0-bath single-family listed at $440k.
Deal economics
- At list price, monthly cash flow is $-30 ($-361/yr) — negative.
- To cash-flow at today's rent, offer at most $435k (1.2% below list).
- To meet the 1% rule (rent ≥ 1% of price), the offer needs to be $354k (19.6% below list).
- Recommended offer: $354k (19.6% below list) — sets the bar for 1% rule.
- Cap rate 6.2% vs local median 3.4% in Woodstock — top-decile yield for the area; either an underpriced asset or a hidden risk that comps aren't pricing in. Stress-test before assuming the spread holds.
Location & tenants
- Location reads 73/100 on livability (#46 in GA) — a middle-class / working-renter tenant base. Strengths: crime A+, employment A+, housing A+; Watch: amenities F, commute F, health & safety F.
- Cherokee County (suburban): math 46% / reading 48% proficiency, ranked #17 of 174 in GA (top 10%) — families likely to look elsewhere, expect single-tenant / working-renter base with shorter leases.
- Market conditions: Rents rising (+4.0%/yr); 614 active listings in the ZIP; 20 comparable units currently listed for rent nearby; rentals at typical pace (median 19d on market — plan ~3-4 weeks tenant-placement turnaround); solid renter incomes; 2,665 units permitted in Cherokee County in 2024 (852 in 5+ unit buildings).
- This rent runs 40% of the median local income ($107k/yr) — at the standard rent-burdened threshold; future hikes will face affordability resistance.
Forward outlook
- Local home prices are declining (-3.0%/yr); year-one equity from $3k of loan paydown is wiped out by about $13k of value loss. Plan a longer hold.
- Cherokee County population projected at +34% by 2050 — long-run rental-demand tailwind backs the buy-and-hold thesis.
Negotiation context
- Only 0 days on market — expect competitive offers; lowballing is unlikely to land.
- Current owner paid $175k; list at $440k implies a 151% gain — meaningful room to come down on a strong offer.
Risks & watch-outs
- Climate carrying-cost: extreme-heat days projected 7→17/yr by 2055 (HVAC capex compounding) — expect insurance premiums to compound above CPI over the hold.
Questions for the listing agent
- What do current leases actually rent for vs. the listed asking? Can we see a recent rent roll and the last 12 months of T-12 income?
- Built in 1974 — when were the roof, HVAC, electrical panel, plumbing, and water heater last replaced?
- Is there a deadline driving the sale (1031 exchange, divorce, estate, relocation)? That informs how much negotiation room exists.
- Schools are B-rated — typically a magnet for longer-tenancy family renters. What's the average tenant stay here, and is there a school-zone premium baked into asking?
- The area grade is low — what's the realistic commute time and amenity access for the typical tenant pool here? Any planned neighborhood developments (good or bad) we should know about?
- What's the average days-on-market for RENTAL listings here right now (not sales)? A rising rental-DOM trend means longer vacancies and softer asking-rent achievability than the comps imply.
- What's the recent tenant-quality profile in this submarket — average credit score on applications, eviction rate, late-payment / NSF rate, and stable-employment percentage? A property-management company in the area should have these aggregated.
- How much new for-sale + rental construction is in the pipeline within 1–3 miles? Heavy new supply typically softens prices + rents 12–24 months out; constrained supply supports both.
Investment metrics
- 1% rule
- 0.80% ✗
- Cap rate
- 6.21%
- Cash-on-cash
- -0.29%
- DSCR
- 0.99
- GRM
- 10.4
CMA / ARV
- ARV (on-the-fly)
- $576,000
- Comps found
- 12
Show comp detail 12 sales within ~0.75 mi
| Address | Dist | Beds/Ba | Sqft | Sold | Price | $/sf | Match |
|---|---|---|---|---|---|---|---|
| 415 Waverly Pl | 0.41mi | 3/2.5 | 2,315 (-4%) | 9mo | $530,000 | $229 | 66 |
| 1834 Grand Oaks Ln | 0.42mi | 3/2.5 | 2,440 (+2%) | 15mo | $610,000 | $250 | 63 |
| 1798 Grand Oaks Dr | 0.31mi | 3/3.5 | 2,685 (+12%) | 4mo | $650,000 | $242 | 56 |
| 406 Park Ter | 0.65mi | 3/3.0 | 2,256 (-6%) | 1mo | $425,000 | $188 | 54 |
| 2800 Stonecrest Aly | 0.31mi | 3/3.0 | 2,162 (-10%) | 14mo | $549,000 | $254 | 53 |
| 2004 Haley Walk | 0.40mi | 3/3.5 | 2,602 (+8%) | 13mo | $639,000 | $246 | 50 |
| 167 Neese Farm Dr | 0.72mi | 3/2.5 | 2,511 (+5%) | 10mo | $569,000 | $227 | 48 |
| 2005 Haley Walk | 0.41mi | 4/3.0 (+1) | 2,649 (+10%) | 11mo | $635,000 | $240 | 45 |
| 330 Davis Ln | 0.70mi | 4/3.0 (+1) | 2,535 (+6%) | 5mo | $524,000 | $207 | 45 |
| 117 Neese Farm Dr | 0.56mi | 4/2.5 (+1) | 2,601 (+8%) | 15mo | $575,000 | $221 | 41 |
| 163 Neese Farm Dr | 0.70mi | 3/2.5 | 2,082 (-13%) | 13mo | $545,000 | $262 | 33 |
| 613 Ann Ct | 0.75mi | 4/3.5 (+1) | 2,760 (+15%) | 5mo | $645,000 | $234 | 25 |
Match score weights: distance 35% · size 25% · config 20% · recency 20%. Top-matched comps best support the ARV.
Projected returns pro-forma
-3.0% appreciation · 3.96% rent growth · sell at horizon
- IRR
- -15.8%
- Equity multiple
- 0.43×
- Total profit
- $-69,846
- Equity at exit
- $65,605
- IRR
- -6.0%
- Equity multiple
- 0.60×
- Total profit
- $-49,180
- Equity at exit
- $38,043
Cash invested: $123,200 (down + closing). Projections, not guarantees.
Landlord ↔ Tenant lean methodology
- Overall (STATE)
- 90 Strongly Landlord-Friendly
- State Georgia
- 90 Strongly Landlord-Friendly · R+3
- County
- — inherits STATE
- City
- — inherits STATE
ZIP-level market 30188
- Rents YoY
- 4.0%
- Active inventory
- 614
- Price-to-rent
- 10.4×
Monthly cashflow live
- Estimated rent
- $3,537 high interval (Pro) →
- Mortgage (P&I)
- −$2,307
- Tax from tax record
- −$333 /mo · $4,000/yr
- Insurance
- −$183
- HOA
- −$0
- Vacancy / Maint / Mgmt
- −$743
- Net cashflow
- $-30
Break-even live
UW: 25.0% down · 7.5% · 30yr · 1.5% tax · 5.0% vac · 8.0% maint · 8.0% mgmt
Financing live
Cash to close
- Down payment
- $110,000
- Closing costs
- $13,200
- Reserves months
- —
- Total cash needed
- —
Loan-product check · same deal, 3 products live
Conventional
25% down · 7.5% · 30yr
- Down + closing
- —
- Monthly P&I
- —
- Monthly cashflow
- —
- DSCR
- —
- Eligible?
- —
Personal DTI + credit; lowest rate.
DSCR
20% down · 8.5% · 30yr
- Down + closing
- —
- Monthly P&I
- —
- Monthly cashflow
- —
- DSCR
- —
- Eligible?
- —
No personal income docs; deal must DSCR.
Hard money
10% down · 12.0% · 12mo
- Down + closing
- —
- Monthly P&I
- —
- Monthly cashflow
- —
- DSCR
- —
- Eligible?
- —
Short-term bridge; refi at stabilization.
Rent comps 20 comps
| Address | Beds | Baths | Sqft | Rent | $/sqft | DOM | Units | Dist |
|---|---|---|---|---|---|---|---|---|
| 302 Independence Way Woodstock, GA | 3.0 | 2.5 | 1664 | $4,650 | $2.79 | 5d | 1 | 0.10mi |
| 158 Kingwood Dr Woodstock, GA | 4.0 | 3.5 | 2754 | $4,800 | $1.74 | 43d | 1 | 0.50mi |
| 121 Via Roma Woodstock, GA | 3.0 | 2.5 | 2416 | $3,600 | $1.49 | 43d | 1 | 0.71mi |
| 465 Dobbs Rd Unit B Woodstock, GA | 2.0 | 2.0 | 1680 | $2,450 | $1.46 | 18d | 1 | 0.80mi |
| 303 Winchester Way Woodstock, GA | 3.0 | 2.5 | 1750 | $2,350 | $1.34 | 3d | 1 | 0.83mi |
| 813 Upper Dove Ct Woodstock, GA | 4.0 | 2.5 | 1928 | $2,395 | $1.24 | 17d | 1 | 0.91mi |
| 122 Bentley Pkwy Woodstock, GA | 3.0 | 2.5 | 1800 | $4,650 | $2.58 | 43d | 1 | 0.97mi |
| 1506 Korona Ct Woodstock, GA | 3.0 | 2.5 | 1619 | $2,390 | $1.48 | 17d | 1 | 0.99mi |
| 165 Bentley Pkwy Woodstock, GA | 4.0 | 2.0 | 2000 | $5,995 | $3.00 | 43d | 1 | 1.04mi |
| 809 Cataya Cv Woodstock, GA | 3.0 | 2.5 | 1974 | $2,765 | $1.40 | 12d | 1 | 1.05mi |
| 508 Melody Pl Woodstock, GA | 4.0 | 2.5 | 2624 | $3,400 | $1.30 | 43d | 1 | 1.06mi |
| 1056 Dunedin Trl Unit 1 Woodstock, GA | 3.0 | 3.0 | 2000 | $3,200 | $1.60 | 43d | 1 | 1.17mi |
| 111 Pearl St Woodstock, GA | 3.0 | 2.5 | 2944 | $3,450 | $1.17 | 11d | 1 | 1.32mi |
| 137 Pearl St Woodstock, GA | 3.0 | 2.5 | 2100 | $2,995 | $1.43 | 24d | 1 | 1.37mi |
| 735 Market St Woodstock, GA | 1.0–3.0 | 1.0–2.0 | 1484 | $3,997 | $2.69 | 2d | 16 | 1.39mi |
| 431 Lincoln St Woodstock, GA | 4.0 | 3.5 | 2535 | $2,970 | $1.17 | 10d | 1 | 1.43mi |
| 1054 Knoxboro Ln Woodstock, GA | 4.0 | 3.5 | 2386 | $3,000 | $1.26 | 2d | 1 | 1.43mi |
| 407 Lincoln St Woodstock, GA | 4.0 | 3.5 | 2175 | $2,750 | $1.26 | 24d | 1 | 1.46mi |
| 1095 Knoxboro Ln Woodstock, GA | 4.0 | 3.5 | 2376 | $2,999 | $1.26 | 4d | 1 | 1.46mi |
| 1104 Thomas St Woodstock, GA | 3.0 | 3.5 | 2264 | $3,650 | $1.61 | 44d | 1 | 1.48mi |
Listing history 4 events
-
2026-05-26$440,000
-
2003-10-20soldstatus $175,000
-
1999-12-31soldstatus $118,500
-
1994-03-03soldstatus $72,500
ⓘ Source: listings_history table (triggers on properties + properties_extension) + one-shot
backfill from property_details.listing_events for pre-trigger history.
Tax reassessment forecast GA · Resets to sale price
- Current annual tax
- $4,000 · $333/mo
- Projected year-2 tax
- $4,048 · $337/mo
- Expected delta
- +$48/yr (+$4/mo · 1.2%)
ⓘ Screening estimate from a state-policy table — verify with the county assessor before closing.
Climate risk First Street
- Flood 1/10 Low FEMA zone X (unshaded) · 0% chance over 30 yrs
- Wildfire 1/10 Low
- Heat 5/10 Major 7 d/yr ≥102°F today · 17 d/yr by 30 yrs out
- Wind 4/10 Moderate 20% chance of damaging wind over 30 yrs
- Air quality 4/10 Moderate 5 unhealthy d/yr today · 7 by 30 yrs out
Nearby sold comps map
Loading sold comps map…
Walkable amenities ~0.75 mi
Loading nearby amenities…
Taxation est. · year 1
- Rental income
- $42,441
- − Mortgage interest
- −$24,647
- − Property taxes
- −$4,000
- − Insurance
- −$2,200
- − Repairs & maintenance
- −$3,395
- − Management
- −$3,395
- − Depreciation
- −$12,800
- Taxable loss
- −$7,997
- Est. tax savings @ 24.0%
- +$1,919
- After-tax cash flow
- $1,558/yr
For passive investors: Depreciation is non-cash, so a rental often shows a tax loss while cash-flowing — sheltering income. Rental losses are passive: they offset passive income freely, and up to $25,000/yr can offset ordinary (W-2) income if you actively participate and your MAGI is under $100k (phasing out to $0 by $150k); unused losses carry forward. On sale, claimed depreciation is recaptured at up to 25%, and gains may owe capital-gains tax (a 1031 exchange can defer both). Figures are a year-1 estimate at your 24.0% rate — not tax advice; consult a CPA.
Schools (NCES district)
- District
- Cherokee County
- NCES district ID
- 1301110
- Math proficiency
- 46% ▼ -11.00%
- Reading proficiency
- 48% ▼ -8.00%
- Median HH income
- $69,295
- Composite
- 42.14/100
- National rank
- #3304
- State rank
- #17 of 174 in GA
Livability — Woodstock
- Score
- 73/100
- State rank
- #46
- US rank
- #5116
Category grades
Schools grade is shown separately in the Schools card above.
Census & demographics
- Census place
- Woodstock, GA
- County
- Cherokee County · 289,977 people
- City population
- 109,446
- Metro
- Atlanta-Sandy Springs-Alpharetta, GA
- Population (ZIP)
- 69,518
- Household income
- $106,844
- Rent vs Own
- Severe rent burden
- 1591.0
Population outlook (Cherokee County) Hauer SSP2
- Today (2025)
- 281,923 people
- By 2030
- 303,845 · +7.8%
- By 2040
- 344,738 · +22.3%
- By 2050
- 379,010 · +34.4%
- By 2075
- 449,617 · +59.5%
- By 2100
- 484,103 · +71.7%
Race, ethnicity, and origin ACS 2023
- Neighborhood character
- Predominantly White (74%)
- Race & ethnicity
- White 74% Hispanic / Latino 9% Two or more races 8% Black 7% Asian 4%
- Hispanic origin (detail)
- Mexican 4% Puerto Rican 1%
- Common ancestry
- Slovak 3% Italian 3% Lithuanian 3%
- Foreign-born
- 11% · Canada, Vietnam, South Korea
- Languages at home
- 87% English-only · Spanish 7% Other Indo-European 3% Other Asian/Pacific 1%
Political lean MEDSL · Cherokee
- 2024 margin
- Solid R (+39.0) · D 30.1% · R 69.1%
- 2008→2024 swing
- +12.1pp toward D · 2008: -51.1pp · 2024: -39.0pp
- All cycles
- 2024: R+39.0 2020: R+39.2 2016: R+50.0 2012: R+57.8 2008: R+51.1
Not yet ingested
- Civics
- —
Market trends
- HPI YoY
- ▼ -291.54%
- Current HPI
- 260.554
- Rent YoY
- ▲ 3.96%
- Metro
- Atlanta-Sandy Springs-Alpharetta, GA
- State GDP YoY
- ▲ 2.66%
- F500 in state
- 28
Industry mix (Fortune 500 HQ in GA)
| Industry | F500 HQs | Revenue |
|---|---|---|
| Paper / Packaging | 2 | $29B |
|
||
| Retail | 1 | $160B |
|
||
| Transportation / Logistics | 1 | $91B |
|
||
| Airlines | 1 | $62B |
|
||
| Consumer Goods | 1 | $47B |
|
||
| Utilities | 1 | $25B |
|
||
Price history
+506.9% since first listed4 events — show timeline
- 2026-05-26 Listed $440,000 FSBO.com
- 2003-10-20 Sold (Public Records) $175,000 Public Records
- 1999-12-31 Sold (Public Records) $118,500 Public Records
- 1994-03-03 Sold (Public Records) $72,500 Public Records
Property tax history
+6.8%/yrLatest (2025): $4,000 · -0.3% YoY. Source: county tax records.
Cash-flow waterfall
monthlySold comps — $/sqft
last 12 mo · ≤1 miLoading sold comps…