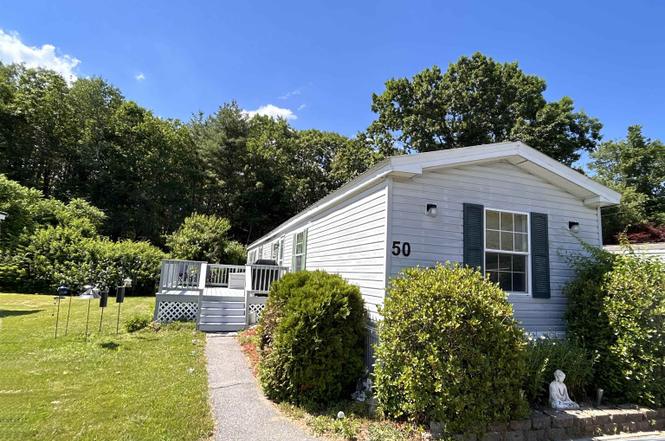
50 Hilton Ave · Exeter, NH
Flood risk No data
- FEMA flood zone
- —
- Chance of flooding over 30 yrs
- —
- Est. flood insurance / yr
- —
Fire risk No data
- Est. fire insurance / yr
- —
Heat risk No data
- Hot days now (above threshold)
- —
- Hot days in 30 yrs
- —
Wind risk No data
- Chance of severe wind over 30 yrs
- —
Air-quality risk No data
- Unhealthy air days now
- —
- Unhealthy air days in 30 yrs
- —
Risk factors via First Street. Map © Google.
Why this score? — see what drove the C- grade
The composite is a weighted blend of 9 inputs, each scored 0–100. Each bar is that input's sub-score; the figure is the points it added to the 100-point composite (weight × sub-score).
- Cash flow +18.2/30.0
- 1% rule +7.6/10.0
- ARV discount +7.5/15.0
- DSCR +5.7/10.0
- Schools +4.6/10.0
- Livability +4.5/5.0
- Rent growth +2.5/5.0
- Condition / age +2.5/5.0
- Appreciation +0.0/10.0
$235,900
🖨 Deal sheet 📄 Offer letter ✓ Due diligence
Listing remarks MLS
What more could you need?! This beautifully styled manufactured home boasts an open concept kitchen/dining area with stainless steel appliances and a cozy living room with feature wall and pellet stove, light and bright master br with ensuite bath, 2 additional bedrooms (one being used as an office) and a 2nd bathroom. Durable laminate floors that resemble hardwood running through most of the home, an abundance of closets with new doors and separate laundry room with full sized washer and dryer and sweet attention to detail everywhere you look! In the nicer weather, enjoy one of two decks and well manicured lot with feature plantings to relax at home, head down to the community's pool and playground, or take a short walk to the YMCA or downtown to enjoy a bit of shopping and socializing. Located right in the coveted Exeter school district and close enough to hop on the Downeaster Amtrak train to Boston, or the beautiful beaches of Maine. Come see it today and make this YOUR home! UPDATE: we will be reviewing offers at 7pm 12/8
Key facts
- Private bath
- Newer appliances
- Pellet stove
Tags
Property features AI
Finance
- Other: Road frontage is association-maintained and paved
- HOA & community: Monthly park/association fee of $555 (includes water, sewer, trash, park rent); One-time mobile home transfer fee of $400; Community amenities include a playground and in-ground pool; Located in Exeter River Coop (mobile park co-op)
Exterior
- Parking: Paved driveway
- Utilities: Community/public water; Community sewer; 100 amp electric service; Unitil electric provider; Eastern Propane fuel; Cable available; DSL available and fiber optic internet available
- Home design: Manufactured/mobile home; White exterior; Metal roof; Built in 1994; Located in a mobile home co-op with park approval
- Construction: Vinyl siding; Metal roof
- Exterior features: Level lot; Paved driveway
Interior
- Kitchen: Dishwasher; Microwave; Gas range; Refrigerator; Kitchen and dining combined (main level)
- Bedrooms: Three bedrooms, all on the main level; One bedroom includes a private bath
- Flooring: Carpet; Vinyl plank
- Bathrooms: One full bathroom on the main level; One three-quarter bathroom on the main level
- Heating & cooling: Forced air heat; Central air conditioning
- Interior features: Five total rooms
Neighborhood map
What this means for you Summary
Snapshot
- This is a 3-bed/2.0-bath manufactured listed at $236k.
Deal economics
- At list price, monthly cash flow is $213 ($3k/yr) — positive.
- The deal already cash-flows at list — no discount required.
- Meets the 1% rule at list price ($3k rent vs $236k).
- Cap rate 7.4% vs local median 2.8% in Exeter — top-decile yield for the area; either an underpriced asset or a hidden risk that comps aren't pricing in. Stress-test before assuming the spread holds.
Location & tenants
- Location reads 91/100 on livability (#1 in NH, #59 nationally) — a professional / high-income tenant draw. Strengths: crime A+, amenities A+, commute A+.
- Exeter School District (suburban): math 46% / reading 57% proficiency, ranked #32 of 98 in NH (top 33%) — acceptable for families but not a draw, mixed tenant base, ~2y average lease; only 13% free/reduced lunch — higher-income household profile.
- Zoned schools: Main Street School (408 students, 14% FRL) — zoned schools at 14% FRL track the district average.
- Market conditions: 142 active listings in the ZIP; 1 comparable units currently listed for rent nearby; high-income renter base; 1,276 units permitted in Rockingham County in 2024 (593 in 5+ unit buildings).
Forward outlook
- Local home prices are declining (-3.0%/yr); year-one equity from $2k of loan paydown is wiped out by about $7k of value loss. Plan a longer hold.
Negotiation context
- Only 1 days on market — expect competitive offers; lowballing is unlikely to land.
- 2 sale attempts since 6y ago with the ask held roughly flat each time — persistent listings suggest the price (not the market) is what's stuck; bring a comps-based counter.
- Current owner paid $96k; list at $236k implies a 146% gain — meaningful room to come down on a strong offer.
Questions for the listing agent
- What does the HOA fee cover, when was the last increase, and are there any pending special assessments or reserve-fund shortfalls?
- Is there a deadline driving the sale (1031 exchange, divorce, estate, relocation)? That informs how much negotiation room exists.
- Schools are A-rated — typically a magnet for longer-tenancy family renters. What's the average tenant stay here, and is there a school-zone premium baked into asking?
- What's the average days-on-market for RENTAL listings here right now (not sales)? A rising rental-DOM trend means longer vacancies and softer asking-rent achievability than the comps imply.
- What's the recent tenant-quality profile in this submarket — average credit score on applications, eviction rate, late-payment / NSF rate, and stable-employment percentage? A property-management company in the area should have these aggregated.
- How much new for-sale + rental construction is in the pipeline within 1–3 miles? Heavy new supply typically softens prices + rents 12–24 months out; constrained supply supports both.
Investment metrics
- 1% rule
- 1.26% ✓
- Cap rate
- 7.38%
- Cash-on-cash
- 3.87%
- DSCR
- 1.17
- GRM
- 6.6
CMA / ARV
- ARV (on-the-fly)
- $121,968
- Comps found
- 12
Show comp detail 12 sales within ~0.75 mi
| Address | Dist | Beds/Ba | Sqft | Sold | Price | $/sf | Match |
|---|---|---|---|---|---|---|---|
| 12 Cornwall Ave | 0.18mi | 2/1.0 (-1) | 988 (-2%) | 2mo | $120,000 | $121 | 78 |
| 51 Alder St | 0.20mi | 2/2.0 (-1) | 1,064 (+6%) | 3mo | $180,000 | $169 | 74 |
| 512 Canterbury Dr | 0.39mi | 2/1.0 (-1) | 984 (-2%) | 3mo | $72,900 | $74 | 66 |
| 10 Alder St | 0.17mi | 2/1.0 (-1) | 924 (-8%) | 6mo | $150,000 | $162 | 64 |
| 311 Friar Tuck Dr | 0.37mi | 2/2.0 (-1) | 1,088 (+8%) | 2mo | $78,000 | $72 | 63 |
| 23 Sumac St | 0.27mi | 2/2.0 (-1) | 880 (-13%) | 2mo | $195,000 | $222 | 60 |
| 709 Nottingham Dr #709 | 0.44mi | 2/1.5 (-1) | 952 (-6%) | 4mo | $99,000 | $104 | 60 |
| 208 Robin Hood Dr | 0.40mi | 2/1.0 (-1) | 944 (-6%) | 5mo | $55,000 | $58 | 58 |
| 911 Camelot Dr | 0.44mi | 2/1.5 (-1) | 1,092 (+8%) | 1mo | $117,500 | $108 | 58 |
| 32 Lindenshire Ave | 0.23mi | 2/2.0 (-1) | 1,152 (+14%) | 7mo | $200,000 | $174 | 55 |
| 97 Linden St #4 | 0.40mi | 3/2.0 | 1,152 (+14%) | 4mo | $185,500 | $161 | 54 |
| 802 Nottingham Dr Unit 79-802 | 0.46mi | 2/1.0 (-1) | 1,100 (+9%) | 2mo | $95,000 | $86 | 53 |
Match score weights: distance 35% · size 25% · config 20% · recency 20%. Top-matched comps best support the ARV.
Projected returns pro-forma
-3.0% appreciation · 3.0% rent growth · sell at horizon
- IRR
- -10.1%
- Equity multiple
- 0.63×
- Total profit
- $-24,320
- Equity at exit
- $35,173
- IRR
- -0.5%
- Equity multiple
- 0.97×
- Total profit
- $-2,297
- Equity at exit
- $20,396
Cash invested: $66,052 (down + closing). Projections, not guarantees.
Landlord ↔ Tenant lean methodology
- Overall (STATE)
- 56 Moderately Landlord-Leaning
- State New Hampshire
- 56 Moderately Landlord-Leaning · D+1
- County
- — inherits STATE
- City
- — inherits STATE
ZIP-level market 03833
- Active inventory
- 142
- Price-to-rent
- 6.6×
Monthly cashflow live
- Estimated rent
- $2,964 medium interval (Pro) →
- Mortgage (P&I)
- −$1,237
- Tax from tax record
- −$239 /mo · $2,863/yr
- Insurance
- −$98
- HOA
- −$555
- Vacancy / Maint / Mgmt
- −$622
- Net cashflow
- $213
Break-even live
UW: 25.0% down · 7.5% · 30yr · 1.5% tax · 5.0% vac · 8.0% maint · 8.0% mgmt
Financing live
Cash to close
- Down payment
- $58,975
- Closing costs
- $7,077
- Reserves months
- —
- Total cash needed
- —
Loan-product check · same deal, 3 products live
Conventional
25% down · 7.5% · 30yr
- Down + closing
- —
- Monthly P&I
- —
- Monthly cashflow
- —
- DSCR
- —
- Eligible?
- —
Personal DTI + credit; lowest rate.
DSCR
20% down · 8.5% · 30yr
- Down + closing
- —
- Monthly P&I
- —
- Monthly cashflow
- —
- DSCR
- —
- Eligible?
- —
No personal income docs; deal must DSCR.
Hard money
10% down · 12.0% · 12mo
- Down + closing
- —
- Monthly P&I
- —
- Monthly cashflow
- —
- DSCR
- —
- Eligible?
- —
Short-term bridge; refi at stabilization.
Rent comps 1 comps
| Address | Beds | Baths | Sqft | Rent | $/sqft | DOM | Units | Dist |
|---|---|---|---|---|---|---|---|---|
| 162 Front St Exeter, NH | 2.0 | 1.0 | 720 | $2,600 | $3.61 | 16d | 1 | 0.79mi |
HOA detail
- Monthly dues
- $555 · $6,660/yr
- Likely covers
- pool
Listing history 2 events
-
2026-06-18remarks 687-char remark
-
2026-06-18$235,900 Active 1 DOM
ⓘ Source: listings_history table (triggers on properties + properties_extension) + one-shot
backfill from property_details.listing_events for pre-trigger history.
Tax reassessment forecast NH · Partial reset (capped growth)
- Current annual tax
- $2,863 · $239/mo
- Projected year-2 tax
- $4,003 · $334/mo
- Expected delta
- +$1,140/yr (+$95/mo · 39.8%)
ⓘ Screening estimate from a state-policy table — verify with the county assessor before closing.
Nearby sold comps map
Loading sold comps map…
Walkable amenities ~0.75 mi
Loading nearby amenities…
Taxation est. · year 1
- Rental income
- $35,571
- − Mortgage interest
- −$13,214
- − Property taxes
- −$2,863
- − Insurance
- −$1,180
- − Repairs & maintenance
- −$2,846
- − Management
- −$2,846
- − HOA
- −$6,660
- − Depreciation
- −$6,863
- Taxable loss
- −$899
- Est. tax savings @ 24.0%
- +$216
- After-tax cash flow
- $2,770/yr
For passive investors: Depreciation is non-cash, so a rental often shows a tax loss while cash-flowing — sheltering income. Rental losses are passive: they offset passive income freely, and up to $25,000/yr can offset ordinary (W-2) income if you actively participate and your MAGI is under $100k (phasing out to $0 by $150k); unused losses carry forward. On sale, claimed depreciation is recaptured at up to 25%, and gains may owe capital-gains tax (a 1031 exchange can defer both). Figures are a year-1 estimate at your 24.0% rate — not tax advice; consult a CPA.
Schools (NCES district)
- District
- Exeter School District
- NCES district ID
- 3302970
- Math proficiency
- 46% ▼ -21.00%
- Reading proficiency
- 57% ▼ -14.00%
- Median HH income
- $69,970
- Composite
- 45.9/100
- National rank
- #2549
- State rank
- #32 of 98 in NH
Livability — Exeter
- Score
- 91/100
- State rank
- #1
- US rank
- #59
Category grades
Schools grade is shown separately in the Schools card above.
Census & demographics
- Census place
- Exeter, NH
- County
- Rockingham County · 137,526 people
- City population
- 22,817
- Metro
- Boston-Cambridge-Newton, MA-NH
- Population (ZIP)
- 22,817
- Household income
- $119,393
- Rent vs Own
- Severe rent burden
- 485.0
Population outlook (Rockingham County) Hauer SSP2
- Today (2025)
- 316,118 people
- By 2030
- 320,929 · +1.5%
- By 2040
- 323,358 · +2.3%
- By 2050
- 314,977 · -0.4%
- By 2075
- 297,686 · -5.8%
- By 2100
- 256,363 · -18.9%
Race, ethnicity, and origin ACS 2023
- Neighborhood character
- Predominantly White (91%)
- Race & ethnicity
- White 91% Two or more races 4% Asian 3% Hispanic / Latino 2%
- Common ancestry
- Lithuanian 8% Slovak 5% Romanian 5%
- Foreign-born
- 6% · Canada, China, South Korea
- Languages at home
- 93% English-only · Spanish 2% Other Indo-European 1% German/W. Germanic 1%
Political lean MEDSL · Rockingham
- 2024 margin
- Toss-up / Even · D 48.3% · R 50.8%
- 2008→2024 swing
- -3.5pp toward R · 2008: 1.1pp · 2024: -2.4pp
- All cycles
- 2024: R+2.4 2020: D+2.1 2016: R+5.8 2012: R+4.5 2008: D+1.1
Not yet ingested
- Civics
- —
Market trends
- HPI YoY
- ▼ -202.07%
- Current HPI
- 288.0139
- Rent YoY
- —
- Metro
- Boston-Cambridge-Newton, MA-NH
- State GDP YoY
- —
- F500 in state
- 0
Price history
+537.6% since first listed5 events — show timeline
- 2026-06-17 Listed $235,900 PrimeMLS
- 2021-01-14 Sold (MLS) $96,000 PrimeMLS
- 2020-12-11 Pending — PrimeMLS
- 2020-12-04 Listed $93,500 PrimeMLS
- 1997-02-21 Sold (Public Records) $37,000 Public Records
Property tax history
+11.6%/yrLatest (2025): $2,863 · +5.5% YoY. Source: county tax records.
Cash-flow waterfall
monthlySold comps — $/sqft
last 12 mo · ≤1 miLoading sold comps…