 Multi-family
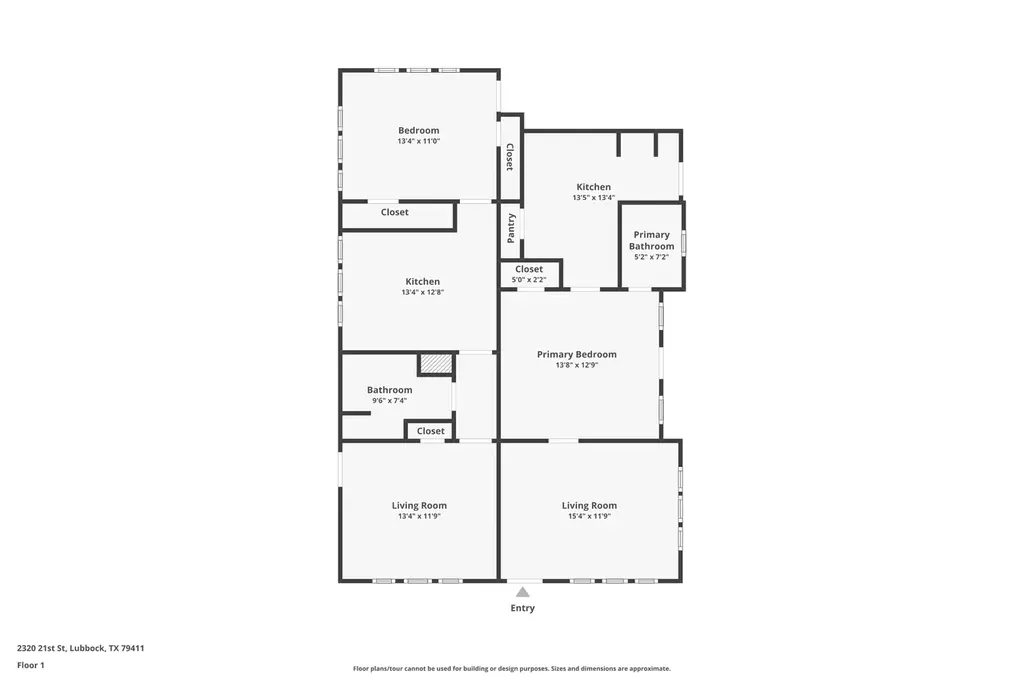
2320 21st St · Lubbock, TX
Flood risk 1/10 · Minimal
- FEMA flood zone
- X (unshaded)
- Chance of flooding over 30 yrs
- 0.0%
- Est. flood insurance / yr
- $507 – $1,088
Fire risk 1/10 · Minimal
- Est. fire insurance / yr
- $1,222 – $2,270
Heat risk 5/10 · Moderate
- Hot days now (above 100°F)
- 7 days/yr
- Hot days in 30 yrs
- 21 days/yr
Wind risk 2/10 · Minimal
- Chance of severe wind over 30 yrs
- —
Air-quality risk 2/10 · Minimal
- Unhealthy air days now
- 1 days/yr
- Unhealthy air days in 30 yrs
- 1 days/yr
Risk factors via First Street. Map © Google.
Why this score? — see what drove the B- grade
The composite is a weighted blend of 9 inputs, each scored 0–100. Each bar is that input's sub-score; the figure is the points it added to the 100-point composite (weight × sub-score).
- Cash flow +30.0/30.0
- DSCR +10.0/10.0
- 1% rule +8.8/10.0
- ARV discount +7.5/15.0
- Livability +4.0/5.0
- Schools +3.1/10.0
- Rent growth +3.0/5.0
- Condition / age +2.5/5.0
- Appreciation +0.0/10.0
$159,000
🖨 Deal sheet 📄 Offer letter ✓ Due diligence
Multi-family units
County records classify this as Multi-Family (2-4 Unit). Listing-text estimate: 1 unit. estimate disagrees with records
Listing remarks MLS
This property offers three distinct units, providing a total of 4 bedrooms and 3 bathrooms. Ideal for investment or multi-generational living, the layout includes a mix of private and shared spaces. Each unit offers comfortable living arrangements, with dedicated kitchens and functional layouts. Whether you're seeking rental income or flexible housing options, this property delivers versatility and potential. Don't miss this opportunity to own a multi-unit property with diverse living arrangements.
Key facts
- Dedicated kitchens
- Multi-unit property
- Three distinct units
Tags
Neighborhood map
What this means for you Summary
Snapshot
- This is a 4-bed/2.0-bath multifamily listed at $159k.
Deal economics
- At list price, monthly cash flow is $624 ($7k/yr) — positive.
- The deal already cash-flows at list — no discount required.
- Meets the 1% rule at list price ($2k rent vs $159k).
- Recommended offer: $140k (12.0% below list) — sets the bar for market timing.
Location & tenants
- Location reads 80/100 on livability (#37 in TX, #1,749 nationally) — a professional / high-income tenant draw. Strengths: commute A+, cost of living A+, housing A+; Watch: employment C-, schools D+, crime F.
- Lubbock ISD (urban): math 36% / reading 39% proficiency, ranked #481 of 826 in TX (top 58%) — families likely to look elsewhere, expect single-tenant / working-renter base with shorter leases; 60% free/reduced lunch — lower-income household profile, screen leases tightly.
- Market conditions: Rents rising (+1.9%/yr); 96 active listings in the ZIP; 40 comparable units currently listed for rent nearby; rentals lingering (median 44d on market — plan ~5-8 weeks vacancy on turnover, expect pricing pressure); 50% of comp listings sitting > 30 days — soft ceiling on asking rent; 2,219 units permitted in Lubbock County in 2024 (252 in 5+ unit buildings).
- At $2,191/mo this rent would consume 55% of the median local household income ($48k/yr) (locally 777% of renters already pay >50% of income on rent) — very limited rent-growth headroom before tenants either downsize or default.
Forward outlook
- Local home prices are declining (-3.0%/yr); year-one equity from $1k of loan paydown is wiped out by about $5k of value loss. Plan a longer hold.
- Lubbock County population projected at +39% by 2050 — long-run rental-demand tailwind backs the buy-and-hold thesis.
- At projected returns (-3.0% appreciation + 1.9% rent growth), your $45k cash investment doubles in ~8 years — after that, you're playing with house money.
Negotiation context
- It's been on market 457 days — a 12% lower offer ($140k) is reasonable based on typical stale-listing flexibility.
- 2 sale attempts with the ask held roughly flat each time — persistent listings suggest the price (not the market) is what's stuck; bring a comps-based counter.
Risks & watch-outs
- Watch-outs: built in 1926 — expect roof / HVAC / electrical / plumbing capex.
- Climate carrying-cost: extreme-heat days projected 7→21/yr by 2055 (HVAC capex compounding) — expect insurance premiums to compound above CPI over the hold.
Questions for the listing agent
- It's been on market 457 days. Have you received any prior offers? Is the seller open to a 12% concession, seller financing, or rate buy-down credit?
- Built in 1926 — when were the roof, HVAC, electrical panel, plumbing, and water heater last replaced?
- Why hasn't it sold? Are there any deal-killer items the seller is aware of (foundation, flood, title, zoning, code violations)?
- Is there a deadline driving the sale (1031 exchange, divorce, estate, relocation)? That informs how much negotiation room exists.
- Schools are D-rated, which usually means shorter tenancies and higher turnover. Who's the typical renter profile here, and what's been the actual vacancy rate?
- Crime grade is F in this area — have there been break-ins, vandalism, or insurance claims at this property in the last 3 years? What carrier currently insures it and at what premium?
- What's the average days-on-market for RENTAL listings here right now (not sales)? A rising rental-DOM trend means longer vacancies and softer asking-rent achievability than the comps imply.
- What's the recent tenant-quality profile in this submarket — average credit score on applications, eviction rate, late-payment / NSF rate, and stable-employment percentage? A property-management company in the area should have these aggregated.
- How much new apartment / multifamily construction is in the pipeline within 1–3 miles? Heavy new supply (>2% of stock underway) typically softens rents 12–24 months out; light construction supports rent growth.
Investment metrics
- 1% rule
- 1.38% ✓
- Cap rate
- 11.00%
- Cash-on-cash
- 16.82%
- DSCR
- 1.75
- GRM
- 6.0
CMA / ARV
- ARV (median comp)
- $76,202
- List price
- $159,000
- Delta
- 108.66%
- Verdict
- OVERPRICED
- Comps
- 1 within 2.0 mi
Projected returns pro-forma
-3.0% appreciation · 1.87% rent growth · sell at horizon
- IRR
- 6.7%
- Equity multiple
- 1.26×
- Total profit
- $11,551
- Equity at exit
- $23,707
- IRR
- 15.1%
- Equity multiple
- 2.16×
- Total profit
- $51,504
- Equity at exit
- $13,747
Cash invested: $44,520 (down + closing). Projections, not guarantees.
Landlord ↔ Tenant lean methodology
- Overall (STATE)
- 87 Strongly Landlord-Friendly
- State Texas
- 87 Strongly Landlord-Friendly · R+5
- County
- — inherits STATE
- City
- — inherits STATE
ZIP-level market 79411
- Home prices YoY
- -10.5%
- Rents YoY
- 1.9%
- Active inventory
- 96
- Price-to-rent
- 18.1×
Monthly cashflow live
- Estimated rent
- $2,191 medium interval (Pro) →
- Mortgage (P&I)
- −$834
- Tax from tax record
- −$207 /mo · $2,482/yr
- Insurance
- −$66
- HOA
- −$0
- Vacancy / Maint / Mgmt
- −$460
- Net cashflow
- $624
Break-even live
3-unit breakdown (identical units grouped — click to expand)
| Units | Beds | Baths | Est. rent |
|---|---|---|---|
| 3× units | 1 | 1 | $2,190 |
| #1 | 1 | 1 | $730 |
| #2 | 1 | 1 | $730 |
| #3 | 1 | 1 | $730 |
| Total (3 units) | $2,191 | ||
UW: 25.0% down · 7.5% · 30yr · 1.5% tax · 5.0% vac · 8.0% maint · 8.0% mgmt
Financing live
Cash to close
- Down payment
- $39,750
- Closing costs
- $4,770
- Reserves months
- —
- Total cash needed
- —
Loan-product check · same deal, 3 products live
Conventional
25% down · 7.5% · 30yr
- Down + closing
- —
- Monthly P&I
- —
- Monthly cashflow
- —
- DSCR
- —
- Eligible?
- —
Personal DTI + credit; lowest rate.
DSCR
20% down · 8.5% · 30yr
- Down + closing
- —
- Monthly P&I
- —
- Monthly cashflow
- —
- DSCR
- —
- Eligible?
- —
No personal income docs; deal must DSCR.
Hard money
10% down · 12.0% · 12mo
- Down + closing
- —
- Monthly P&I
- —
- Monthly cashflow
- —
- DSCR
- —
- Eligible?
- —
Short-term bridge; refi at stabilization.
Rent comps 40 comps
| Address | Beds | Baths | Sqft | Rent | $/sqft | DOM | Units | Dist |
|---|---|---|---|---|---|---|---|---|
| 2402 21st St Lubbock, TX | 3.0 | 1.0 | 1453 | $1,500 | $1.03 | 43d | 1 | 0.03mi |
| 2124 20th St Lubbock, TX | 3.0 | 2.0 | 1481 | $1,150 | $0.78 | 13d | 1 | 0.25mi |
| 2123 18th St Lubbock, TX | 3.0 | 2.0 | 1328 | $949 | $0.71 | 13d | 1 | 0.26mi |
| 2311 25th St Lubbock, TX | 4.0 | 2.0 | 1400 | $1,400 | $1.00 | 21d | 1 | 0.29mi |
| 2220 25th St Lubbock, TX | 4.0 | 1.0 | 1077 | $695 | $0.65 | 21d | 1 | 0.29mi |
| 2404 25th St Lubbock, TX | 3.0 | 2.0 | 1292 | $1,395 | $1.08 | 21d | 1 | 0.30mi |
| 2109 20th St Lubbock, TX | 3.0 | 2.0 | 1391 | $1,200 | $0.86 | 43d | 1 | 0.31mi |
| 2121 17th St Lubbock, TX | 3.0 | 1.0 | 1048 | $995 | $0.95 | 21d | 1 | 0.32mi |
| 2118 24th St Lubbock, TX | 3.0 | 1.0 | 1435 | $1,000 | $0.70 | 21d | 1 | 0.33mi |
| 2421 25th St Lubbock, TX | 3.0 | 2.0 | 1032 | $1,575 | $1.53 | 21d | 1 | 0.34mi |
| 2220 16th St Lubbock, TX | 3.0 | 2.0 | 1414 | $1,300 | $0.92 | 21d | 1 | 0.35mi |
| 2123 25th St Unit rear Lubbock, TX | 3.0 | 1.0 | 1000 | $950 | $0.95 | 43d | 1 | 0.38mi |
| 2119 25th St Lubbock, TX | 3.0 | 1.5 | 1184 | $1,200 | $1.01 | 43d | 1 | 0.39mi |
| 2404 27th St Lubbock, TX | 4.0 | 2.0 | 1250 | $1,349 | $1.08 | 43d | 1 | 0.41mi |
| 1922 18th St Lubbock, TX | 3.0 | 1.0 | 1136 | $1,050 | $0.92 | 21d | 1 | 0.49mi |
| 1912 21st St Lubbock, TX | 3.0 | 2.0 | 1473 | $1,025 | $0.70 | 43d | 1 | 0.49mi |
| 2620 25th St Lubbock, TX | 3.0 | 1.0 | 1282 | $1,600 | $1.25 | 43d | 1 | 0.50mi |
| 2409 13th St Unit 8 Lubbock, TX | 3.0 | 2.0 | 1200 | $1,100 | $0.92 | 43d | 1 | 0.52mi |
| 2201 28th St Lubbock, TX | 3.0 | 1.0 | 1246 | $995 | $0.80 | 21d | 1 | 0.54mi |
| 1904 24th St Lubbock, TX | 3.0 | 1.0 | 1172 | $1,100 | $0.94 | 43d | 1 | 0.56mi |
| 1909 16th St Lubbock, TX | 4.0 | 2.0 | 1312 | $1,600 | $1.22 | 21d | 1 | 0.58mi |
| 1915 26th St Lubbock, TX | 3.0 | 1.0 | 1221 | $1,100 | $0.90 | 43d | 1 | 0.60mi |
| 1920 27th St Unit 1 Lubbock, TX | 3.0 | 3.0 | 1366 | $1,500 | $1.10 | 43d | 1 | 0.60mi |
| 2826 23rd St Lubbock, TX | 3.0 | 1.5 | 1294 | $1,300 | $1.00 | 21d | 1 | 0.68mi |
| 2411 31st St Lubbock, TX | 3.0 | 1.0 | 1003 | $1,000 | $1.00 | 21d | 1 | 0.69mi |
| 2613 30th St Lubbock, TX | 3.0 | 2.0 | 1472 | $1,500 | $1.02 | 43d | 1 | 0.74mi |
| 1601 21st St Unit a Lubbock, TX | 3.0 | 2.0 | 980 | $925 | $0.94 | 13d | 1 | 0.79mi |
| 2106 32nd St Lubbock, TX | 3.0 | 1.0 | 1398 | $925 | $0.66 | 43d | 1 | 0.79mi |
| 2106 32nd St Lubbock, TX | 3.0 | 1.0 | 1398 | $695 | $0.50 | 21d | 1 | 0.79mi |
| 2211 33rd St Unit A Lubbock, TX | 3.0 | 1.5 | 1293 | $1,200 | $0.93 | 43d | 1 | 0.84mi |
| 707 Avenue T Lubbock, TX | 3.0–4.0 | 3.0–4.0 | 1559 | $699 | $0.45 | 43d | 45 | 1.00mi |
| 2217 36th St Lubbock, TX | 3.0 | 1.0 | 1284 | $1,109 | $0.86 | 13d | 1 | 1.02mi |
| 3007 32nd St Lubbock, TX | 3.0 | 1.0 | 1353 | $1,325 | $0.98 | 21d | 1 | 1.06mi |
| 2823 33rd St Lubbock, TX | 3.0 | 1.0 | 1105 | $950 | $0.86 | 43d | 1 | 1.06mi |
| 2015 Avenue L Unit B Lubbock, TX | 3.0 | 2.0 | 980 | $960 | $0.98 | 13d | 1 | 1.07mi |
| 2506 37th St Lubbock, TX | 3.0 | 1.0 | 1053 | $1,550 | $1.47 | 21d | 1 | 1.07mi |
| 2508 37th St Lubbock, TX | 3.0 | 2.5 | 1495 | $1,700 | $1.14 | 43d | 1 | 1.08mi |
| 2108 38th St Lubbock, TX | 3.0 | 2.0 | 1124 | $900 | $0.80 | 43d | 1 | 1.14mi |
| 2712 37th St Lubbock, TX | 3.0 | 1.0 | 1136 | $1,300 | $1.14 | 43d | 1 | 1.16mi |
| 2801 36th St Lubbock, TX | 3.0 | 2.0 | 1446 | $2,700 | $1.87 | 43d | 1 | 1.17mi |
Listing history 19 events
-
2026-06-18days on market $159,000 Active 457 DOM
-
2026-06-17days on market $159,000 Active 456 DOM
-
2026-06-16days on market $159,000 Active 455 DOM
-
2026-06-15days on market $159,000 Active 454 DOM
-
2026-06-14days on market $159,000 Active 452 DOM
-
2026-06-13days on market $159,000 Active 451 DOM
-
2026-06-10days on market $159,000 Active 449 DOM
-
2026-06-09days on market $159,000 Active 448 DOM
-
2026-06-08days on market $159,000 Active 447 DOM
-
2026-06-07days on market $159,000 Active 446 DOM
-
2026-06-05days on market $159,000 Active 443 DOM
-
2026-06-03days on market $159,000 Active 442 DOM
-
2026-06-02days on market $159,000 Active 441 DOM
-
2026-06-01days on market $159,000 Active 440 DOM
-
2026-05-31days on market $159,000 Active 439 DOM
-
2026-05-30days on market $159,000 Active 438 DOM
-
2026-03-03status Active 503-char remark
Show marketing remark (503 chars)
This property offers three distinct units, providing a total of 4 bedrooms and 3 bathrooms. Ideal for investment or multi-generational living, the layout includes a mix of private and shared spaces. Each unit offers comfortable living arrangements, with dedicated kitchens and functional layouts. Whether you're seeking rental income or flexible housing options, this property delivers versatility and potential. Don't miss this opportunity to own a multi-unit property with diverse living arrangements.
-
2026-03-03historical 503-char remark
Show marketing remark (503 chars)
This property offers three distinct units, providing a total of 4 bedrooms and 3 bathrooms. Ideal for investment or multi-generational living, the layout includes a mix of private and shared spaces. Each unit offers comfortable living arrangements, with dedicated kitchens and functional layouts. Whether you're seeking rental income or flexible housing options, this property delivers versatility and potential. Don't miss this opportunity to own a multi-unit property with diverse living arrangements.
-
2025-03-18$159,000 Active 503-char remark
Show marketing remark (503 chars)
This property offers three distinct units, providing a total of 4 bedrooms and 3 bathrooms. Ideal for investment or multi-generational living, the layout includes a mix of private and shared spaces. Each unit offers comfortable living arrangements, with dedicated kitchens and functional layouts. Whether you're seeking rental income or flexible housing options, this property delivers versatility and potential. Don't miss this opportunity to own a multi-unit property with diverse living arrangements.
ⓘ Source: listings_history table (triggers on properties + properties_extension) + one-shot
backfill from property_details.listing_events for pre-trigger history.
Tax reassessment forecast TX · Resets to sale price
- Current annual tax
- $2,482 · $207/mo
- Projected year-2 tax
- $2,910 · $242/mo
- Expected delta
- +$427/yr (+$36/mo · 17.2%)
ⓘ Screening estimate from a state-policy table — verify with the county assessor before closing.
Climate risk First Street
- Flood 1/10 Low FEMA zone X (unshaded) · 0% chance over 30 yrs
- Wildfire 1/10 Low
- Heat 5/10 Major 7 d/yr ≥100°F today · 21 d/yr by 30 yrs out
- Wind 2/10 Low
- Air quality 2/10 Low 1 unhealthy d/yr today · 1 by 30 yrs out
Nearby sold comps map
Loading sold comps map…
Walkable amenities ~0.75 mi
Loading nearby amenities…
Taxation est. · year 1
- Rental income
- $26,292
- − Mortgage interest
- −$8,906
- − Property taxes
- −$2,482
- − Insurance
- −$795
- − Repairs & maintenance
- −$2,103
- − Management
- −$2,103
- − Depreciation
- −$4,625
- Taxable income
- $5,276
- Est. tax owed @ 24.0%
- −$1,266
- After-tax cash flow
- $6,221/yr
For passive investors: Depreciation is non-cash, so a rental often shows a tax loss while cash-flowing — sheltering income. Rental losses are passive: they offset passive income freely, and up to $25,000/yr can offset ordinary (W-2) income if you actively participate and your MAGI is under $100k (phasing out to $0 by $150k); unused losses carry forward. On sale, claimed depreciation is recaptured at up to 25%, and gains may owe capital-gains tax (a 1031 exchange can defer both). Figures are a year-1 estimate at your 24.0% rate — not tax advice; consult a CPA.
Schools (NCES district)
- District
- Lubbock ISD
- NCES district ID
- 4828500
- Math proficiency
- 36% ▼ -8.00%
- Reading proficiency
- 39% ▼ -1.00%
- Median HH income
- $39,820
- Composite
- 31.44/100
- National rank
- #5984
- State rank
- #481 of 826 in TX
Livability — Lubbock
- Score
- 80/100
- State rank
- #37
- US rank
- #1749
Category grades
Schools grade is shown separately in the Schools card above.
Census & demographics
- Census place
- Lubbock, TX
- County
- Lubbock County · 293,542 people
- City population
- 283,030
- Metro
- Lubbock, TX
- Population (ZIP)
- 6,865
- Household income
- $47,634
- Rent vs Own
- Severe rent burden
- 777.0
Population outlook (Lubbock County) Hauer SSP2
- Today (2025)
- 345,960 people
- By 2030
- 371,449 · +7.4%
- By 2040
- 424,539 · +22.7%
- By 2050
- 481,150 · +39.1%
- By 2075
- 633,467 · +83.1%
- By 2100
- 746,853 · +115.9%
Race, ethnicity, and origin ACS 2023
- Neighborhood character
- Diverse neighborhood (Simpson 0.59)
- Race & ethnicity
- Hispanic / Latino 50% White 39% Two or more races 10% Black 9% Native American 2%
- Hispanic origin (detail)
- Mexican 37% Cuban 2%
- Common ancestry
- Slovak 3% Italian 2% Portuguese 2%
- Foreign-born
- 8% · Canada
- Languages at home
- 64% English-only · Spanish 35%
Political lean MEDSL · Lubbock
- 2024 margin
- Solid R (+39.5) · D 29.7% · R 69.2% · Other 1.0%
- 2008→2024 swing
- -2.8pp toward R · 2008: -36.7pp · 2024: -39.5pp
- All cycles
- 2024: R+39.5 2020: R+32.2 2016: R+38.4 2012: R+40.9 2008: R+36.7
Not yet ingested
- Civics
- —
Market trends
- HPI YoY
- ▼ -24.58%
- Current HPI
- 210.495
- Rent YoY
- ▲ 1.87%
- Metro
- Lubbock, TX
- State GDP YoY
- ▲ 3.95%
- F500 in state
- 110
Industry mix (Fortune 500 HQ in TX)
| Industry | F500 HQs | Revenue |
|---|---|---|
| Energy | 16 | $1,198B |
|
||
| Technology | 5 | $198B |
|
||
| Engineering / Construction | 4 | $72B |
|
||
| Energy Services | 3 | $60B |
|
||
| Utilities | 3 | $41B |
|
||
| Healthcare | 2 | $330B |
|
||
Price history
3 events — show timeline
- 2026-03-03 Relisted — LARMLS
- 2026-03-03 Delisted — LARMLS
- 2025-03-18 Listed $159,000 LARMLS
Property tax history
+5.3%/yrLatest (2025): $2,482 · +10.2% YoY. Source: county tax records.
Cash-flow waterfall
monthlySold comps — $/sqft
last 12 mo · ≤1 miLoading sold comps…