535 Twin Elm · Canyon Lake, TX
Flood risk 8/10 · Major
- FEMA flood zone
- X (unshaded)
- Chance of flooding over 30 yrs
- 0.99%
- Est. flood insurance / yr
- $507 – $1,088
Fire risk 4/10 · Minor
- Est. fire insurance / yr
- $1,222 – $2,270
Heat risk 7/10 · Major
- Hot days now (above 106°F)
- 6 days/yr
- Hot days in 30 yrs
- 19 days/yr
Wind risk 6/10 · Moderate
- Chance of severe wind over 30 yrs
- 73.0%
Air-quality risk 2/10 · Minimal
- Unhealthy air days now
- 0 days/yr
- Unhealthy air days in 30 yrs
- 1 days/yr
Risk factors via First Street. Map © Google.
Why this score? — see what drove the D- grade
The composite is a weighted blend of 9 inputs, each scored 0–100. Each bar is that input's sub-score; the figure is the points it added to the 100-point composite (weight × sub-score).
- ARV discount +13.3/15.0
- Cash flow +7.0/30.0
- Schools +5.2/10.0
- Livability +3.4/5.0
- Condition / age +2.5/5.0
- Rent growth +2.2/5.0
- 1% rule +1.8/10.0
- DSCR +1.2/10.0
- Appreciation +0.0/10.0
$175,000
🖨 Deal sheet 📄 Offer letter ✓ Due diligence
Listing remarks MLS
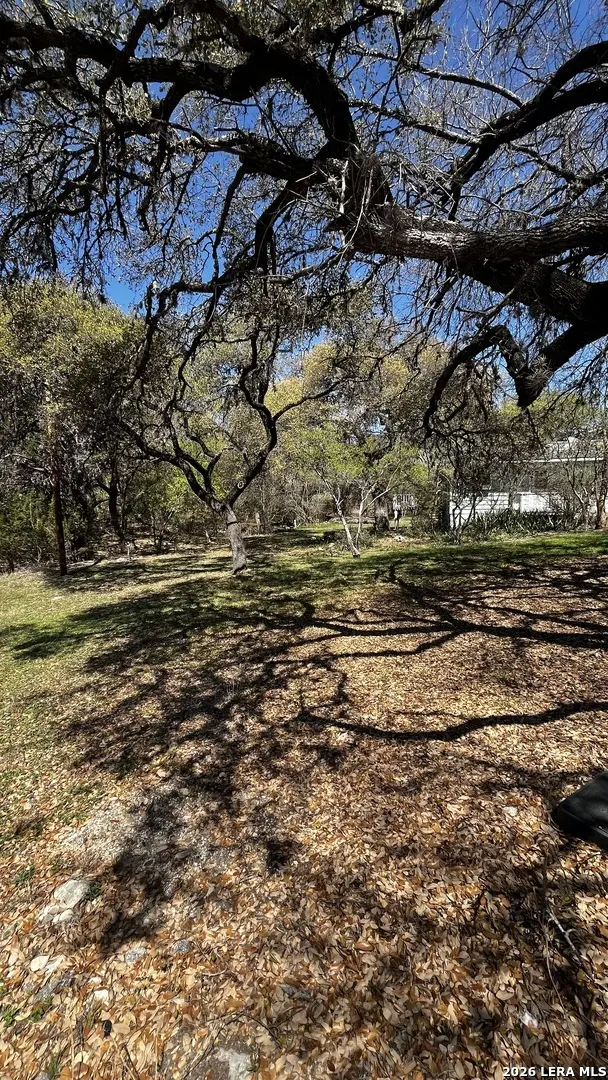
535 Twin Elm in Canyon Lake is the kind of property investors watch for because it offers multiple ways to win. Minutes from the lake and close to multiple boat ramps, this fixer upper sits on a .21 acre lot surrounded by trees and nature, giving it the quiet setting buyers and guests come to Canyon Lake for. The main home offers 1 bedroom, 1 full bath, and 1,016 square feet, plus a full size utility room inside. Out back, the detached 1 car garage adds even more upside with a studio apartment above, approximately 350 square feet with a full bathroom. Use it as a guest suite, long term rental, or short term rental, with an HOA that allows Airbnb style rentals. Bring your vision, renovate strategically, and turn this into a smart investment with income potential from day one.
Key facts
- Multiple boat ramps
- Full bathroom
- Quiet setting
Tags
Neighborhood map
What this means for you Summary
Snapshot
- This is a 1-bed/1.0-bath single-family listed at $175k.
Deal economics
- At list price, monthly cash flow is $-320 ($-4k/yr) — negative.
- To cash-flow at today's rent, offer at most $118k (32.3% below list).
- To meet the 1% rule (rent ≥ 1% of price), the offer needs to be $119k (31.9% below list).
- Recommended offer: $118k (32.3% below list) — sets the bar for cash-flow.
- Cap rate 4.6% vs local median 2.3% in Canyon Lake — top-decile yield for the area; either an underpriced asset or a hidden risk that comps aren't pricing in. Stress-test before assuming the spread holds.
Location & tenants
- Location reads 67/100 on livability (#534 in TX) — a middle-class / working-renter tenant base. Strengths: employment A+, housing A+, cost of living A; Watch: schools C-, amenities F, commute F.
- Comal ISD (rural): math 57% / reading 59% proficiency, ranked #58 of 826 in TX (top 7%) — acceptable for families but not a draw, mixed tenant base, ~2y average lease.
- Market conditions: Rents soft (-1.2%/yr); 1014 active listings in the ZIP; solid renter incomes; 3,420 units permitted in Comal County in 2024 (1,164 in 5+ unit buildings).
- This rent is only 17% of the median local income ($84k/yr) — well below the 30% rent-burden line; pricing power to push rent on renewal without tenant pushback.
Forward outlook
- Local home prices are declining (-3.0%/yr); year-one equity from $1k of loan paydown is wiped out by about $5k of value loss. Plan a longer hold.
- Comal County population projected at +70% by 2050 — long-run rental-demand tailwind backs the buy-and-hold thesis.
Negotiation context
- It's been on market 95 days — a 9% lower offer ($159k) is reasonable based on typical stale-listing flexibility.
Risks & watch-outs
- Watch-outs: flood insurance adds $66/mo.
- Climate carrying-cost: severe flood risk; major wind risk, 73% chance of damaging wind over 30y; extreme-heat days projected 6→19/yr by 2055 (HVAC capex compounding) — expect insurance premiums to compound above CPI over the hold.
Questions for the listing agent
- What do current leases actually rent for vs. the listed asking? Can we see a recent rent roll and the last 12 months of T-12 income?
- It's been on market 95 days. Have you received any prior offers? Is the seller open to a 32% concession, seller financing, or rate buy-down credit?
- Built in 1968 — when were the roof, HVAC, electrical panel, plumbing, and water heater last replaced?
- What's the actual annual flood-insurance premium (NFIP or private), and is the property in a SFHA with mandatory coverage?
- What does the HOA fee cover, when was the last increase, and are there any pending special assessments or reserve-fund shortfalls?
- Why hasn't it sold? Are there any deal-killer items the seller is aware of (foundation, flood, title, zoning, code violations)?
- Is there a deadline driving the sale (1031 exchange, divorce, estate, relocation)? That informs how much negotiation room exists.
- The area grade is low — what's the realistic commute time and amenity access for the typical tenant pool here? Any planned neighborhood developments (good or bad) we should know about?
- What's the average days-on-market for RENTAL listings here right now (not sales)? A rising rental-DOM trend means longer vacancies and softer asking-rent achievability than the comps imply.
- What's the recent tenant-quality profile in this submarket — average credit score on applications, eviction rate, late-payment / NSF rate, and stable-employment percentage? A property-management company in the area should have these aggregated.
- How much new for-sale + rental construction is in the pipeline within 1–3 miles? Heavy new supply typically softens prices + rents 12–24 months out; constrained supply supports both.
Investment metrics
- 1% rule
- 0.68% ✗
- Cap rate
- 4.55%
- Cash-on-cash
- -6.21%
- DSCR
- 0.72
- GRM
- 12.2
CMA / ARV
- ARV (median comp)
- $200,749
- List price
- $175,000
- Delta
- -12.83%
- Verdict
- UNDERPRICED
- Comps
- 20 within 1.0 mi
Show comp detail 3 sales within ~0.75 mi
| Address | Dist | Beds/Ba | Sqft | Sold | Price | $/sf | Match |
|---|---|---|---|---|---|---|---|
| 469 W Overlook Dr | 0.21mi | 2/1.0 (+1) | 760 (+4%) | 17mo | $175,000 | $230 | 63 |
| 430 Wild Cherry | 0.53mi | 2/1.0 (+1) | 680 (-7%) | 10mo | $145,000 | $213 | 51 |
| 843 Grandview Bnd | 0.66mi | 2/1.0 (+1) | 672 (-8%) | 23mo | $90,500 | $135 | 32 |
Match score weights: distance 35% · size 25% · config 20% · recency 20%. Top-matched comps best support the ARV.
Projected returns pro-forma
-3.0% appreciation · 0.0% rent growth · sell at horizon
- IRR
- -33.6%
- Equity multiple
- -0.07×
- Total profit
- $-52,189
- Equity at exit
- $26,093
- IRR
- -65.0%
- Equity multiple
- -0.73×
- Total profit
- $-84,997
- Equity at exit
- $15,131
Cash invested: $49,000 (down + closing). Projections, not guarantees.
Landlord ↔ Tenant lean methodology
- Overall (STATE)
- 87 Strongly Landlord-Friendly
- State Texas
- 87 Strongly Landlord-Friendly · R+5
- County
- — inherits STATE
- City
- — inherits STATE
ZIP-level market 78133
- Home prices YoY
- -33.8%
- Rents YoY
- -1.2%
- Active inventory
- 1014
- Price-to-rent
- 12.2×
Monthly cashflow live
- Estimated rent
- $1,193 medium interval (Pro) →
- Mortgage (P&I)
- −$918
- Tax from tax record
- −$201 /mo · $2,413/yr
- Insurance
- −$73
- Flood insurance flood zone
- −$66 /mo · $798/yr
- HOA
- −$4
- Vacancy / Maint / Mgmt
- −$250
- Net cashflow
- $-320
Break-even live
UW: 25.0% down · 7.5% · 30yr · 1.5% tax · 5.0% vac · 8.0% maint · 8.0% mgmt
Financing live
Cash to close
- Down payment
- $43,750
- Closing costs
- $5,250
- Reserves months
- —
- Total cash needed
- —
Loan-product check · same deal, 3 products live
Conventional
25% down · 7.5% · 30yr
- Down + closing
- —
- Monthly P&I
- —
- Monthly cashflow
- —
- DSCR
- —
- Eligible?
- —
Personal DTI + credit; lowest rate.
DSCR
20% down · 8.5% · 30yr
- Down + closing
- —
- Monthly P&I
- —
- Monthly cashflow
- —
- DSCR
- —
- Eligible?
- —
No personal income docs; deal must DSCR.
Hard money
10% down · 12.0% · 12mo
- Down + closing
- —
- Monthly P&I
- —
- Monthly cashflow
- —
- DSCR
- —
- Eligible?
- —
Short-term bridge; refi at stabilization.
HOA detail
- Monthly dues
- $4 · $48/yr
Listing history 17 events
-
2026-06-18days on market $175,000 Active 95 DOM
-
2026-06-17days on market $175,000 Active 94 DOM
-
2026-06-16days on market $175,000 Active 93 DOM
-
2026-06-15days on market $175,000 Active 92 DOM
-
2026-06-13days on market $175,000 Active 90 DOM
-
2026-06-09days on market $175,000 Active 86 DOM
-
2026-06-08days on market $175,000 Active 85 DOM
-
2026-06-07days on market $175,000 Active 84 DOM
-
2026-06-04days on market $175,000 Active 81 DOM
-
2026-06-03days on market $175,000 Active 80 DOM
-
2026-06-02days on market $175,000 Active 79 DOM
-
2026-06-01days on market $175,000 Active 78 DOM
-
2026-05-31days on market $175,000 Active 77 DOM
-
2026-04-10price $175,000 787-char remark
Show marketing remark (787 chars)
535 Twin Elm in Canyon Lake is the kind of property investors watch for because it offers multiple ways to win. Minutes from the lake and close to multiple boat ramps, this fixer upper sits on a .21 acre lot surrounded by trees and nature, giving it the quiet setting buyers and guests come to Canyon Lake for. The main home offers 1 bedroom, 1 full bath, and 1,016 square feet, plus a full size utility room inside. Out back, the detached 1 car garage adds even more upside with a studio apartment above, approximately 350 square feet with a full bathroom. Use it as a guest suite, long term rental, or short term rental, with an HOA that allows Airbnb style rentals. Bring your vision, renovate strategically, and turn this into a smart investment with income potential from day one.
-
2026-03-15$199,000 New 787-char remark
Show marketing remark (787 chars)
535 Twin Elm in Canyon Lake is the kind of property investors watch for because it offers multiple ways to win. Minutes from the lake and close to multiple boat ramps, this fixer upper sits on a .21 acre lot surrounded by trees and nature, giving it the quiet setting buyers and guests come to Canyon Lake for. The main home offers 1 bedroom, 1 full bath, and 1,016 square feet, plus a full size utility room inside. Out back, the detached 1 car garage adds even more upside with a studio apartment above, approximately 350 square feet with a full bathroom. Use it as a guest suite, long term rental, or short term rental, with an HOA that allows Airbnb style rentals. Bring your vision, renovate strategically, and turn this into a smart investment with income potential from day one.
-
1996-02-15soldstatus
-
1994-07-26soldstatus
ⓘ Source: listings_history table (triggers on properties + properties_extension) + one-shot
backfill from property_details.listing_events for pre-trigger history.
Tax reassessment forecast TX · Resets to sale price
- Current annual tax
- $2,413 · $201/mo
- Projected year-2 tax
- $3,202 · $267/mo
- Expected delta
- +$790/yr (+$66/mo · 32.7%)
ⓘ Screening estimate from a state-policy table — verify with the county assessor before closing.
Climate risk First Street
- Flood 8/10 Severe FEMA zone X (unshaded) · 99% chance over 30 yrs
- Wildfire 4/10 Moderate
- Heat 7/10 Severe 6 d/yr ≥106°F today · 19 d/yr by 30 yrs out
- Wind 6/10 Major 73% chance of damaging wind over 30 yrs
- Air quality 2/10 Low 0 unhealthy d/yr today · 1 by 30 yrs out
Nearby sold comps map
Loading sold comps map…
Walkable amenities ~0.75 mi
Loading nearby amenities…
Taxation est. · year 1
- Rental income
- $14,310
- − Mortgage interest
- −$9,803
- − Property taxes
- −$2,413
- − Insurance
- −$1,672
- − Repairs & maintenance
- −$1,145
- − Management
- −$1,145
- − HOA
- −$48
- − Depreciation
- −$5,091
- Taxable loss
- −$7,007
- Est. tax savings @ 24.0%
- +$1,682
- After-tax cash flow
- $-2,160/yr
For passive investors: Depreciation is non-cash, so a rental often shows a tax loss while cash-flowing — sheltering income. Rental losses are passive: they offset passive income freely, and up to $25,000/yr can offset ordinary (W-2) income if you actively participate and your MAGI is under $100k (phasing out to $0 by $150k); unused losses carry forward. On sale, claimed depreciation is recaptured at up to 25%, and gains may owe capital-gains tax (a 1031 exchange can defer both). Figures are a year-1 estimate at your 24.0% rate — not tax advice; consult a CPA.
Schools (NCES district)
- District
- Comal ISD
- NCES district ID
- 4814730
- Math proficiency
- 57% ▼ -9.00%
- Reading proficiency
- 59% ▼ -2.00%
- Median HH income
- $74,792
- Composite
- 51.79/100
- National rank
- #1671
- State rank
- #58 of 826 in TX
Livability — Canyon Lake
- Score
- 67/100
- State rank
- #534
- US rank
- #10441
Category grades
Schools grade is shown separately in the Schools card above.
Census & demographics
- Census place
- Canyon Lake, TX
- County
- Comal County · 206,262 people
- City population
- 42,159
- Metro
- San Antonio-New Braunfels, TX
- Population (ZIP)
- 21,959
- Household income
- $83,853
- Rent vs Own
- Severe rent burden
- 402.0
Population outlook (Comal County) Hauer SSP2
- Today (2025)
- 175,637 people
- By 2030
- 199,911 · +13.8%
- By 2040
- 249,436 · +42.0%
- By 2050
- 299,430 · +70.5%
- By 2075
- 423,857 · +141.3%
- By 2100
- 512,048 · +191.5%
Race, ethnicity, and origin ACS 2023
- Neighborhood character
- Predominantly White (74%)
- Race & ethnicity
- White 74% Hispanic / Latino 20% Two or more races 10% Black 2%
- Hispanic origin (detail)
- Mexican 15%
- Common ancestry
- Lithuanian 3% Romanian 3% Italian 3%
- Foreign-born
- 4% · Canada
- Languages at home
- 91% English-only · Spanish 7%
Political lean MEDSL · Comal
- 2024 margin
- Solid R (+45.5) · D 26.8% · R 72.2%
- 2008→2024 swing
- +1.9pp toward D · 2008: -47.4pp · 2024: -45.5pp
- All cycles
- 2024: R+45.5 2020: R+42.7 2016: R+50.1 2012: R+54.1 2008: R+47.4
Not yet ingested
- Civics
- —
Market trends
- HPI YoY
- ▼ -111.36%
- Current HPI
- 218.4633
- Rent YoY
- ▼ -1.20%
- Metro
- San Antonio-New Braunfels, TX
- State GDP YoY
- ▲ 3.95%
- F500 in state
- 110
Industry mix (Fortune 500 HQ in TX)
| Industry | F500 HQs | Revenue |
|---|---|---|
| Energy | 16 | $1,198B |
|
||
| Technology | 5 | $198B |
|
||
| Engineering / Construction | 4 | $72B |
|
||
| Energy Services | 3 | $60B |
|
||
| Utilities | 3 | $41B |
|
||
| Healthcare | 2 | $330B |
|
||
Price history
-12.1% since first listed4 events — show timeline
- 2026-04-10 Price Changed $175,000 LERA
- 2026-03-15 Listed $199,000 LERA
- 1996-02-15 Sold (Public Records) — Public Records
- 1994-07-26 Sold (Public Records) — Public Records
Property tax history
+3.4%/yrLatest (2026): $2,413 · -10.8% YoY. Source: county tax records.
Cash-flow waterfall
monthlySold comps — $/sqft
last 12 mo · ≤1 miLoading sold comps…