 Duplex
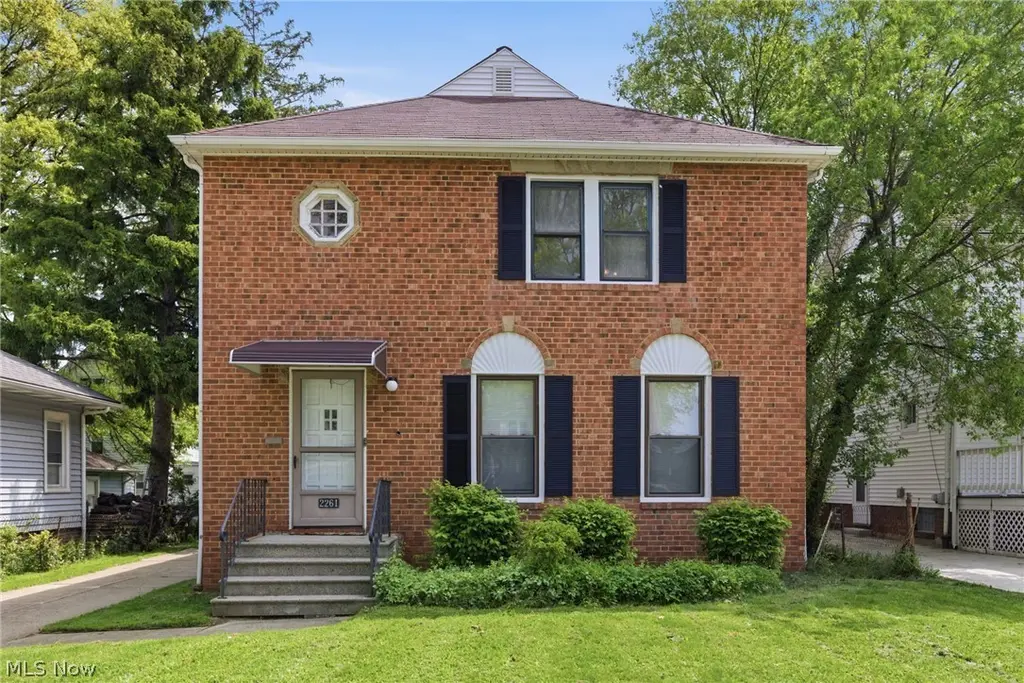
2261 Warren Rd · Lakewood, OH
Flood risk 1/10 · Minimal
- FEMA flood zone
- X (unshaded)
- Chance of flooding over 30 yrs
- 0.0%
- Est. flood insurance / yr
- $473 – $860
Fire risk 1/10 · Minimal
- Est. fire insurance / yr
- $713 – $1,323
Heat risk 3/10 · Minor
- Hot days now (above 94°F)
- 7 days/yr
- Hot days in 30 yrs
- 17 days/yr
Wind risk 1/10 · Minimal
- Chance of severe wind over 30 yrs
- —
Air-quality risk 3/10 · Minor
- Unhealthy air days now
- 4 days/yr
- Unhealthy air days in 30 yrs
- 4 days/yr
Risk factors via First Street. Map © Google.
Why this score? — see what drove the C- grade
The composite is a weighted blend of 9 inputs, each scored 0–100. Each bar is that input's sub-score; the figure is the points it added to the 100-point composite (weight × sub-score).
- ARV discount +14.1/15.0
- Cash flow +12.8/30.0
- Schools +5.5/10.0
- Livability +4.4/5.0
- 1% rule +4.0/10.0
- DSCR +3.8/10.0
- Rent growth +3.8/5.0
- Condition / age +2.5/5.0
- Appreciation +0.0/10.0
$300,000
🖨 Deal sheet 📄 Offer letter ✓ Due diligence
Multi-family units
County records classify this as Multi-Family (2-4 Unit). Listing-text estimate: 2 units. confirmed
Listing remarks MLS
Call Down Tenant, Then Use Elec Lb Side Door For Both Units * Up Unit Is Vacant * Home Warr!! Newer Kit. And C/A Down
Key facts
- All brick duplex
- 6,969 sq ft lot
- 2 garage spots
Tags
Property features AI
Exterior
- Parking: Detached 2-car garage; Concrete driveway; Off-street parking; Parking pad; On-street parking available
- Security: Smoke detectors; Carbon monoxide detectors
- Utilities: Public water; Public sewer
- Home design: 2-story building; Single building (multi-unit property); Above-grade finished living area of 1,872
- Construction: Brick construction; Asphalt/fiberglass roof; Block foundation; Built according to public records
- Exterior features: Balcony; Front yard; Back yard
Interior
- Kitchen: Range; Microwave; Dishwasher; Garbage disposal; Refrigerator
- Bedrooms: Two 2-bedroom units (both vacant)
- Bathrooms: Two full bathrooms (one in each unit)
- Heating & cooling: Forced air heating (gas); Central air conditioning; Ceiling fans
- Interior features: Updated/remodeled condition; Full unfinished concrete basement
- Laundry & utility: Washer hookup; Electric dryer hookup; Laundry tub and sink; Laundry located in basement
Neighborhood map
What this means for you Summary
Snapshot
- This is a 2 × 2-bed/1.0-bath units multifamily listed at $300k.
Deal economics
- At list price, monthly cash flow is $-28 ($-341/yr) — negative. Per door: $-14/mo.
- To cash-flow at today's rent, offer at most $295k (1.7% below list).
- To meet the 1% rule (rent ≥ 1% of price), the offer needs to be $270k (10.0% below list).
- Recommended offer: $270k (10.0% below list) — sets the bar for 1% rule.
- Cap rate 6.2% vs local median 2.5% in Lakewood — top-decile yield for the area; either an underpriced asset or a hidden risk that comps aren't pricing in. Stress-test before assuming the spread holds.
Location & tenants
- Location reads 88/100 on livability (#29 in OH, #249 nationally) — a professional / high-income tenant draw. Strengths: schools A+, amenities A+, cost of living A+; Watch: commute F.
- Lakewood City (suburban): math 60% / reading 71% proficiency, ranked #213 of 656 in OH (top 32%) — acceptable for families but not a draw, mixed tenant base, ~2y average lease.
- Market conditions: Rents rising fast (+5.4%/yr); 201 active listings in the ZIP; 15 comparable units currently listed for rent nearby; rentals at typical pace (median 21d on market — plan ~3-4 weeks tenant-placement turnaround); 1,441 units permitted in Cuyahoga County in 2024 (700 in 5+ unit buildings).
- At $2,699/mo this rent would consume 47% of the median local household income ($69k/yr) (locally 2271% of renters already pay >50% of income on rent) — very limited rent-growth headroom before tenants either downsize or default.
Forward outlook
- Local home prices are declining (-3.0%/yr); year-one equity from $2k of loan paydown is wiped out by about $9k of value loss. Plan a longer hold.
- Cuyahoga County population projected to shrink 8% by 2050 — rents likely to lag national; underwrite the cash flow, not the appreciation.
Negotiation context
- Only 6 days on market — expect competitive offers; lowballing is unlikely to land.
- 2 sale attempts since 31y ago with the ask held roughly flat each time — persistent listings suggest the price (not the market) is what's stuck; bring a comps-based counter.
- Current owner paid $112k; list at $300k implies a 168% gain — meaningful room to come down on a strong offer.
Risks & watch-outs
- Watch-outs: built in 1944 — expect roof / HVAC / electrical / plumbing capex.
Questions for the listing agent
- What do current leases actually rent for vs. the listed asking? Can we see a recent rent roll and the last 12 months of T-12 income?
- Can we see the unit-by-unit rent roll, current vacancy, and any below-market leases? What's the average tenancy length?
- What capital expenditures (roof, boiler, parking lot, exteriors) have been made in the last 5 years, and what's planned in the next 2?
- Built in 1944 — when were the roof, HVAC, electrical panel, plumbing, and water heater last replaced?
- Is there a deadline driving the sale (1031 exchange, divorce, estate, relocation)? That informs how much negotiation room exists.
- Schools are A-rated — typically a magnet for longer-tenancy family renters. What's the average tenant stay here, and is there a school-zone premium baked into asking?
- What's the average days-on-market for RENTAL listings here right now (not sales)? A rising rental-DOM trend means longer vacancies and softer asking-rent achievability than the comps imply.
- What's the recent tenant-quality profile in this submarket — average credit score on applications, eviction rate, late-payment / NSF rate, and stable-employment percentage? A property-management company in the area should have these aggregated.
- How much new apartment / multifamily construction is in the pipeline within 1–3 miles? Heavy new supply (>2% of stock underway) typically softens rents 12–24 months out; light construction supports rent growth.
Investment metrics
- 1% rule
- 0.90% ✗
- Cap rate
- 6.18%
- Cash-on-cash
- -0.41%
- DSCR
- 0.98
- GRM
- 9.3
CMA / ARV
- ARV (median comp)
- $351,846
- List price
- $300,000
- Delta
- -14.74%
- Verdict
- UNDERPRICED
- Comps
- 20 within 1.0 mi
Show comp detail 12 sales within ~0.75 mi
| Address | Dist | Beds/Ba | Sqft | Sold | Price | $/sf | Match |
|---|---|---|---|---|---|---|---|
| 14217 Athens Ave | 0.32mi | 4/2.0 | 1,868 (-0%) | 2mo | $315,000 | $169 | 83 |
| 2209 Alger Rd | 0.15mi | 5/2.0 (+1) | 1,958 (+5%) | 7mo | $305,000 | $156 | 75 |
| 14924 Delaware Ave | 0.21mi | 4/2.0 | 1,996 (+7%) | 7mo | $367,000 | $184 | 73 |
| 2115 Wascana Ave | 0.52mi | 4/2.0 | 1,916 (+2%) | 3mo | $369,900 | $193 | 70 |
| 2204 Lewis Dr | 0.60mi | 4/2.0 | 1,848 (-1%) | 7mo | $330,000 | $179 | 64 |
| 2148 Wyandotte Ave | 0.52mi | 4/2.0 | 1,962 (+5%) | 12mo | $334,900 | $171 | 58 |
| 15519 Delaware Ave | 0.42mi | 4/2.0 | 2,030 (+8%) | 12mo | $390,000 | $192 | 57 |
| 2114 Elbur Ave | 0.59mi | 4/2.0 | 2,046 (+9%) | 1mo | $300,000 | $147 | 56 |
| 2036 Reveley Ave | 0.42mi | 4/2.0 | 2,128 (+14%) | 11mo | $325,000 | $153 | 48 |
| 1578-1580 Mars Ave | 0.72mi | 4/2.0 | 2,066 (+10%) | 2mo | $240,000 | $116 | 48 |
| 2100 Wascana Ave | 0.51mi | 5/2.0 (+1) | 2,096 (+12%) | 7mo | $400,000 | $191 | 46 |
| 2079-2081 Wascana Ave | 0.55mi | 5/3.0 (+1) | 2,132 (+14%) | 9mo | $435,000 | $204 | 35 |
Match score weights: distance 35% · size 25% · config 20% · recency 20%. Top-matched comps best support the ARV.
Projected returns pro-forma
-3.0% appreciation · 5.39% rent growth · sell at horizon
- IRR
- -14.2%
- Equity multiple
- 0.48×
- Total profit
- $-43,682
- Equity at exit
- $44,731
- IRR
- -1.8%
- Equity multiple
- 0.86×
- Total profit
- $-11,346
- Equity at exit
- $25,939
Cash invested: $84,000 (down + closing). Projections, not guarantees.
Landlord ↔ Tenant lean methodology
- Overall (STATE)
- 73 Landlord-Friendly
- State Ohio
- 73 Landlord-Friendly · R+6
- County
- — inherits STATE
- City
- — inherits STATE
ZIP-level market 44107
- Rents YoY
- 5.4%
- Active inventory
- 201
- Price-to-rent
- 18.5×
Monthly cashflow live
- Estimated rent
- $2,699 high interval (Pro) →
- Mortgage (P&I)
- −$1,573
- Tax from tax record
- −$462 /mo · $5,548/yr
- Insurance
- −$125
- HOA
- −$0
- Vacancy / Maint / Mgmt
- −$567
- Net cashflow
- $-28
Break-even live
2-unit breakdown (identical units grouped — click to expand)
| Units | Beds | Baths | Est. rent |
|---|---|---|---|
| 2× units | 2 | 1 | $2,700 |
| #1 | 2 | 1 | $1,350 |
| #2 | 2 | 1 | $1,350 |
| Total (2 units) | $2,699 | ||
UW: 25.0% down · 7.5% · 30yr · 1.5% tax · 5.0% vac · 8.0% maint · 8.0% mgmt
Financing live
Cash to close
- Down payment
- $75,000
- Closing costs
- $9,000
- Reserves months
- —
- Total cash needed
- —
Loan-product check · same deal, 3 products live
Conventional
25% down · 7.5% · 30yr
- Down + closing
- —
- Monthly P&I
- —
- Monthly cashflow
- —
- DSCR
- —
- Eligible?
- —
Personal DTI + credit; lowest rate.
DSCR
20% down · 8.5% · 30yr
- Down + closing
- —
- Monthly P&I
- —
- Monthly cashflow
- —
- DSCR
- —
- Eligible?
- —
No personal income docs; deal must DSCR.
Hard money
10% down · 12.0% · 12mo
- Down + closing
- —
- Monthly P&I
- —
- Monthly cashflow
- —
- DSCR
- —
- Eligible?
- —
Short-term bridge; refi at stabilization.
Rent comps 15 comps
| Address | Beds | Baths | Sqft | Rent | $/sqft | DOM | Units | Dist |
|---|---|---|---|---|---|---|---|---|
| 2125 Mars Ave Lakewood, OH | 4.0 | 2.0 | 1650 | $2,000 | $1.21 | 23d | 1 | 0.37mi |
| 2180 Elbur Ave Lakewood, OH | 3.0 | 1.0 | 1226 | $2,200 | $1.79 | 16d | 1 | 0.53mi |
| 2082 Lewis Dr Unit 2082 Lakewood, OH | 3.0 | 1.0 | 1600 | $1,750 | $1.09 | 43d | 1 | 0.64mi |
| 2010 Chesterland Ave Unit 1496099P Lakewood, OH | 4.0 | 2.5 | 1463 | $7,556 | $5.16 | 12d | 1 | 0.75mi |
| 1533 Mars Ave Unit 1533 Lakewood, OH | 3.0 | 1.0 | 1500 | $1,725 | $1.15 | 43d | 1 | 0.79mi |
| 16806 Pilgrim Ave Unit 1496036P Cleveland, OH | 4.0 | 2.5 | 1937 | $6,179 | $3.19 | 1d | 1 | 0.93mi |
| 1657 Wagar Ave Unit 2 Lakewood, OH | 4.0 | 2.0 | 1992 | $2,280 | $1.14 | 21d | 1 | 0.95mi |
| 1574 Cohassett Ave Lakewood, OH | 4.0 | 1.5 | 1825 | $2,275 | $1.25 | 17d | 1 | 1.09mi |
| 1303 Lakeland Ave Lakewood, OH | 3.0 | 1.5 | 2000 | $1,750 | $0.88 | 43d | 1 | 1.25mi |
| 1265 Marlowe Ave Lakewood, OH | 4.0 | 1.0 | 1690 | $1,750 | $1.04 | 14d | 1 | 1.25mi |
| 3457 W 128th St Unit 1496115P Cleveland, OH | 3.0 | 2.0 | 1732 | $5,104 | $2.95 | 12d | 1 | 1.34mi |
| 1252 Summit Ave Lakewood, OH | 3.0 | 1.5 | 1632 | $2,650 | $1.62 | 43d | 1 | 1.37mi |
| 3629 W 130th St Cleveland, OH | 3.0 | 2.0 | 1536 | $1,800 | $1.17 | 23d | 1 | 1.43mi |
| 1446 Hopkins Ave Lakewood, OH | 4.0 | 4.0 | 1880 | $1,950 | $1.04 | 43d | 1 | 1.47mi |
| 12206 Detroit Ave Lakewood, OH | 3.0 | 2.0 | 1554 | $2,500 | $1.61 | 17d | 1 | 1.50mi |
Listing history 6 events
-
2026-05-13$300,000 Active 1364-char remark
-
1995-12-30soldstatus $112,000 117-char remark
Show marketing remark (117 chars)
Call Down Tenant, Then Use Elec Lb Side Door For Both Units * Up Unit Is Vacant * Home Warr!! Newer Kit. And C/A Down
-
1995-12-19soldstatus $112,000
-
1995-11-22historical 117-char remark
Show marketing remark (117 chars)
Call Down Tenant, Then Use Elec Lb Side Door For Both Units * Up Unit Is Vacant * Home Warr!! Newer Kit. And C/A Down
-
1995-05-22$119,900 117-char remark
Show marketing remark (117 chars)
Call Down Tenant, Then Use Elec Lb Side Door For Both Units * Up Unit Is Vacant * Home Warr!! Newer Kit. And C/A Down
-
1986-08-14soldstatus $36,000
ⓘ Source: listings_history table (triggers on properties + properties_extension) + one-shot
backfill from property_details.listing_events for pre-trigger history.
Tax reassessment forecast OH · Partial reset (capped growth)
- Current annual tax
- $5,548 · $462/mo
- Projected year-2 tax
- $5,548 · $462/mo
- Expected delta
- $0/yr ($0/mo · 0.0%)
ⓘ Screening estimate from a state-policy table — verify with the county assessor before closing.
Climate risk First Street
- Flood 1/10 Low FEMA zone X (unshaded) · 0% chance over 30 yrs
- Wildfire 1/10 Low
- Heat 3/10 Moderate 7 d/yr ≥94°F today · 17 d/yr by 30 yrs out
- Wind 1/10 Low
- Air quality 3/10 Moderate 4 unhealthy d/yr today · 4 by 30 yrs out
Nearby sold comps map
Loading sold comps map…
Walkable amenities ~0.75 mi
Loading nearby amenities…
Taxation est. · year 1
- Rental income
- $32,388
- − Mortgage interest
- −$16,805
- − Property taxes
- −$5,548
- − Insurance
- −$1,500
- − Repairs & maintenance
- −$2,591
- − Management
- −$2,591
- − Depreciation
- −$8,727
- Taxable loss
- −$5,375
- Est. tax savings @ 24.0%
- +$1,290
- After-tax cash flow
- $949/yr
For passive investors: Depreciation is non-cash, so a rental often shows a tax loss while cash-flowing — sheltering income. Rental losses are passive: they offset passive income freely, and up to $25,000/yr can offset ordinary (W-2) income if you actively participate and your MAGI is under $100k (phasing out to $0 by $150k); unused losses carry forward. On sale, claimed depreciation is recaptured at up to 25%, and gains may owe capital-gains tax (a 1031 exchange can defer both). Figures are a year-1 estimate at your 24.0% rate — not tax advice; consult a CPA.
Schools (NCES district)
- District
- Lakewood City
- NCES district ID
- 3904419
- Math proficiency
- 60% ▼ -11.00%
- Reading proficiency
- 71% ▼ -3.00%
- Median HH income
- $45,181
- Composite
- 55.13/100
- National rank
- #1282
- State rank
- #213 of 656 in OH
Livability — Lakewood
- Score
- 88/100
- State rank
- #29
- US rank
- #249
Category grades
Schools grade is shown separately in the Schools card above.
Census & demographics
- Census place
- Lakewood, OH
- County
- Cuyahoga County · 1,090,369 people
- City population
- 50,018
- Metro
- Cleveland-Elyria, OH
- Population (ZIP)
- 50,018
- Household income
- $68,970
- Rent vs Own
- Severe rent burden
- 2271.0
Population outlook (Cuyahoga County) Hauer SSP2
- Today (2025)
- 1,244,621 people
- By 2030
- 1,230,093 · -1.2%
- By 2040
- 1,189,108 · -4.5%
- By 2050
- 1,145,706 · -7.9%
- By 2075
- 1,076,557 · -13.5%
- By 2100
- 978,987 · -21.3%
Race, ethnicity, and origin ACS 2023
- Neighborhood character
- Predominantly White (83%)
- Race & ethnicity
- White 83% Black 6% Two or more races 5% Hispanic / Latino 4% Asian 2%
- Common ancestry
- Romanian 8% Lithuanian 2% Slovak 2%
- Foreign-born
- 8% · Canada, China
- Languages at home
- 90% English-only · Arabic 3% Other Indo-European 2% Spanish 2%
Political lean MEDSL · Cuyahoga
- 2024 margin
- Solid D (+31.5) · D 65.4% · R 33.9%
- 2008→2024 swing
- -7.4pp toward R · 2008: 38.9pp · 2024: 31.5pp
- All cycles
- 2024: D+31.5 2020: D+34.1 2016: D+35.0 2012: D+38.7 2008: D+38.9
Not yet ingested
- Civics
- —
Market trends
- HPI YoY
- ▼ -347.35%
- Current HPI
- 266.5337
- Rent YoY
- ▲ 5.39%
- Metro
- Cleveland-Elyria, OH
- State GDP YoY
- ▲ 1.98%
- F500 in state
- 48
Industry mix (Fortune 500 HQ in OH)
| Industry | F500 HQs | Revenue |
|---|---|---|
| Insurance | 3 | $145B |
|
||
| Industrial Machinery | 3 | $49B |
|
||
| Financial Services | 3 | $24B |
|
||
| Consumer Goods | 2 | $93B |
|
||
| Aerospace / Defense | 2 | $47B |
|
||
| Utilities | 2 | $33B |
|
||
Price history
+733.3% since first listed7 events — show timeline
- 2026-05-19 Pending — MLSNOW
- 2026-05-13 Listed $300,000 MLSNOW
- 1995-12-30 Sold (MLS) $112,000 MLSNOW
- 1995-12-19 Sold (Public Records) $112,000 Public Records
- 1995-11-22 Listing Removed — MLSNOW
- 1995-05-22 Listed $119,900 MLSNOW
- 1986-08-14 Sold (Public Records) $36,000 Public Records
Property tax history
+2.9%/yrLatest (2025): $5,548 · -0.2% YoY. Source: county tax records.
Cash-flow waterfall
monthlySold comps — $/sqft
last 12 mo · ≤1 miLoading sold comps…