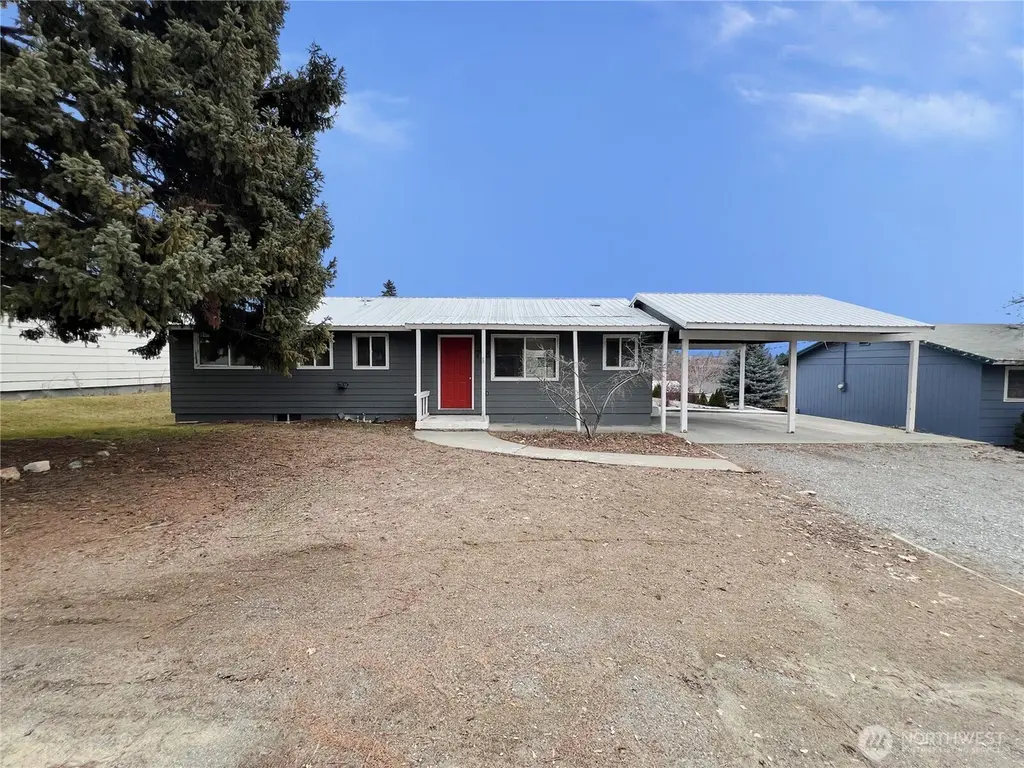
728 Sunrise Dr · Omak, WA
Flood risk 1/10 · Minimal
- FEMA flood zone
- X
- Chance of flooding over 30 yrs
- 0.0%
- Est. flood insurance / yr
- $473 – $860
Fire risk 9/10 · Severe
- Est. fire insurance / yr
- $604 – $1,122
Heat risk 5/10 · Moderate
- Hot days now (above 97°F)
- 7 days/yr
- Hot days in 30 yrs
- 15 days/yr
Wind risk 1/10 · Minimal
- Chance of severe wind over 30 yrs
- —
Air-quality risk 10/10 · Severe
- Unhealthy air days now
- 23 days/yr
- Unhealthy air days in 30 yrs
- 27 days/yr
Risk factors via First Street. Map © Google.
Why this score? — see what drove the C grade
The composite is a weighted blend of 9 inputs, each scored 0–100. Each bar is that input's sub-score; the figure is the points it added to the 100-point composite (weight × sub-score).
- Cash flow +20.6/30.0
- ARV discount +15.0/15.0
- DSCR +6.5/10.0
- 1% rule +5.2/10.0
- Schools +3.6/10.0
- Livability +3.2/5.0
- Rent growth +2.5/5.0
- Condition / age +2.5/5.0
- Appreciation +0.0/10.0
$162,000
🖨 Deal sheet 📄 Offer letter ✓ Due diligence
Listing remarks
Daylight basement rambler with large fenced in backyard. Featuring 4 bedrooms and 1.5 baths. Kitchen with dining area. Living room with hardwood floors. 3 bedrooms on main floor. Lower level features large recreation area and 2 potential bedrooms. Two car attached carport keeps your car out of the elements. Close to downtown Omak, close to shopping and Hwy 97.
Key facts
- Daylight basement
- 9,148 sq ft lot
- 2 parking spots
Tags
Neighborhood map
What this means for you Summary
Snapshot
- This is a 4-bed/2.0-bath single-family listed at $162k.
Deal economics
- At list price, monthly cash flow is $216 ($3k/yr) — positive.
- The deal already cash-flows at list — no discount required.
- Meets the 1% rule at list price ($2k rent vs $162k).
- Recommended offer: $147k (9.0% below list) — sets the bar for market timing.
- Cap rate 7.9% vs local median 2.4% in Omak — top-decile yield for the area; either an underpriced asset or a hidden risk that comps aren't pricing in. Stress-test before assuming the spread holds.
Location & tenants
- Location reads 63/100 on livability (#386 in WA) — a middle-class / working-renter tenant base. Strengths: cost of living A+; Watch: schools C-, crime C-, health & safety C-.
- Omak School District (town): math 29% / reading 49% proficiency, ranked #227 of 291 in WA (top 78%) — families likely to look elsewhere, expect single-tenant / working-renter base with shorter leases.
- Market conditions: 105 active listings in the ZIP; 234 units permitted in Okanogan County in 2024 (0 in 5+ unit buildings).
Forward outlook
- Local home prices are declining (-3.0%/yr); year-one equity from $1k of loan paydown is wiped out by about $5k of value loss. Plan a longer hold.
- Okanogan County population projected at -12% by 2050 — secular population decline; favor cash flow + early exit over multi-decade hold.
Negotiation context
- It's been on market 115 days — a 9% lower offer ($147k) is reasonable based on typical stale-listing flexibility.
- 4 sale attempts since 16y ago; this cycle's ask has dropped $28k (15%) from the opening price — seller is motivated, your offer sets the floor, not the list.
Risks & watch-outs
- Climate carrying-cost: severe wildfire risk; extreme-heat days projected 7→15/yr by 2055 (HVAC capex compounding) — expect insurance premiums to compound above CPI over the hold.
Questions for the listing agent
- It's been on market 115 days. Have you received any prior offers? Is the seller open to a 9% concession, seller financing, or rate buy-down credit?
- Built in 1964 — when were the roof, HVAC, electrical panel, plumbing, and water heater last replaced?
- Why hasn't it sold? Are there any deal-killer items the seller is aware of (foundation, flood, title, zoning, code violations)?
- Is there a deadline driving the sale (1031 exchange, divorce, estate, relocation)? That informs how much negotiation room exists.
- What's the average days-on-market for RENTAL listings here right now (not sales)? A rising rental-DOM trend means longer vacancies and softer asking-rent achievability than the comps imply.
- What's the recent tenant-quality profile in this submarket — average credit score on applications, eviction rate, late-payment / NSF rate, and stable-employment percentage? A property-management company in the area should have these aggregated.
- How much new for-sale + rental construction is in the pipeline within 1–3 miles? Heavy new supply typically softens prices + rents 12–24 months out; constrained supply supports both.
Investment metrics
- 1% rule
- 1.02% ✓
- Cap rate
- 7.90%
- Cash-on-cash
- 5.72%
- DSCR
- 1.25
- GRM
- 8.2
CMA / ARV
- ARV (median comp)
- $321,518
- List price
- $162,000
- Delta
- -49.61%
- Verdict
- UNDERPRICED
- Comps
- 20 within 1.0 mi
Show comp detail 10 sales within ~0.75 mi
| Address | Dist | Beds/Ba | Sqft | Sold | Price | $/sf | Match |
|---|---|---|---|---|---|---|---|
| 709 Sunrise Dr | 0.07mi | 3/2.0 (-1) | 1,775 (-8%) | 5mo | $207,000 | $117 | 75 |
| 509 Locust St | 0.40mi | 4/2.0 | 1,976 (+3%) | 12mo | $300,000 | $152 | 67 |
| 71 Shumway Rd | 0.50mi | 3/2.5 (-1) | 1,846 (-4%) | 3mo | $468,750 | $254 | 61 |
| 607 Bramble Ave | 0.23mi | 3/2.0 (-1) | 1,700 (-12%) | 8mo | $285,000 | $168 | 58 |
| 713 Locust St | 0.28mi | 5/3.0 (+1) | 2,160 (+12%) | 7mo | $325,000 | $150 | 52 |
| 224 W Apple St | 0.57mi | 3/2.0 (-1) | 1,748 (-9%) | 3mo | $218,000 | $125 | 50 |
| 600 W Bartlett Ave | 0.63mi | 3/2.0 (-1) | 1,856 (-4%) | 21mo | $340,000 | $183 | 42 |
| 304 Apple Ave W | 0.59mi | 4/2.0 | 1,662 (-14%) | 10mo | $292,500 | $176 | 42 |
| 224 Dewberry E | 0.45mi | 3/1.0 (-1) | 1,674 (-13%) | 13mo | $292,740 | $175 | 37 |
| 536 Hillcrest Circle Dr | 0.38mi | 3/2.0 (-1) | 1,645 (-14%) | 22mo | $495,000 | $301 | 34 |
Match score weights: distance 35% · size 25% · config 20% · recency 20%. Top-matched comps best support the ARV.
Projected returns pro-forma
-3.0% appreciation · 3.0% rent growth · sell at horizon
- IRR
- -7.4%
- Equity multiple
- 0.73×
- Total profit
- $-12,463
- Equity at exit
- $24,155
- IRR
- 2.1%
- Equity multiple
- 1.15×
- Total profit
- $6,915
- Equity at exit
- $14,007
Cash invested: $45,360 (down + closing). Projections, not guarantees.
Landlord ↔ Tenant lean methodology
- Overall (STATE)
- 28 Tenant-Leaning
- State Washington
- 28 Tenant-Leaning · D+8
- County
- — inherits STATE
- City
- — inherits STATE
ZIP-level market 98841
- Active inventory
- 105
- Price-to-rent
- 8.2×
Monthly cashflow live
- Estimated rent
- $1,651 medium interval (Pro) →
- Mortgage (P&I)
- −$850
- Tax from tax record
- −$171 /mo · $2,048/yr
- Insurance
- −$68
- HOA
- −$0
- Vacancy / Maint / Mgmt
- −$347
- Net cashflow
- $216
Break-even live
UW: 25.0% down · 7.5% · 30yr · 1.5% tax · 5.0% vac · 8.0% maint · 8.0% mgmt
Financing live
Cash to close
- Down payment
- $40,500
- Closing costs
- $4,860
- Reserves months
- —
- Total cash needed
- —
Loan-product check · same deal, 3 products live
Conventional
25% down · 7.5% · 30yr
- Down + closing
- —
- Monthly P&I
- —
- Monthly cashflow
- —
- DSCR
- —
- Eligible?
- —
Personal DTI + credit; lowest rate.
DSCR
20% down · 8.5% · 30yr
- Down + closing
- —
- Monthly P&I
- —
- Monthly cashflow
- —
- DSCR
- —
- Eligible?
- —
No personal income docs; deal must DSCR.
Hard money
10% down · 12.0% · 12mo
- Down + closing
- —
- Monthly P&I
- —
- Monthly cashflow
- —
- DSCR
- —
- Eligible?
- —
Short-term bridge; refi at stabilization.
Listing history 24 events
-
2026-06-12statusdays on market $162,000 Pending 115 DOM
-
2026-06-09days on market $162,000 Active 113 DOM
-
2026-06-08days on market $162,000 Active 112 DOM
-
2026-06-08days on market $162,000 Active 111 DOM
-
2026-06-07days on market $162,000 Active 110 DOM
-
2026-06-03days on market $162,000 Active 107 DOM
-
2026-06-02days on market $162,000 Active 106 DOM
-
2026-06-01days on market $162,000 Active 105 DOM
-
2026-05-31days on market $162,000 Active 104 DOM
-
2026-05-05price $162,000
-
2026-04-14status Active
-
2026-04-09status Active
-
2026-04-04status Pending
-
2026-02-26price $177,500
-
2026-02-10price $190,900
-
2026-02-08$190,000 Active
-
2014-09-15historical
-
2014-09-12soldstatus $155,000 Sold
-
2014-09-12soldstatus $155,000
-
2013-10-03status Pending Inspection
-
2012-06-05price $159,900
-
2011-08-22price $169,900
-
2011-05-24price $175,900
-
2010-08-04$186,900 Active
ⓘ Source: listings_history table (triggers on properties + properties_extension) + one-shot
backfill from property_details.listing_events for pre-trigger history.
Tax reassessment forecast WA · Resets to sale price
- Current annual tax
- $2,048 · $171/mo
- Projected year-2 tax
- $2,048 · $171/mo
- Expected delta
- $0/yr ($0/mo · -0.0%)
ⓘ Screening estimate from a state-policy table — verify with the county assessor before closing.
Climate risk First Street
- Flood 1/10 Low FEMA zone X · 0% chance over 30 yrs
- Wildfire 9/10 Extreme
- Heat 5/10 Major 7 d/yr ≥97°F today · 15 d/yr by 30 yrs out
- Wind 1/10 Low
- Air quality 10/10 Extreme 23 unhealthy d/yr today · 27 by 30 yrs out
Nearby sold comps map
Loading sold comps map…
Walkable amenities ~0.75 mi
Loading nearby amenities…
Taxation est. · year 1
- Rental income
- $19,809
- − Mortgage interest
- −$9,075
- − Property taxes
- −$2,048
- − Insurance
- −$810
- − Repairs & maintenance
- −$1,585
- − Management
- −$1,585
- − Depreciation
- −$4,713
- Taxable loss
- −$6
- Est. tax savings @ 24.0%
- +$1
- After-tax cash flow
- $2,598/yr
For passive investors: Depreciation is non-cash, so a rental often shows a tax loss while cash-flowing — sheltering income. Rental losses are passive: they offset passive income freely, and up to $25,000/yr can offset ordinary (W-2) income if you actively participate and your MAGI is under $100k (phasing out to $0 by $150k); unused losses carry forward. On sale, claimed depreciation is recaptured at up to 25%, and gains may owe capital-gains tax (a 1031 exchange can defer both). Figures are a year-1 estimate at your 24.0% rate — not tax advice; consult a CPA.
Schools (NCES district)
- District
- Omak School District
- NCES district ID
- 5306220
- Math proficiency
- 29% ▬ 0.00%
- Reading proficiency
- 49% ▲ 1.00%
- Median HH income
- $44,421
- Composite
- 35.56/100
- National rank
- #9729
- State rank
- #227 of 291 in WA
Livability — Omak
- Score
- 63/100
- State rank
- #386
- US rank
- #15185
Category grades
Schools grade is shown separately in the Schools card above.
Census & demographics
- Census place
- Omak, WA
- Population (ZIP)
- 9,376
Population outlook (Okanogan County) Hauer SSP2
- Today (2025)
- 40,288 people
- By 2030
- 39,265 · -2.5%
- By 2040
- 37,110 · -7.9%
- By 2050
- 35,389 · -12.2%
- By 2075
- 31,609 · -21.5%
- By 2100
- 26,647 · -33.9%
Race, ethnicity, and origin ACS 2023
- Neighborhood character
- Predominantly White (65%)
- Race & ethnicity
- White 65% Hispanic / Latino 16% Two or more races 16% Native American 14%
- Hispanic origin (detail)
- Mexican 14% Puerto Rican 1%
- Common ancestry
- Portuguese 4% Slovak 3% Lithuanian 2%
- Foreign-born
- 6% · Canada
- Languages at home
- 91% English-only · Spanish 8%
Political lean MEDSL · Okanogan
- 2024 margin
- R (+15.0) · D 41.1% · R 56.0% · Other 2.9%
- 2008→2024 swing
- -8.0pp toward R · 2008: -7.0pp · 2024: -15.0pp
- All cycles
- 2024: R+15.0 2020: R+13.8 2016: R+21.3 2012: R+14.8 2008: R+7.0
Not yet ingested
- Civics
- —
Market trends
- HPI YoY
- ▼ -144.79%
- Current HPI
- 190.8789
- Rent YoY
- —
- Metro
- —
- State GDP YoY
- ▲ 4.65%
- F500 in state
- 22
Industry mix (Fortune 500 HQ in WA)
| Industry | F500 HQs | Revenue |
|---|---|---|
| Retail | 2 | $269B |
|
||
| Technology / Retail | 1 | $638B |
|
||
| Technology | 1 | $245B |
|
||
| Telecommunications | 1 | $38B |
|
||
| Food / Beverage | 1 | $36B |
|
||
| Automotive / Trucks | 1 | $34B |
|
||
Price history
-13.3% since first listed15 events — show timeline
- 2026-05-05 Price Changed $162,000 NWMLS as Distributed by MLS Grid
- 2026-04-14 Relisted — NWMLS as Distributed by MLS Grid
- 2026-04-09 Relisted — NWMLS as Distributed by MLS Grid
- 2026-04-04 Pending — NWMLS as Distributed by MLS Grid
- 2026-02-26 Price Changed $177,500 NWMLS as Distributed by MLS Grid
- 2026-02-10 Price Changed $190,900 NWMLS as Distributed by MLS Grid
- 2026-02-08 Listed $190,000 NWMLS as Distributed by MLS Grid
- 2014-09-15 Delisted — NWMLS as Distributed by MLS Grid
- 2014-09-12 Sold (Public Records) $155,000 Public Records
- 2014-09-12 Sold (MLS) $155,000 NWMLS as Distributed by MLS Grid
- 2013-10-03 Pending — NWMLS as Distributed by MLS Grid
- 2012-06-05 Price Changed $159,900 NWMLS as Distributed by MLS Grid
- 2011-08-22 Price Changed $169,900 NWMLS as Distributed by MLS Grid
- 2011-05-24 Price Changed $175,900 NWMLS as Distributed by MLS Grid
- 2010-08-04 Listed $186,900 NWMLS as Distributed by MLS Grid
Property tax history
+4.2%/yrLatest (2026): $2,048 · -7.9% YoY. Source: county tax records.
Cash-flow waterfall
monthlySold comps — $/sqft
last 12 mo · ≤1 miLoading sold comps…