8760 County Road 127 · Glen St. Mary, FL
Flood risk 1/10 · Minimal
- FEMA flood zone
- X (unshaded)
- Chance of flooding over 30 yrs
- 0.0%
- Est. flood insurance / yr
- $507 – $1,088
Fire risk 10/10 · Severe
- Est. fire insurance / yr
- $947 – $1,759
Heat risk 8/10 · Major
- Hot days now (above 107°F)
- 7 days/yr
- Hot days in 30 yrs
- 20 days/yr
Wind risk 9/10 · Severe
- Chance of severe wind over 30 yrs
- 99.0%
Air-quality risk 6/10 · Moderate
- Unhealthy air days now
- 8 days/yr
- Unhealthy air days in 30 yrs
- 11 days/yr
Risk factors via First Street. Map © Google.
Why this score? — see what drove the B+ grade
The composite is a weighted blend of 9 inputs, each scored 0–100. Each bar is that input's sub-score; the figure is the points it added to the 100-point composite (weight × sub-score).
- Cash flow +30.0/30.0
- 1% rule +10.0/10.0
- DSCR +10.0/10.0
- Appreciation +9.7/10.0
- ARV discount +7.5/15.0
- Schools +4.4/10.0
- Rent growth +2.5/5.0
- Livability +2.5/5.0
- Condition / age +2.5/5.0
$70,000
🖨 Deal sheet (PDF) 📄 Offer letter ✓ Due diligence
Listing remarks
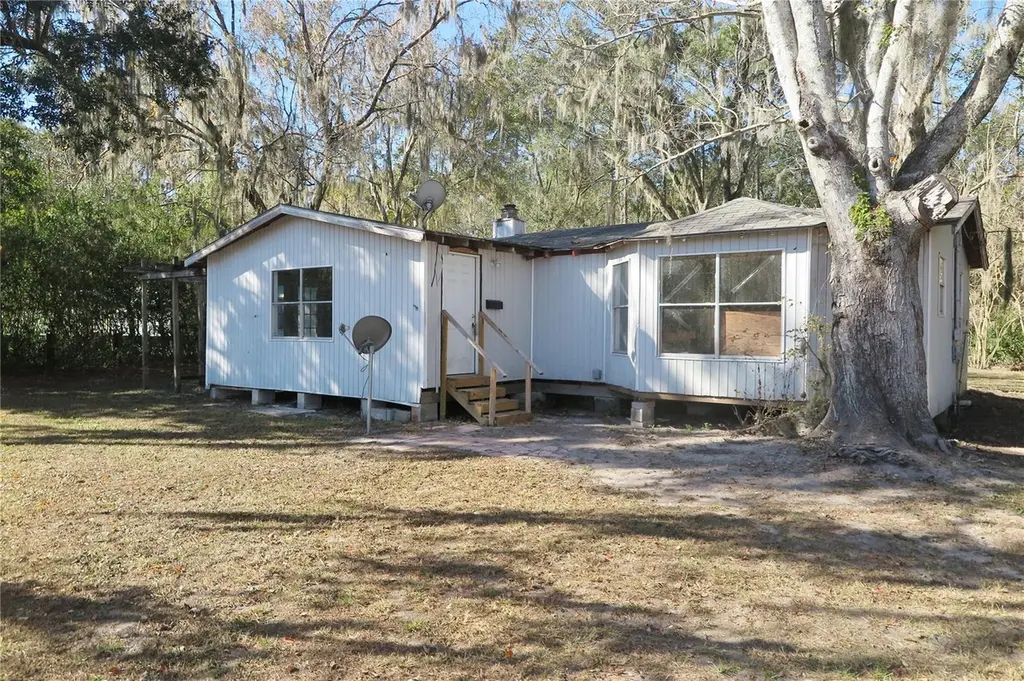
This ranch-style home offers solid bones and potential on a spacious lot. This three-bedroom, two-bathroom home presents a compelling investment opportunity for those seeking to create value through renovation. The property sits on a solid foundation with good structural bones, offering the potential to transform it into something special with the right vision and improvements. The home's current condition allows for customization to personal preferences while building equity through strategic updates and enhancements. Schedule your showing today to explore this ranch home's potential and spacious layout.
Key facts
- Ranch home
- Solid foundation
- Spacious lot
Tags
Property features AI
Finance
- Other: Property type: Residential (Single Family Residence); Zoning: SFR; Property on 1 to less than 2 acres; Furnished: Unfurnished
- Financial info: Tax information available (not included per instructions)
- HOA & community: No HOA / no community association
Exterior
- Parking: No parking details provided
- Security: No security features listed
- Utilities: Well water; Septic tank; Electricity connected
- Home design: Single family residence; One story; Faces southeast
- Construction: Frame construction; Shingle roof; Crawlspace foundation; Built area approximately 1,321 (building area) / 1,414 living area (public records)
- Exterior features: Asphalt road access; 1.5-acre lot
Interior
- Kitchen: Other appliances listed
- Bedrooms: 3 bedrooms
- Flooring: Other flooring
- Bathrooms: 2 full bathrooms
- Heating & cooling: Electric heating; Central air conditioning
- Interior features: Fireplace in the living room; No additional interior features listed
- Laundry & utility: Laundry features: Other
Neighborhood map
What this means for you Summary
Snapshot
- This is a 3-bed/2.0-bath single-family listed at $70k.
Deal economics
- At list price, monthly cash flow is $484 ($6k/yr) — positive.
- The deal already cash-flows at list — no discount required.
- Meets the 1% rule at list price ($1k rent vs $70k).
- Recommended offer: $66k (6.0% below list) — sets the bar for market timing.
- Cap rate 14.6% vs local median 3.0% in Glen St. Mary — top-decile yield for the area; either an underpriced asset or a hidden risk that comps aren't pricing in. Stress-test before assuming the spread holds.
Location & tenants
- Location reads: area grade B — affects rentability + tenant quality, not the cash-flow math above.
- Baker (town): math 53% / reading 49% proficiency, ranked #28 of 73 in FL (top 38%) — acceptable for families but not a draw, mixed tenant base, ~2y average lease.
- Market conditions: 25 active listings in the ZIP; 99 units permitted in Baker County in 2024 (0 in 5+ unit buildings).
Forward outlook
- In year one you build about $7k of equity ($484 loan paydown + $7k appreciation (9.4% local appreciation)).
- Baker County population projected to shrink 9% by 2050 — rents likely to lag national; underwrite the cash flow, not the appreciation.
- At projected returns (9.4% appreciation + 3.0% rent growth), your $20k cash investment doubles in ~2 years — after that, you're playing with house money.
- By year 5, paydown + projected appreciation supports a ~$33k cash-out refi (75% LTV) — recoverable capital for the next deal without selling this one.
Negotiation context
- It's been on market 86 days — a 6% lower offer ($66k) is reasonable based on typical stale-listing flexibility.
Risks & watch-outs
- Climate carrying-cost: severe wind risk, 99% chance of damaging wind over 30y; severe wildfire risk; extreme-heat days projected 7→20/yr by 2055 (HVAC capex compounding) — expect insurance premiums to compound above CPI over the hold.
Questions for the listing agent
- It's been on market 86 days. Have you received any prior offers? Is the seller open to a 6% concession, seller financing, or rate buy-down credit?
- Built in 1960 — when were the roof, HVAC, electrical panel, plumbing, and water heater last replaced?
- Why hasn't it sold? Are there any deal-killer items the seller is aware of (foundation, flood, title, zoning, code violations)?
- Is there a deadline driving the sale (1031 exchange, divorce, estate, relocation)? That informs how much negotiation room exists.
- What's the average days-on-market for RENTAL listings here right now (not sales)? A rising rental-DOM trend means longer vacancies and softer asking-rent achievability than the comps imply.
- What's the recent tenant-quality profile in this submarket — average credit score on applications, eviction rate, late-payment / NSF rate, and stable-employment percentage? A property-management company in the area should have these aggregated.
- How much new for-sale + rental construction is in the pipeline within 1–3 miles? Heavy new supply typically softens prices + rents 12–24 months out; constrained supply supports both.
Investment metrics
- 1% rule
- 1.71% ✓
- Cap rate
- 14.59%
- Cash-on-cash
- 29.65%
- DSCR
- 2.32
- GRM
- 4.9
CMA / ARV
No comps found within radius.
Projected returns pro-forma
9.44% appreciation · 3.0% rent growth · sell at horizon
- IRR
- 45.9%
- Equity multiple
- 4.38×
- Total profit
- $66,312
- Equity at exit
- $60,236
- IRR
- 40.2%
- Equity multiple
- 9.69×
- Total profit
- $170,406
- Equity at exit
- $127,006
Cash invested: $19,600 (down + closing). Projections, not guarantees.
Landlord ↔ Tenant lean methodology
- Overall (STATE)
- 87 Strongly Landlord-Friendly
- State Florida
- 87 Strongly Landlord-Friendly · R+3
- County
- — inherits STATE
- City
- — inherits STATE
ZIP-level market 32087
- Home prices YoY
- 4.9%
- Active inventory
- 25
- Price-to-rent
- 4.9×
Monthly cashflow live
- Estimated rent
- $1,197 medium interval (Pro) →
- Mortgage (P&I)
- −$367
- Tax from tax record
- −$65 /mo · $779/yr
- Insurance
- −$29
- HOA
- −$0
- Vacancy / Maint / Mgmt
- −$251
- Net cashflow
- $484
Break-even live
Sensitivity live
| Price | -10% $524 | -5% $504 | +0% $484 | +5% $464 | +10% $445 |
|---|---|---|---|---|---|
| Rent | -10% $390 | -5% $437 | +0% $484 | +5% $531 | +10% $579 |
| Rate | -1.0pp $519 | -0.5pp $502 | base $484 | +0.5pp $466 | +1.0pp $448 |
UW: 25.0% down · 7.5% · 30yr · 1.5% tax · 5.0% vac · 8.0% maint · 8.0% mgmt
Financing live
Cash to close
- Down payment
- $17,500
- Closing costs
- $2,100
- Reserves months
- —
- Total cash needed
- —
Loan-product check · same deal, 3 products live
Conventional
25% down · 7.5% · 30yr
- Down + closing
- —
- Monthly P&I
- —
- Monthly cashflow
- —
- DSCR
- —
- Eligible?
- —
Personal DTI + credit; lowest rate.
DSCR
20% down · 8.5% · 30yr
- Down + closing
- —
- Monthly P&I
- —
- Monthly cashflow
- —
- DSCR
- —
- Eligible?
- —
No personal income docs; deal must DSCR.
Hard money
10% down · 12.0% · 12mo
- Down + closing
- —
- Monthly P&I
- —
- Monthly cashflow
- —
- DSCR
- —
- Eligible?
- —
Short-term bridge; refi at stabilization.
Listing history 19 events
-
2026-06-19days on market $70,000 Active 86 DOM
-
2026-06-18days on market $70,000 Active 85 DOM
-
2026-06-17days on market $70,000 Active 84 DOM
-
2026-06-17price $70,000 Active 83 DOM
-
2026-06-16days on market $75,000 Active 83 DOM
-
2026-06-15days on market $75,000 Active 82 DOM
-
2026-06-14days on market $75,000 Active 80 DOM
-
2026-06-12days on market $75,000 Active 79 DOM
-
2026-06-09days on market $75,000 Active 76 DOM
-
2026-06-08days on market $75,000 Active 75 DOM
-
2026-06-07days on market $75,000 Active 74 DOM
-
2026-06-05days on market $75,000 Active 71 DOM
-
2026-06-02days on market $75,000 Active 69 DOM
-
2026-06-01days on market $75,000 Active 68 DOM
-
2026-05-31days on market $75,000 Active 67 DOM
-
2026-05-30days on market $75,000 Active 66 DOM
-
2026-05-13price $75,000
-
2026-04-14price $77,500
-
2026-03-25$80,000 Active
ⓘ Source: listings_history table (triggers on properties + properties_extension) + one-shot
backfill from property_details.listing_events for pre-trigger history.
Tax reassessment forecast FL · Resets to sale price
- Current annual tax
- $779 · $65/mo
- Projected year-2 tax
- $779 · $65/mo
- Expected delta
- $0/yr ($0/mo · 0.0%)
ⓘ Screening estimate from a state-policy table — verify with the county assessor before closing.
Climate risk First Street
- Flood 1/10 Low FEMA zone X (unshaded) · 0% chance over 30 yrs
- Wildfire 10/10 Extreme
- Heat 8/10 Severe 7 d/yr ≥107°F today · 20 d/yr by 30 yrs out
- Wind 9/10 Extreme 99% chance of damaging wind over 30 yrs
- Air quality 6/10 Major 8 unhealthy d/yr today · 11 by 30 yrs out
Nearby sold comps map
Loading sold comps map…
Walkable amenities ~0.75 mi
Loading nearby amenities…
Taxation est. · year 1
- Rental income
- $14,361
- − Mortgage interest
- −$3,921
- − Property taxes
- −$779
- − Insurance
- −$350
- − Repairs & maintenance
- −$1,149
- − Management
- −$1,149
- − Depreciation
- −$2,036
- Taxable income
- $4,976
- Est. tax owed @ 24.0%
- −$1,194
- After-tax cash flow
- $4,616/yr
For passive investors: Depreciation is non-cash, so a rental often shows a tax loss while cash-flowing — sheltering income. Rental losses are passive: they offset passive income freely, and up to $25,000/yr can offset ordinary (W-2) income if you actively participate and your MAGI is under $100k (phasing out to $0 by $150k); unused losses carry forward. On sale, claimed depreciation is recaptured at up to 25%, and gains may owe capital-gains tax (a 1031 exchange can defer both). Figures are a year-1 estimate at your 24.0% rate — not tax advice; consult a CPA.
Schools (NCES district)
- District
- Baker
- NCES district ID
- 1200060
- Math proficiency
- 53% ▼ -6.00%
- Reading proficiency
- 49% ▼ -3.00%
- Median HH income
- $50,301
- Composite
- 43.67/100
- National rank
- #2958
- State rank
- #28 of 73 in FL
Livability — Glen St. Mary
No livability data for this city. (Only ~50 U.S. cities are tracked.)
Census & demographics
- Population (ZIP)
- 4,718
Population outlook (Baker County) Hauer SSP2
- Today (2025)
- 27,607 people
- By 2030
- 27,452 · -0.6%
- By 2040
- 26,637 · -3.5%
- By 2050
- 25,103 · -9.1%
- By 2075
- 19,576 · -29.1%
- By 2100
- 11,664 · -57.7%
Race, ethnicity, and origin ACS 2023
- Neighborhood character
- Majority White (64%)
- Race & ethnicity
- White 64% Black 26% Two or more races 8% Hispanic / Latino 3%
- Common ancestry
- Iranian 3% Romanian 1% Italian 1%
- Foreign-born
- 2% · Canada
- Languages at home
- 95% English-only · Spanish 4% Other Asian/Pacific 1%
Political lean MEDSL · Baker
- 2024 margin
- Solid R (+73.1) · D 13.2% · R 86.3%
- 2008→2024 swing
- -15.7pp toward R · 2008: -57.4pp · 2024: -73.1pp
- All cycles
- 2024: R+73.1 2020: R+70.2 2016: R+64.8 2012: R+58.6 2008: R+57.4
Not yet ingested
- Civics
- —
Market trends
- HPI YoY
- ▲ 9.44%
- Current HPI
- 202.0625
- Rent YoY
- —
- Metro
- —
- State GDP YoY
- ▲ 3.28%
- F500 in state
- 36
Industry mix (Fortune 500 HQ in FL)
| Industry | F500 HQs | Revenue |
|---|---|---|
| Industrial Technology | 2 | $29B |
|
||
| Insurance | 2 | $17B |
|
||
| Retail | 1 | $60B |
|
||
| Technology Distribution | 1 | $58B |
|
||
| Homebuilding | 1 | $35B |
|
||
| Technology Manufacturing | 1 | $35B |
|
||
Price history
-6.2% since first listed3 events — show timeline
- 2026-05-13 Price Changed $75,000 Stellar MLS as Distributed by MLS Grid
- 2026-04-14 Price Changed $77,500 Stellar MLS as Distributed by MLS Grid
- 2026-03-25 Listed $80,000 Stellar MLS as Distributed by MLS Grid
Property tax history
+12.8%/yrLatest (2025): $779 · +4.5% YoY. Source: county tax records.
Cash-flow waterfall
monthlySold comps — $/sqft
last 12 mo · ≤1 miLoading sold comps…