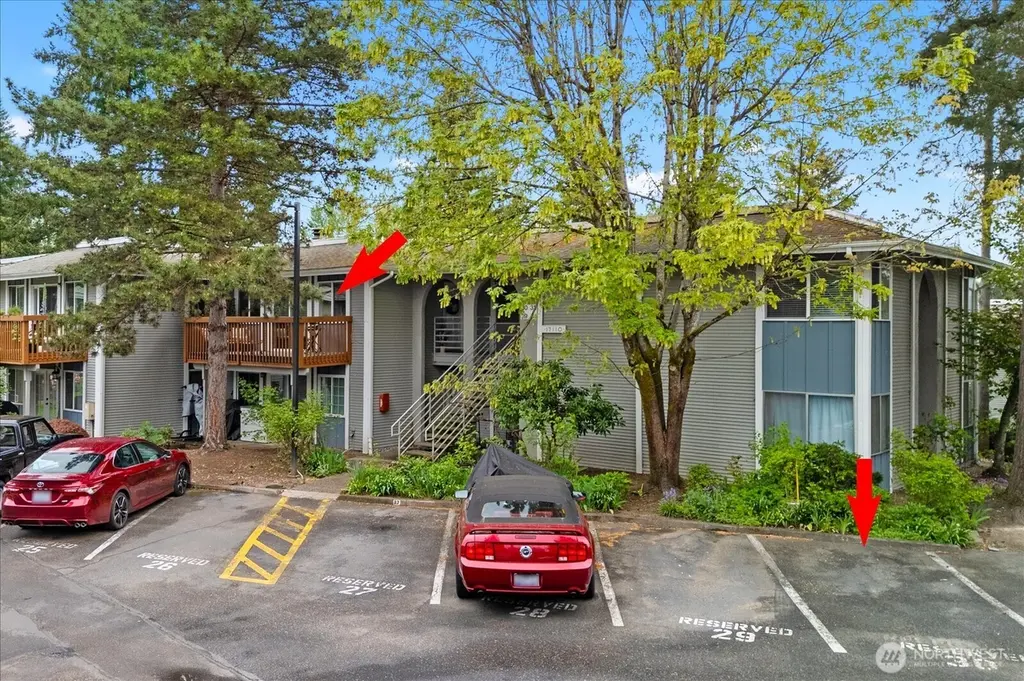
17110 NE 45th St #30 · Redmond, WA
Flood risk 5/10 · Moderate
- FEMA flood zone
- X (unshaded)
- Chance of flooding over 30 yrs
- 0.24%
- Est. flood insurance / yr
- $507 – $1,088
Fire risk 1/10 · Minimal
- Est. fire insurance / yr
- $604 – $1,122
Heat risk 3/10 · Minor
- Hot days now (above 87°F)
- 7 days/yr
- Hot days in 30 yrs
- 15 days/yr
Wind risk 1/10 · Minimal
- Chance of severe wind over 30 yrs
- —
Air-quality risk 7/10 · Major
- Unhealthy air days now
- 9 days/yr
- Unhealthy air days in 30 yrs
- 11 days/yr
Risk factors via First Street. Map © Google.
Why this score? — see what drove the D grade
The composite is a weighted blend of 9 inputs, each scored 0–100. Each bar is that input's sub-score; the figure is the points it added to the 100-point composite (weight × sub-score).
- ARV discount +15.0/15.0
- Schools +7.5/10.0
- Cash flow +6.0/30.0
- Livability +4.4/5.0
- Rent growth +2.7/5.0
- 1% rule +2.6/10.0
- Condition / age +2.5/5.0
- DSCR +0.4/10.0
- Appreciation +0.0/10.0
$298,000
🖨 Deal sheet (PDF) 📄 Offer letter ✓ Due diligence
Listing remarks
Don’t miss this fantastic second-floor condo offering lakeside living, exceptional amenities, and an unbeatable location. Enjoy direct access to Lake Sammamish with a private boat launch and a stunning waterfront clubhouse perched over the water—perfect for relaxing, entertaining, or meeting friends at the dock, pool, or hot tub. Inside, the condo features a bright, spacious bedroom, a full bath, generous storage and a comfortable deck ideal for outdoor enjoyment. Perfectly situated for an active lifestyle, you’re minutes from Marymoor Park, Idylwood Beach Park, Crossroads Park, and just 1.5 miles from Microsoft. Pet-friendly with no rental cap, this community offers both
Key facts
- Waterfront clubhouse
- Pet-friendly
- Lakeside living
Tags
Property features AI
Finance
- Other: Top floor unit in a 4-unit building within a 185-unit community; Community waterfront / private beach access; Bus line nearby
- Financial info: Listing eligible for Cash and Conventional terms
- HOA & community: Monthly HOA fee (includes central hot water, common area maintenance, lawn service, road maintenance, sewer, trash, water); Community amenities: athletic court, clubhouse, dock, game/rec room, high-speed internet availability, laundry room, outside entry, outdoor pool, trails; Pets allowed
Exterior
- Parking: Uncovered open parking (1 space) — assigned space 30
- Security: Fire sprinklers in community
- Utilities: Electric power; Water provided by HOA; Sewer provided by HOA; Power by Puget Sound Energy
- Home design: Attached condominium; One level (condo on top floor); Main entry level
- Construction: Wood construction; Composition roof
- Exterior features: Wood exterior; Paved access
Interior
- Kitchen: Dishwasher, Refrigerator, Stove/Range
- Bedrooms: 1 bedroom (main level)
- Flooring: Ceramic tile; Vinyl; Carpet
- Bathrooms: 1 full bathroom with tub and shower
- Heating & cooling: Baseboard heating; No central cooling
- Interior features: Dishwasher, Refrigerator, Stove/Range; Ceramic tile, Vinyl, Carpet flooring
- Laundry & utility: Community laundry room available
Neighborhood map
What this means for you Summary
Snapshot
- This is a 1-bed/1.0-bath condo listed at $298k.
Deal economics
- At list price, monthly cash flow is $-566 ($-7k/yr) — negative.
- To cash-flow at today's rent, offer at most $198k (33.6% below list).
- To meet the 1% rule (rent ≥ 1% of price), the offer needs to be $226k (24.1% below list).
- Recommended offer: $198k (33.6% below list) — sets the bar for cash-flow.
- Cap rate 4.0% vs local median 1.4% in Redmond — top-decile yield for the area; either an underpriced asset or a hidden risk that comps aren't pricing in. Stress-test before assuming the spread holds.
Location & tenants
- Location reads 88/100 on livability (#10 in WA, #186 nationally) — a professional / high-income tenant draw. Strengths: amenities A+, commute A+, employment A+; Watch: cost of living F.
- Lake Washington School District (suburban): math 79% / reading 85% proficiency, ranked #3 of 291 in WA (top 1%) — strong family-tenant draw, lease renewals of 3-5y typical; only 10% free/reduced lunch — higher-income household profile.
- Zoned schools: John J. Audubon Elementary (517 students, 9% FRL); Redmond High School (2,218 students, 15% FRL) — zoned schools at 12% FRL track the district average.
- Market conditions: Rents flat; 337 active listings in the ZIP; 23 comparable units currently listed for rent nearby; rentals leasing fast (median 6d on market — plan ~1-2 weeks tenant-placement turnaround); high-income renter base; 10,555 units permitted in King County in 2024 (7,119 in 5+ unit buildings).
- This rent is only 17% of the median local income ($163k/yr) — well below the 30% rent-burden line; pricing power to push rent on renewal without tenant pushback.
Forward outlook
- Local home prices are declining (-3.0%/yr); year-one equity from $2k of loan paydown is wiped out by about $9k of value loss. Plan a longer hold.
- King County population projected at +44% by 2050 — long-run rental-demand tailwind backs the buy-and-hold thesis.
Negotiation context
- Only 12 days on market — expect competitive offers; lowballing is unlikely to land.
- 5 sale attempts with the ask held roughly flat each time — persistent listings suggest the price (not the market) is what's stuck; bring a comps-based counter.
- Current owner paid $90k; list at $298k implies a 231% gain — meaningful room to come down on a strong offer.
Risks & watch-outs
- Climate carrying-cost: moderate flood risk — expect insurance premiums to compound above CPI over the hold.
Questions for the listing agent
- What do current leases actually rent for vs. the listed asking? Can we see a recent rent roll and the last 12 months of T-12 income?
- Built in 1968 — when were the roof, HVAC, electrical panel, plumbing, and water heater last replaced?
- What does the HOA fee cover, when was the last increase, and are there any pending special assessments or reserve-fund shortfalls?
- Any open or pending special assessments — roof, HVAC, plumbing, elevator, façade? What's the per-unit balance and payoff schedule, and is the seller paying it off at close or rolling it to the buyer?
- Is there a deadline driving the sale (1031 exchange, divorce, estate, relocation)? That informs how much negotiation room exists.
- Schools are A-rated — typically a magnet for longer-tenancy family renters. What's the average tenant stay here, and is there a school-zone premium baked into asking?
- The area grade is low — what's the realistic commute time and amenity access for the typical tenant pool here? Any planned neighborhood developments (good or bad) we should know about?
- What's the average days-on-market for RENTAL listings here right now (not sales)? A rising rental-DOM trend means longer vacancies and softer asking-rent achievability than the comps imply.
- What's the recent tenant-quality profile in this submarket — average credit score on applications, eviction rate, late-payment / NSF rate, and stable-employment percentage? A property-management company in the area should have these aggregated.
- How much new apartment / multifamily construction is in the pipeline within 1–3 miles? Heavy new supply (>2% of stock underway) typically softens rents 12–24 months out; light construction supports rent growth.
Investment metrics
- 1% rule
- 0.76% ✗
- Cap rate
- 4.01%
- Cash-on-cash
- -8.14%
- DSCR
- 0.64
- GRM
- 11.0
CMA / ARV
- ARV (median comp)
- $360,444
- List price
- $298,000
- Delta
- -9.83%
- Verdict
- FAIR
- Comps
- 20 within 1.0 mi
Projected returns pro-forma
-3.0% appreciation · 0.65% rent growth · sell at horizon
- IRR
- -33.6%
- Equity multiple
- -0.07×
- Total profit
- $-89,349
- Equity at exit
- $44,433
- IRR
- -61.9%
- Equity multiple
- -0.72×
- Total profit
- $-143,809
- Equity at exit
- $25,766
Cash invested: $83,440 (down + closing). Projections, not guarantees.
Landlord ↔ Tenant lean methodology
- Overall (STATE)
- 28 Tenant-Leaning
- State Washington
- 28 Tenant-Leaning · D+8
- County
- — inherits STATE
- City
- — inherits STATE
ZIP-level market 98052
- Rents YoY
- 0.7%
- Active inventory
- 337
- Price-to-rent
- 11.0×
Monthly cashflow live
- Estimated rent
- $2,262 high interval (Pro) →
- Mortgage (P&I)
- −$1,563
- Tax from tax record
- −$219 /mo · $2,632/yr
- Insurance
- −$124
- HOA
- −$447
- Vacancy / Maint / Mgmt
- −$475
- Net cashflow
- $-566
Break-even live
Sensitivity live
| Price | -10% $-397 | -5% $-482 | +0% $-566 | +5% $-650 | +10% $-735 |
|---|---|---|---|---|---|
| Rent | -10% $-745 | -5% $-655 | +0% $-566 | +5% $-477 | +10% $-387 |
| Rate | -1.0pp $-416 | -0.5pp $-490 | base $-566 | +0.5pp $-643 | +1.0pp $-722 |
UW: 25.0% down · 7.5% · 30yr · 1.5% tax · 5.0% vac · 8.0% maint · 8.0% mgmt
Financing live
Cash to close
- Down payment
- $74,500
- Closing costs
- $8,940
- Reserves months
- —
- Total cash needed
- —
Loan-product check · same deal, 3 products live
Conventional
25% down · 7.5% · 30yr
- Down + closing
- —
- Monthly P&I
- —
- Monthly cashflow
- —
- DSCR
- —
- Eligible?
- —
Personal DTI + credit; lowest rate.
DSCR
20% down · 8.5% · 30yr
- Down + closing
- —
- Monthly P&I
- —
- Monthly cashflow
- —
- DSCR
- —
- Eligible?
- —
No personal income docs; deal must DSCR.
Hard money
10% down · 12.0% · 12mo
- Down + closing
- —
- Monthly P&I
- —
- Monthly cashflow
- —
- DSCR
- —
- Eligible?
- —
Short-term bridge; refi at stabilization.
Rent comps 23 comps
| Address | Beds | Baths | Sqft | Rent | $/sqft | DOM | Units | Dist |
|---|---|---|---|---|---|---|---|---|
| 17112 NE 45th St #55 Redmond, WA | 2.0 | 2.0 | 974 | $2,885 | $2.96 | 15d | 1 | 0.02mi |
| 17106 NE 45th St #10 Redmond, WA | 1.0 | 1.0 | 767 | $1,799 | $2.35 | 44d | 1 | 0.04mi |
| 17108 NE 45th St Redmond, WA | 2.0 | 2.0 | 974 | $2,500 | $2.57 | 25d | 1 | 0.04mi |
| 17301 NE 45th St #88 Redmond, WA | 1.0 | 1.0 | 712 | $2,300 | $3.23 | 44d | 1 | 0.07mi |
| 4250 W Lake Sammamish Pkwy NE Redmond, WA | 1.0–2.0 | 1.0–2.0 | 825 | $2,065 | $2.50 | 3d | 10 | 0.16mi |
| 3834 175th Ave NE #23 Redmond, WA | 1.0 | 1.0 | 650 | $3,000 | $4.62 | 44d | 1 | 0.47mi |
| 16539 NE 35th Ct Redmond, WA | 1.0–3.0 | 1.0–2.0 | 818 | $1,979 | $2.42 | 0d | 11 | 0.64mi |
| 15606 NE 40th St Redmond, WA | 1.0–3.0 | 1.0–2.0 | 964 | $1,992 | $2.07 | 3d | 1 | 0.88mi |
| 15606 NE 40th St Bldg Z Redmond, WA | 1.0 | 1.0 | 664 | $3,120 | $4.70 | 21d | 1 | 0.98mi |
| 6335 180th Pl NE Redmond, WA | 2.0 | 1.0–2.0 | 775 | $2,820 | $3.64 | 2d | 8 | 1.01mi |
| 17305 NE 67th Ct Redmond, WA | 1.0–2.0 | 1.0–2.0 | 858 | $2,140 | $2.49 | 5d | 15 | 1.01mi |
| 5985 185th Ct NE Unit 1-101 Redmond, WA | 2.0 | 1.0 | 941 | $2,450 | $2.60 | 44d | 1 | 1.04mi |
| 15602 NE 40th St Redmond, WA | 3.0 | 1.0–2.0 | 935 | $2,738 | $2.93 | 0d | 1 | 1.04mi |
| 6180 E Lake Sammamish Pkwy NE Redmond, WA | 2.0 | 1.0–2.0 | 899 | $3,046 | $3.39 | 3d | 4 | 1.04mi |
| 17565 NE 67th Ct Redmond, WA | 1.0–2.0 | 1.0–2.0 | 850 | $2,326 | $2.73 | 5d | 9 | 1.06mi |
| 6332 E Lake Sammamish Pkwy NE Redmond, WA | 1.0–3.0 | 1.0–2.0 | 1079 | $2,091 | $1.94 | 3d | 13 | 1.09mi |
| 17620 NE 69th Ct Redmond, WA | 1.0–3.0 | 1.0–2.0 | 994 | $2,120 | $2.13 | 5d | 20 | 1.19mi |
| 17645 NE 69th Ct Unit 1009 Redmond, WA | 1.0 | 1.0 | 641 | $1,820 | $2.84 | 44d | 1 | 1.19mi |
| 6110 186th Pl NE Redmond, WA | 1.0–2.0 | 1.0–2.0 | 812 | $1,989 | $2.45 | 2d | 14 | 1.20mi |
| 18666 Redmond Way Redmond, WA | 1.0–2.0 | 1.0–2.0 | 805 | $1,889 | $2.35 | 2d | 16 | 1.23mi |
| 6205 188th Ln NE Redmond, WA | 1.0–3.0 | 1.0–2.0 | 1042 | $2,190 | $2.10 | 2d | 11 | 1.35mi |
| 7405 168th Ave NE Redmond, WA | 2.0 | 1.0–2.0 | 984 | $3,244 | $3.30 | 5d | 8 | 1.44mi |
| 15551 NE Turing St Redmond, WA | 2.0 | 1.0–2.0 | 868 | $2,726 | $3.14 | 0d | 34 | 1.47mi |
HOA detail condo
- Monthly dues
- $447 · $5,364/yr
- Likely covers
- waterpool
- Assessments
- None detected in remarks — confirm with the listing agent.
Listing history 27 events
-
2026-06-21days on market $298,000 Active 12 DOM
-
2026-06-18days on market $298,000 Active 9 DOM
-
2026-06-17days on market $298,000 Active 8 DOM
-
2026-06-16days on market $298,000 Active 7 DOM
-
2026-06-15days on market $298,000 Active 6 DOM
-
2026-06-13days on market $298,000 Active 4 DOM
-
2026-06-10pricedays on market $298,000 Active 1 DOM
-
2026-06-09days on market $325,000 Active 32 DOM
-
2026-06-08days on market $325,000 Active 31 DOM
-
2026-06-07days on market $325,000 Active 30 DOM
-
2026-06-04days on market $325,000 Active 27 DOM
-
2026-06-03days on market $325,000 Active 26 DOM
-
2026-06-02days on market $325,000 Active 25 DOM
-
2026-06-01days on market $325,000 Active 24 DOM
-
2026-05-31days on market $325,000 Active 23 DOM
-
2026-05-08$325,000 Active
-
2026-03-03historical $1,995
-
2026-03-03$1,995
-
2026-02-25historical $2,195
-
2026-02-25$2,195
-
2026-02-18historical $2,395
-
2026-02-17$2,395
-
2025-02-15historical $2,295
-
2025-01-31$2,295
-
1999-04-21soldstatus $90,000
-
1992-08-26soldstatus $51,500
-
1979-09-25soldstatus $36,000
ⓘ Source: listings_history table (triggers on properties + properties_extension) + one-shot
backfill from property_details.listing_events for pre-trigger history.
Tax reassessment forecast WA · Resets to sale price
- Current annual tax
- $2,632 · $219/mo
- Projected year-2 tax
- $2,920 · $243/mo
- Expected delta
- +$289/yr (+$24/mo · 11.0%)
ⓘ Screening estimate from a state-policy table — verify with the county assessor before closing.
Climate risk First Street
- Flood 5/10 Major FEMA zone X (unshaded) · 24% chance over 30 yrs
- Wildfire 1/10 Low
- Heat 3/10 Moderate 7 d/yr ≥87°F today · 15 d/yr by 30 yrs out
- Wind 1/10 Low
- Air quality 7/10 Severe 9 unhealthy d/yr today · 11 by 30 yrs out
Nearby sold comps map
Loading sold comps map…
Walkable amenities ~0.75 mi
Loading nearby amenities…
Taxation est. · year 1
- Rental income
- $27,148
- − Mortgage interest
- −$16,693
- − Property taxes
- −$2,632
- − Insurance
- −$1,490
- − Repairs & maintenance
- −$2,172
- − Management
- −$2,172
- − HOA
- −$5,364
- − Depreciation
- −$8,669
- Taxable loss
- −$12,043
- Est. tax savings @ 24.0%
- +$2,890
- After-tax cash flow
- $-3,901/yr
For passive investors: Depreciation is non-cash, so a rental often shows a tax loss while cash-flowing — sheltering income. Rental losses are passive: they offset passive income freely, and up to $25,000/yr can offset ordinary (W-2) income if you actively participate and your MAGI is under $100k (phasing out to $0 by $150k); unused losses carry forward. On sale, claimed depreciation is recaptured at up to 25%, and gains may owe capital-gains tax (a 1031 exchange can defer both). Figures are a year-1 estimate at your 24.0% rate — not tax advice; consult a CPA.
Schools (NCES district)
- District
- Lake Washington School District
- NCES district ID
- 5304230
- Math proficiency
- 79% ▬ 0.00%
- Reading proficiency
- 85% ▲ 1.00%
- Median HH income
- $103,849
- Composite
- 75.15/100
- National rank
- #251
- State rank
- #3 of 291 in WA
Livability — Redmond
- Score
- 88/100
- State rank
- #10
- US rank
- #186
Category grades
Schools grade is shown separately in the Schools card above.
Census & demographics
- Census place
- Redmond, WA
- County
- King County · 2,251,916 people
- City population
- 103,482
- Metro
- Seattle-Tacoma-Bellevue, WA
- Population (ZIP)
- 80,717
- Household income
- $163,460
- Rent vs Own
- Severe rent burden
- 3044.0
Population outlook (King County) Hauer SSP2
- Today (2025)
- 2,576,485 people
- By 2030
- 2,803,316 · +8.8%
- By 2040
- 3,255,921 · +26.4%
- By 2050
- 3,706,444 · +43.9%
- By 2075
- 4,746,063 · +84.2%
- By 2100
- 5,407,730 · +109.9%
Race, ethnicity, and origin ACS 2023
- Neighborhood character
- Diverse neighborhood (Simpson 0.62)
- Race & ethnicity
- White 47% Asian 38% Two or more races 7% Hispanic / Latino 7% Black 2%
- Hispanic origin (detail)
- Mexican 5%
- Common ancestry
- Portuguese 2% Italian 2% Scotch-Irish 2%
- Foreign-born
- 44% · China, Canada, South Korea
- Languages at home
- 53% English-only · Other Asian/Pacific 11% Chinese 10% Other Indo-European 10%
Political lean MEDSL · King
- 2024 margin
- Solid D (+51.7) · D 74.2% · R 22.5% · Other 3.4%
- 2008→2024 swing
- +9.6pp toward D · 2008: 42.1pp · 2024: 51.7pp
- All cycles
- 2024: D+51.7 2020: D+52.7 2016: D+50.4 2012: D+39.9 2008: D+42.1
Not yet ingested
- Civics
- —
Market trends
- HPI YoY
- ▼ -1157.66%
- Current HPI
- 434.1949
- Rent YoY
- ▲ 0.65%
- Metro
- Seattle-Tacoma-Bellevue, WA
- State GDP YoY
- ▲ 4.65%
- F500 in state
- 22
Industry mix (Fortune 500 HQ in WA)
| Industry | F500 HQs | Revenue |
|---|---|---|
| Retail | 2 | $269B |
|
||
| Technology / Retail | 1 | $638B |
|
||
| Technology | 1 | $245B |
|
||
| Telecommunications | 1 | $38B |
|
||
| Food / Beverage | 1 | $36B |
|
||
| Automotive / Trucks | 1 | $34B |
|
||
Price history
+727.8% since first listed12 events — show timeline
- 2026-06-09 Listed $298,000 NWMLS as Distributed by MLS Grid
- 2026-03-03 Rental Removed $1,995 BUILDIUM
- 2026-03-03 Listed for Rent $1,995 BUILDIUM
- 2026-02-25 Rental Removed $2,195 BUILDIUM
- 2026-02-25 Listed for Rent $2,195 BUILDIUM
- 2026-02-18 Rental Removed $2,395 BUILDIUM
- 2026-02-17 Listed for Rent $2,395 BUILDIUM
- 2025-02-15 Rental Removed $2,295 BUILDIUM
- 2025-01-31 Listed for Rent $2,295 BUILDIUM
- 1999-04-21 Sold (Public Records) $90,000 Public Records
- 1992-08-26 Sold (Public Records) $51,500 Public Records
- 1979-09-25 Sold (Public Records) $36,000 Public Records
Property tax history
+4.0%/yrLatest (2025): $2,632 · -10.8% YoY. Source: county tax records.
Cash-flow waterfall
monthlySold comps — $/sqft
last 12 mo · ≤1 miLoading sold comps…