 Triplex
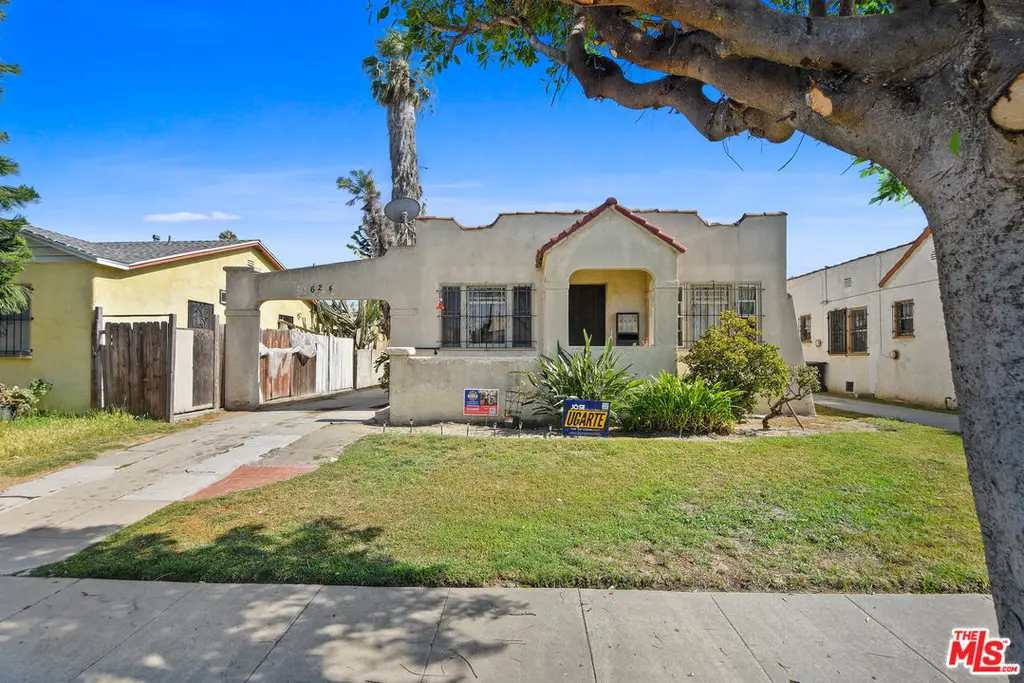
624 E 84th St · Los Angeles, CA
Flood risk 1/10 · Minimal
- FEMA flood zone
- X (unshaded)
- Chance of flooding over 30 yrs
- 0.0%
- Est. flood insurance / yr
- $507 – $1,088
Fire risk 1/10 · Minimal
- Est. fire insurance / yr
- $659 – $1,223
Heat risk 5/10 · Moderate
- Hot days now (above 90°F)
- 7 days/yr
- Hot days in 30 yrs
- 22 days/yr
Wind risk 1/10 · Minimal
- Chance of severe wind over 30 yrs
- —
Air-quality risk 5/10 · Moderate
- Unhealthy air days now
- 7 days/yr
- Unhealthy air days in 30 yrs
- 7 days/yr
Risk factors via First Street. Map © Google.
Why this score? — see what drove the D grade
The composite is a weighted blend of 9 inputs, each scored 0–100. Each bar is that input's sub-score; the figure is the points it added to the 100-point composite (weight × sub-score).
- Cash flow +15.6/30.0
- ARV discount +7.5/15.0
- DSCR +4.8/10.0
- 1% rule +4.3/10.0
- Schools +3.6/10.0
- Livability +3.4/5.0
- Rent growth +2.5/5.0
- Condition / age +2.5/5.0
- Appreciation +0.0/10.0
$850,000
🖨 Deal sheet 📄 Offer letter ✓ Due diligence
Multi-family units
County records classify this as Multi-Family (2-4 Unit). Listing-text estimate: 3 units. confirmed
Listing remarks
Investor opportunity in South Los Angeles. This tenant-occupied four-unit income property offers value-add and long-term rental upside potential. Conveniently located near the 110 Freeway, Downtown Los Angeles, public transportation, schools, shopping, and employment centers. Ownership has invested in improvements to Units 1, 2, and 4. Drive-by only please do not disturb occupants or walk the property. Buyer to independently verify all information, including unit count, permits, square footage, zoning, rents, occupancy status, and development potential. Interior inspection upon accepted offer only.
Key facts
- Value-add potential
- 5,738 sq ft lot
- 2 garage spots
Tags
Property features AI
Finance
- Other: Property sold/marketed As-Is; Termite report available
- Financial info: Actual annual gross rent reported: $30,468; Net operating income reported: $17,741; Total annual expenses reported: $12,727; Cap rate reported: 1.61; Gross rent multiplier reported: 27.9; All four units currently leased; Projected market rents listed per unit (examples): Unit 1 $2,400; Unit 2 $2,200; Unit 3 $2,200; Unit 4 $2,200
- HOA & community: Complex totals four units
Exterior
- Parking: Detached 2-car garage; Concrete driveway; Shared driveway; Uncovered parking spaces; Total of 7 parking spaces (including 5 open spaces)
- Utilities: Separate gas, electric and water meters for units (4 each); Owner pays gardener and water; Tenants pay gas, electric and cable TV
- Home design: Residential income property; Two-level building; Attached/common walls; Faces south; Zoning: LAR2
- Construction: Frame and stucco exterior construction; Composition roof; Concrete perimeter foundation; Two buildings on the lot
- Exterior features: Front covered porch; Porch at front entry; No additional exterior structures reported
Interior
- Kitchen: Gas cooking; Gas oven; Tile countertops; Refrigerator; Range/oven
- Bedrooms: All bedrooms on the lower level; Unit breakdown: Four units with 2 bedrooms each
- Flooring: Laminate floors; Carpeted floors; Vinyl tile floors
- Bathrooms: Tile bathrooms; Shower over tub in bathrooms; Each unit configured with one bathroom
- Heating & cooling: Wall-mounted gas heating; No central cooling
- Interior features: Shared/common walls; Furnished; Living room entry; Attic room
- Laundry & utility: Community laundry (shared); Laundry located outside; Owner-provided laundry equipment
Neighborhood map
What this means for you Summary
Snapshot
- This is a 3 × 3-bed/1.3-bath units multifamily listed at $850k.
Deal economics
- At list price, monthly cash flow is $353 ($4k/yr) — positive. Per door: $118/mo.
- The deal already cash-flows at list — no discount required.
- To meet the 1% rule (rent ≥ 1% of price), the offer needs to be $788k (7.3% below list).
- Recommended offer: $788k (7.3% below list) — sets the bar for 1% rule.
- Cap rate 6.8% vs local median 2.1% in Los Angeles — top-decile yield for the area; either an underpriced asset or a hidden risk that comps aren't pricing in. Stress-test before assuming the spread holds.
Location & tenants
- Location reads 68/100 on livability (#273 in CA) — a middle-class / working-renter tenant base. Strengths: amenities A+, commute A+, employment B; Watch: health & safety C-, schools D+, crime F.
- Los Angeles Unified (urban): math 29% / reading 54% proficiency, ranked #223 of 517 in CA (top 43%) — families likely to look elsewhere, expect single-tenant / working-renter base with shorter leases; 67% free/reduced lunch — lower-income household profile, screen leases tightly.
- Market conditions: 52 active listings in the ZIP; 40 comparable units currently listed for rent nearby; rentals at typical pace (median 25d on market — plan ~3-4 weeks tenant-placement turnaround); 40% of comp listings sitting > 30 days — soft ceiling on asking rent; 19,697 units permitted in Los Angeles County in 2024 (9,426 in 5+ unit buildings).
- At $7,883/mo this rent would consume 156% of the median local household income ($61k/yr) (locally 2573% of renters already pay >50% of income on rent) — very limited rent-growth headroom before tenants either downsize or default.
Forward outlook
- Local home prices are declining (-3.0%/yr); year-one equity from $6k of loan paydown is wiped out by about $26k of value loss. Plan a longer hold.
- Los Angeles County population projected at +9% by 2050 — modest demand growth; plan on rents tracking national, not racing it.
Negotiation context
- It's been on market 15 days — a 2% lower offer ($837k) is reasonable based on typical stale-listing flexibility.
Risks & watch-outs
- Watch-outs: built in 1927 — expect roof / HVAC / electrical / plumbing capex.
- Climate carrying-cost: extreme-heat days projected 7→22/yr by 2055 (HVAC capex compounding) — expect insurance premiums to compound above CPI over the hold.
Questions for the listing agent
- Can we see the unit-by-unit rent roll, current vacancy, and any below-market leases? What's the average tenancy length?
- What capital expenditures (roof, boiler, parking lot, exteriors) have been made in the last 5 years, and what's planned in the next 2?
- Built in 1927 — when were the roof, HVAC, electrical panel, plumbing, and water heater last replaced?
- Is there a deadline driving the sale (1031 exchange, divorce, estate, relocation)? That informs how much negotiation room exists.
- Schools are D-rated, which usually means shorter tenancies and higher turnover. Who's the typical renter profile here, and what's been the actual vacancy rate?
- Crime grade is F in this area — have there been break-ins, vandalism, or insurance claims at this property in the last 3 years? What carrier currently insures it and at what premium?
- The area grade is low — what's the realistic commute time and amenity access for the typical tenant pool here? Any planned neighborhood developments (good or bad) we should know about?
- What's the average days-on-market for RENTAL listings here right now (not sales)? A rising rental-DOM trend means longer vacancies and softer asking-rent achievability than the comps imply.
- What's the recent tenant-quality profile in this submarket — average credit score on applications, eviction rate, late-payment / NSF rate, and stable-employment percentage? A property-management company in the area should have these aggregated.
- How much new apartment / multifamily construction is in the pipeline within 1–3 miles? Heavy new supply (>2% of stock underway) typically softens rents 12–24 months out; light construction supports rent growth.
Investment metrics
- 1% rule
- 0.93% ✗
- Cap rate
- 6.79%
- Cash-on-cash
- 1.78%
- DSCR
- 1.08
- GRM
- 9.0
CMA / ARV
- ARV (on-the-fly)
- $466,186
- Comps found
- 1
Show comp detail 1 sale within ~0.75 mi
| Address | Dist | Beds/Ba | Sqft | Sold | Price | $/sf | Match |
|---|---|---|---|---|---|---|---|
| 210 85th Pl | 0.73mi | 3/2.0 (+1) | 1,006 (+7%) | 2mo | $500,000 | $497 | 43 |
Match score weights: distance 35% · size 25% · config 20% · recency 20%. Top-matched comps best support the ARV.
Projected returns pro-forma
-3.0% appreciation · 3.0% rent growth · sell at horizon
- IRR
- -13.5%
- Equity multiple
- 0.52×
- Total profit
- $-115,109
- Equity at exit
- $126,738
- IRR
- -4.5%
- Equity multiple
- 0.70×
- Total profit
- $-70,767
- Equity at exit
- $73,492
Cash invested: $238,000 (down + closing). Projections, not guarantees.
Landlord ↔ Tenant lean methodology
- Overall (CITY)
- 0 Strongly Tenant-Friendly
- State California
- 18 Strongly Tenant-Friendly · D+13
- County
- — inherits STATE
- City Los Angeles
- 0 Strongly Tenant-Friendly · D+22
ZIP-level market 90001
- Active inventory
- 52
- Price-to-rent
- 27.0×
Monthly cashflow live
- Estimated rent
- $7,883 medium interval (Pro) →
- Mortgage (P&I)
- −$4,457
- Tax est. 1.5%
- −$1,062 /mo · $12,750/yr
- Insurance
- −$354
- HOA
- −$0
- Vacancy / Maint / Mgmt
- −$1,655
- Net cashflow
- $353
Break-even live
3-unit breakdown (identical units grouped — click to expand)
| Units | Beds | Baths | Est. rent |
|---|---|---|---|
| 3× units | 3 | 1.3 | $7,884 |
| #1 | 3 | 1.3 | $2,628 |
| #2 | 3 | 1.3 | $2,628 |
| #3 | 3 | 1.3 | $2,628 |
| Total (3 units) | $7,883 | ||
UW: 25.0% down · 7.5% · 30yr · 1.5% tax · 5.0% vac · 8.0% maint · 8.0% mgmt
Financing live
Cash to close
- Down payment
- $212,500
- Closing costs
- $25,500
- Reserves months
- —
- Total cash needed
- —
Loan-product check · same deal, 3 products live
Conventional
25% down · 7.5% · 30yr
- Down + closing
- —
- Monthly P&I
- —
- Monthly cashflow
- —
- DSCR
- —
- Eligible?
- —
Personal DTI + credit; lowest rate.
DSCR
20% down · 8.5% · 30yr
- Down + closing
- —
- Monthly P&I
- —
- Monthly cashflow
- —
- DSCR
- —
- Eligible?
- —
No personal income docs; deal must DSCR.
Hard money
10% down · 12.0% · 12mo
- Down + closing
- —
- Monthly P&I
- —
- Monthly cashflow
- —
- DSCR
- —
- Eligible?
- —
Short-term bridge; refi at stabilization.
Rent comps 40 comps
| Address | Beds | Baths | Sqft | Rent | $/sqft | DOM | Units | Dist |
|---|---|---|---|---|---|---|---|---|
| 8464 Avalon Blvd Unit 6 Los Angeles, CA | 2.0 | 1.0 | 680 | $2,350 | $3.46 | 43d | 1 | 0.12mi |
| 735 E 82nd St Los Angeles, CA | 3.0 | 2.0 | 913 | $3,400 | $3.72 | 43d | 1 | 0.18mi |
| 639 E 87th St Los Angeles, CA | 3.0 | 1.0 | 900 | $3,650 | $4.06 | 5d | 1 | 0.24mi |
| 612 E 87th St Los Angeles, CA | 2.0 | 1.0 | 750 | $2,250 | $3.00 | 7d | 1 | 0.28mi |
| 612 E 87th Pl Unit 614 Los Angeles, CA | 2.0 | 1.0 | 750 | $2,250 | $3.00 | 17d | 1 | 0.34mi |
| 7833 Towne Ave Los Angeles, CA | 2.0 | 1.0 | 700 | $2,325 | $3.32 | 24d | 1 | 0.39mi |
| 7718 Avalon Blvd Unit 7718-5 Los Angeles, CA | 2.0 | 1.0 | 613 | $2,095 | $3.42 | 24d | 1 | 0.40mi |
| 818 E 87th Pl Los Angeles, CA | 2.0 | 1.0 | 821 | $2,000 | $2.44 | 22d | 1 | 0.40mi |
| 816 E 87th Pl Los Angeles, CA | 2.0 | 1.0 | 686 | $2,800 | $4.08 | 3d | 1 | 0.40mi |
| 229 E 85th St Unit 231 12 Los Angeles, CA | 3.0 | 1.0 | 950 | $2,750 | $2.89 | 43d | 1 | 0.41mi |
| 252 E 79th St Los Angeles, CA | 2.0 | 1.0 | 650 | $2,887 | $4.44 | 24d | 1 | 0.47mi |
| 7811 San Pedro St Unit 4 Los Angeles, CA | 3.0 | 1.0 | 800 | $3,100 | $3.88 | 43d | 1 | 0.50mi |
| 8418 Main St Unit 8418 Los Angeles, CA | 3.0 | 3.0 | 977 | $2,695 | $2.76 | 43d | 1 | 0.56mi |
| 1124 Nadeau St Los Angeles, CA | 3.0 | 1.5 | 1000 | $3,995 | $4.00 | 5d | 1 | 0.57mi |
| 202 E 78th St Los Angeles, CA | 1.0 | 1.0 | 550 | $2,250 | $4.09 | 24d | 1 | 0.58mi |
| 107 W 84th Pl Los Angeles, CA | 2.0 | 1.0 | 800 | $2,395 | $2.99 | 43d | 1 | 0.59mi |
| 1214 E 82nd St Los Angeles, CA | 2.0 | 1.0 | 850 | $2,300 | $2.71 | 44d | 1 | 0.60mi |
| 229 E 89th St Unit 231 Los Angeles, CA | 2.0 | 1.0 | 750 | $2,500 | $3.33 | 43d | 1 | 0.62mi |
| 7924 S Main St Los Angeles, CA | 2.0 | 1.0 | 580 | $2,265 | $3.91 | 17d | 1 | 0.63mi |
| 8715 Hooper Ave Unit 87195 Los Angeles, CA | 3.0 | 2.0 | 1050 | $3,490 | $3.32 | 43d | 1 | 0.63mi |
| 8868 Wall St Los Angeles, CA | 2.0 | 1.0 | 800 | $2,500 | $3.12 | 43d | 1 | 0.66mi |
| 8866 Wall St Los Angeles, CA | 2.0 | 1.0 | 800 | $2,500 | $3.12 | 43d | 1 | 0.66mi |
| 201 W 85th Pl Los Angeles, CA | 2.0 | 1.0 | 775 | $2,100 | $2.71 | 13d | 1 | 0.72mi |
| 201 W 85th Pl Unit NA Los Angeles, CA | 2.0 | 1.0 | 802 | $2,100 | $2.62 | 7d | 1 | 0.72mi |
| 833 E 92nd St Los Angeles, CA | 2.0 | 1.0 | 800 | $2,600 | $3.25 | 5d | 1 | 0.72mi |
| 219 E 76th St Los Angeles, CA | 2.0 | 1.0 | 805 | $2,395 | $2.98 | 43d | 1 | 0.72mi |
| 212 W 84th St Los Angeles, CA | 2.0 | 1.0 | 990 | $3,100 | $3.13 | 43d | 1 | 0.72mi |
| 7688 Main St Los Angeles, CA | 3.0 | 2.0 | 1100 | $3,200 | $2.91 | 24d | 1 | 0.72mi |
| 9204 San Pedro St Los Angeles, CA | 2.0 | 1.0 | 800 | $2,400 | $3.00 | 7d | 1 | 0.78mi |
| 8462 Zamora Ave Los Angeles, CA | 3.0 | 1.0 | 952 | $2,895 | $3.04 | 24d | 1 | 0.81mi |
| 8319 S Broadway Los Angeles, CA | 2.0 | 1.0 | 900 | $1,995 | $2.22 | 5d | 1 | 0.84mi |
| 8209 S Broadway Unit 8209-1 Los Angeles, CA | 3.0 | 1.0 | 1000 | $2,600 | $2.60 | 18d | 1 | 0.85mi |
| 321 W 83rd St Los Angeles, CA | 2.0 | 1.0 | 900 | $2,800 | $3.11 | 24d | 1 | 0.88mi |
| 321 W 83rd St Los Angeles, CA | 2.0 | 1.0 | 900 | $2,800 | $3.11 | 22d | 1 | 0.88mi |
| 328 W 83rd St Los Angeles, CA | 2.0 | 1.0 | 850 | $2,400 | $2.82 | 43d | 1 | 0.89mi |
| 241 W 89th St Los Angeles, CA | 1.0 | 1.0 | 680 | $2,200 | $3.24 | 18d | 1 | 0.92mi |
| 304 E 95th St #6 Los Angeles, CA | 2.0 | 1.0 | 850 | $2,700 | $3.18 | 24d | 1 | 0.94mi |
| 120 W 73rd St Los Angeles, CA | 3.0 | 1.0 | 800 | $2,700 | $3.38 | 43d | 1 | 0.95mi |
| 120 W 73rd St Unit 4 Los Angeles, CA | 3.0 | 1.0 | 850 | $2,600 | $3.06 | 3d | 1 | 0.95mi |
| 151 E 95th St Los Angeles, CA | 2.0 | 1.0 | 1050 | $2,800 | $2.67 | 43d | 1 | 0.98mi |
Listing history 10 events
-
2026-06-18days on market $850,000 Active 15 DOM
-
2026-06-17days on market $850,000 Active 14 DOM
-
2026-06-16days on market $850,000 Active 13 DOM
-
2026-06-15days on market $850,000 Active 12 DOM
-
2026-06-13days on market $850,000 Active 10 DOM
-
2026-06-09days on market $850,000 Active 6 DOM
-
2026-06-08days on market $850,000 Active 5 DOM
-
2026-06-07days on market $850,000 Active 4 DOM
-
2026-06-04remarks 605-char remark
-
2026-06-04$850,000 Active 1 DOM
ⓘ Source: listings_history table (triggers on properties + properties_extension) + one-shot
backfill from property_details.listing_events for pre-trigger history.
Climate risk First Street
- Flood 1/10 Low FEMA zone X (unshaded) · 0% chance over 30 yrs
- Wildfire 1/10 Low
- Heat 5/10 Major 7 d/yr ≥90°F today · 22 d/yr by 30 yrs out
- Wind 1/10 Low
- Air quality 5/10 Major 7 unhealthy d/yr today · 7 by 30 yrs out
Nearby sold comps map
Loading sold comps map…
Walkable amenities ~0.75 mi
Loading nearby amenities…
Taxation est. · year 1
- Rental income
- $94,596
- − Mortgage interest
- −$47,613
- − Property taxes
- −$12,750
- − Insurance
- −$4,250
- − Repairs & maintenance
- −$7,568
- − Management
- −$7,568
- − Depreciation
- −$24,727
- Taxable loss
- −$9,880
- Est. tax savings @ 24.0%
- +$2,371
- After-tax cash flow
- $6,612/yr
For passive investors: Depreciation is non-cash, so a rental often shows a tax loss while cash-flowing — sheltering income. Rental losses are passive: they offset passive income freely, and up to $25,000/yr can offset ordinary (W-2) income if you actively participate and your MAGI is under $100k (phasing out to $0 by $150k); unused losses carry forward. On sale, claimed depreciation is recaptured at up to 25%, and gains may owe capital-gains tax (a 1031 exchange can defer both). Figures are a year-1 estimate at your 24.0% rate — not tax advice; consult a CPA.
Schools (NCES district)
- District
- Los Angeles Unified
- NCES district ID
- 0622710
- Math proficiency
- 29% ▼ -4.00%
- Reading proficiency
- 54% ▲ 10.00%
- Median HH income
- $50,403
- Composite
- 35.67/100
- National rank
- #4875
- State rank
- #223 of 517 in CA
Livability — Los Angeles
- Score
- 68/100
- State rank
- #273
- US rank
- #9237
Category grades
Schools grade is shown separately in the Schools card above.
Census & demographics
- Census place
- Los Angeles, CA
- County
- Los Angeles County · 9,444,647 people
- City population
- 3,838,149
- Metro
- Los Angeles-Long Beach-Anaheim, CA
- Population (ZIP)
- 56,189
- Household income
- $60,767
- Rent vs Own
- Severe rent burden
- 2573.0
Population outlook (Los Angeles County) Hauer SSP2
- Today (2025)
- 10,940,515 people
- By 2030
- 11,256,481 · +2.9%
- By 2040
- 11,729,929 · +7.2%
- By 2050
- 11,948,407 · +9.2%
- By 2075
- 11,818,114 · +8.0%
- By 2100
- 10,842,928 · -0.9%
Race, ethnicity, and origin ACS 2023
- Neighborhood character
- Predominantly Hispanic (91%)
- Race & ethnicity
- Hispanic / Latino 91% Two or more races 29% Black 7% Native American 3%
- Hispanic origin (detail)
- Mexican 74%
- Foreign-born
- 40% · Canada
- Languages at home
- 16% English-only · Spanish 83%
Political lean MEDSL · Los Angeles
- 2024 margin
- Solid D (+32.9) · D 64.8% · R 31.9% · Other 3.3%
- 2008→2024 swing
- -7.4pp toward R · 2008: 40.4pp · 2024: 32.9pp
- All cycles
- 2024: D+32.9 2020: D+44.2 2016: D+48.0 2012: D+40.0 2008: D+40.4
Not yet ingested
- Civics
- —
Market trends
- HPI YoY
- ▼ -558.17%
- Current HPI
- 447.307
- Rent YoY
- —
- Metro
- Los Angeles-Long Beach-Anaheim, CA
- State GDP YoY
- ▲ 3.21%
- F500 in state
- 116
Industry mix (Fortune 500 HQ in CA)
| Industry | F500 HQs | Revenue |
|---|---|---|
| Technology | 27 | $1,492B |
|
||
| Financial Services | 3 | $174B |
|
||
| Retail | 3 | $44B |
|
||
| Insurance | 3 | $26B |
|
||
| Media / Entertainment | 2 | $115B |
|
||
| Pharmaceuticals / Biotech | 2 | $62B |
|
||
Price history
1 event — show timeline
- 2026-06-03 Listed $850,000 TheMLS
Property tax history
+2.0%/yrLatest (2025): $1,527 · +3.8% YoY. Source: county tax records.
Cash-flow waterfall
monthlySold comps — $/sqft
last 12 mo · ≤1 miLoading sold comps…