305 W 2nd St · Del Rio, TX
Flood risk 1/10 · Minimal
- FEMA flood zone
- X (unshaded)
- Chance of flooding over 30 yrs
- 0.0%
- Est. flood insurance / yr
- $507 – $1,088
Fire risk 6/10 · Moderate
- Est. fire insurance / yr
- $1,222 – $2,270
Heat risk 8/10 · Major
- Hot days now (above 108°F)
- 7 days/yr
- Hot days in 30 yrs
- 24 days/yr
Wind risk 4/10 · Minor
- Chance of severe wind over 30 yrs
- 12.0%
Air-quality risk 1/10 · Minimal
- Unhealthy air days now
- 0 days/yr
- Unhealthy air days in 30 yrs
- 0 days/yr
Risk factors via First Street. Map © Google.
Why this score? — see what drove the C- grade
The composite is a weighted blend of 9 inputs, each scored 0–100. Each bar is that input's sub-score; the figure is the points it added to the 100-point composite (weight × sub-score).
- Cash flow +26.5/30.0
- DSCR +9.0/10.0
- 1% rule +6.8/10.0
- Livability +3.5/5.0
- Rent growth +2.9/5.0
- Condition / age +2.5/5.0
- Schools +2.4/10.0
- ARV discount +0.0/15.0
- Appreciation +0.0/10.0
$150,000
🖨 Deal sheet 📄 Offer letter ✓ Due diligence
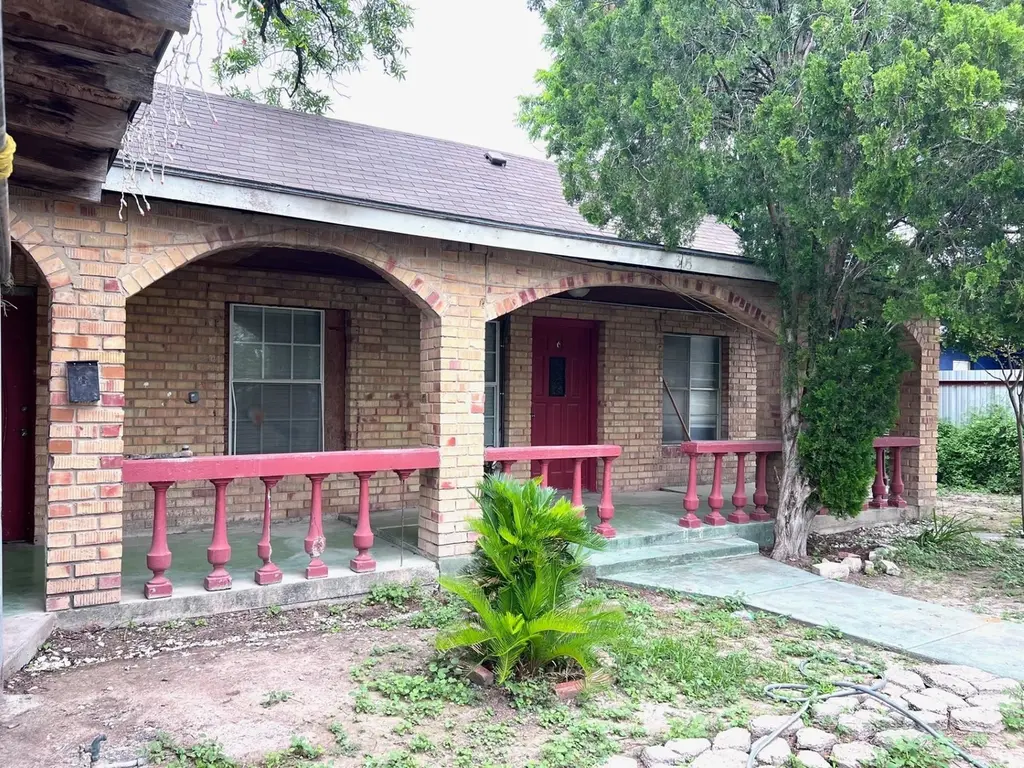
Listing remarks
Looking for a big house with a big yard and mature trees. This home has 4 bedrooms and 1 bath. Great home for a large family. Put you remodeling hat on and remodel it to your liking. Great investment opportunity!
Key facts
- Built 1990
- Listed 41 days
Property features AI
Exterior
- Utilities: Public water; Public sewer
- Home design: Single-family residence (residential property)
- Construction: Stone and stucco construction; Slab foundation
- Exterior features: Chain link fencing; Composition roof
Interior
- Kitchen: Gas range
- Flooring: Concrete; Tile
- Bathrooms: 1 full bathroom
- Interior features: Gas water heater; Concrete and tile flooring
Neighborhood map
What this means for you Summary
Snapshot
- This is a 4-bed/1.0-bath single-family listed at $150k.
Deal economics
- At list price, monthly cash flow is $397 ($5k/yr) — positive.
- The deal already cash-flows at list — no discount required.
- Meets the 1% rule at list price ($2k rent vs $150k).
- Recommended offer: $146k (3.0% below list) — sets the bar for market timing.
Location & tenants
- Location reads 70/100 on livability (#349 in TX) — a middle-class / working-renter tenant base. Strengths: cost of living A+, housing A+, crime A-; Watch: health & safety C-, employment D+, amenities F.
- San Felipe-Del Rio CISD (town): math 25% / reading 32% proficiency, ranked #667 of 826 in TX (top 81%) — low school quality limits family demand, transient renter base, plan for 1-2y turnover; 70% free/reduced lunch — lower-income household profile, screen leases tightly.
- Zoned schools: Dr Fermin Calderon El (math 15% / reading 24%, grade F, #3,583 of 4,322 statewide, top 86%, 541 students, 86% FRL) — zoned schools average 86% FRL vs 70% district-wide (16 pts higher); higher-poverty schools than district average — tighter screening recommended.
- Market conditions: Rents rising (+1.6%/yr); 549 active listings in the ZIP; 7 comparable units currently listed for rent nearby; rentals lingering (median 44d on market — plan ~5-8 weeks vacancy on turnover, expect pricing pressure); 100% of comp listings sitting > 30 days — soft ceiling on asking rent; 85 units permitted in Val Verde County in 2024 (0 in 5+ unit buildings).
- This rent runs 32% of the median local income ($66k/yr) — at the standard rent-burdened threshold; future hikes will face affordability resistance.
Forward outlook
- Local home prices are declining (-3.0%/yr); year-one equity from $1k of loan paydown is wiped out by about $4k of value loss. Plan a longer hold.
- Val Verde County population projected to shrink 9% by 2050 — rents likely to lag national; underwrite the cash flow, not the appreciation.
Negotiation context
- It's been on market 42 days — a 3% lower offer ($146k) is reasonable based on typical stale-listing flexibility.
- 2 sale attempts since 4y ago; this cycle's ask has dropped $15k (9%) from the opening price — seller is motivated, your offer sets the floor, not the list.
Risks & watch-outs
- Climate carrying-cost: major wildfire risk; extreme-heat days projected 7→24/yr by 2055 (HVAC capex compounding) — expect insurance premiums to compound above CPI over the hold.
Questions for the listing agent
- It's been on market 42 days. Have you received any prior offers? Is the seller open to a 3% concession, seller financing, or rate buy-down credit?
- Is there a deadline driving the sale (1031 exchange, divorce, estate, relocation)? That informs how much negotiation room exists.
- Schools are D-rated, which usually means shorter tenancies and higher turnover. Who's the typical renter profile here, and what's been the actual vacancy rate?
- What's the average days-on-market for RENTAL listings here right now (not sales)? A rising rental-DOM trend means longer vacancies and softer asking-rent achievability than the comps imply.
- What's the recent tenant-quality profile in this submarket — average credit score on applications, eviction rate, late-payment / NSF rate, and stable-employment percentage? A property-management company in the area should have these aggregated.
- How much new for-sale + rental construction is in the pipeline within 1–3 miles? Heavy new supply typically softens prices + rents 12–24 months out; constrained supply supports both.
Investment metrics
- 1% rule
- 1.18% ✓
- Cap rate
- 9.47%
- Cash-on-cash
- 11.34%
- DSCR
- 1.50
- GRM
- 7.0
CMA / ARV
- ARV (median comp)
- $118,581
- List price
- $150,000
- Delta
- 26.50%
- Verdict
- OVERPRICED
- Comps
- 9 within 1.0 mi
Show comp detail 1 sale within ~0.75 mi
| Address | Dist | Beds/Ba | Sqft | Sold | Price | $/sf | Match |
|---|---|---|---|---|---|---|---|
| 304 W 3rd St | 0.04mi | 3/2.0 (-1) | 1,544 (-6%) | 24mo | $150,000 | $97 | 59 |
Match score weights: distance 35% · size 25% · config 20% · recency 20%. Top-matched comps best support the ARV.
Projected returns pro-forma
-3.0% appreciation · 1.55% rent growth · sell at horizon
- IRR
- -1.0%
- Equity multiple
- 0.96×
- Total profit
- $-1,577
- Equity at exit
- $22,365
- IRR
- 7.1%
- Equity multiple
- 1.50×
- Total profit
- $21,023
- Equity at exit
- $12,969
Cash invested: $42,000 (down + closing). Projections, not guarantees.
Landlord ↔ Tenant lean methodology
- Overall (STATE)
- 87 Strongly Landlord-Friendly
- State Texas
- 87 Strongly Landlord-Friendly · R+5
- County
- — inherits STATE
- City
- — inherits STATE
ZIP-level market 78840
- Home prices YoY
- -33.6%
- Rents YoY
- 1.6%
- Active inventory
- 549
- Price-to-rent
- 7.0×
Monthly cashflow live
- Estimated rent
- $1,777 high interval (Pro) →
- Mortgage (P&I)
- −$787
- Tax from tax record
- −$158 /mo · $1,891/yr
- Insurance
- −$62
- HOA
- −$0
- Vacancy / Maint / Mgmt
- −$373
- Net cashflow
- $397
Break-even live
UW: 25.0% down · 7.5% · 30yr · 1.5% tax · 5.0% vac · 8.0% maint · 8.0% mgmt
Financing live
Cash to close
- Down payment
- $37,500
- Closing costs
- $4,500
- Reserves months
- —
- Total cash needed
- —
Loan-product check · same deal, 3 products live
Conventional
25% down · 7.5% · 30yr
- Down + closing
- —
- Monthly P&I
- —
- Monthly cashflow
- —
- DSCR
- —
- Eligible?
- —
Personal DTI + credit; lowest rate.
DSCR
20% down · 8.5% · 30yr
- Down + closing
- —
- Monthly P&I
- —
- Monthly cashflow
- —
- DSCR
- —
- Eligible?
- —
No personal income docs; deal must DSCR.
Hard money
10% down · 12.0% · 12mo
- Down + closing
- —
- Monthly P&I
- —
- Monthly cashflow
- —
- DSCR
- —
- Eligible?
- —
Short-term bridge; refi at stabilization.
Rent comps 7 comps
| Address | Beds | Baths | Sqft | Rent | $/sqft | DOM | Units | Dist |
|---|---|---|---|---|---|---|---|---|
| 504 Avenue V Del Rio, TX | 3.0 | 2.0 | 1196 | $1,350 | $1.13 | 43d | 1 | 0.54mi |
| 401 Saint Joseph St Del Rio, TX | 3.0 | 2.0 | 1302 | $1,700 | $1.31 | 43d | 1 | 0.66mi |
| 105 Saint Joseph St Del Rio, TX | 3.0 | 2.0 | 1318 | $1,600 | $1.21 | 43d | 1 | 0.70mi |
| 410 Pulliam St Del Rio, TX | 3.0 | 2.0 | 1700 | $1,800 | $1.06 | 43d | 1 | 0.76mi |
| 424 W Nicholson St Del Rio, TX | 3.0 | 2.0 | 1918 | $1,800 | $0.94 | 43d | 1 | 0.86mi |
| 203 Kennedy Dr Del Rio, TX | 3.0 | 2.0 | 1215 | $1,350 | $1.11 | 43d | 1 | 1.19mi |
| 224 Highland St Del Rio, TX | 4.0 | 2.0 | 1751 | $1,250 | $0.71 | 43d | 1 | 1.31mi |
Listing history 20 events
-
2026-06-19days on market $150,000 Active 42 DOM
-
2026-06-18days on market $150,000 Active 41 DOM
-
2026-06-18price $150,000 Active 40 DOM
-
2026-06-17days on market $165,000 Active 40 DOM
-
2026-06-16days on market $165,000 Active 39 DOM
-
2026-06-15days on market $165,000 Active 38 DOM
-
2026-06-14days on market $165,000 Active 36 DOM
-
2026-06-12days on market $165,000 Active 35 DOM
-
2026-06-09days on market $165,000 Active 32 DOM
-
2026-06-08days on market $165,000 Active 31 DOM
-
2026-06-07days on market $165,000 Active 30 DOM
-
2026-06-05days on market $165,000 Active 27 DOM
-
2026-06-03days on market $165,000 Active 26 DOM
-
2026-06-02days on market $165,000 Active 25 DOM
-
2026-06-01days on market $165,000 Active 24 DOM
-
2026-05-31days on market $165,000 Active 23 DOM
-
2026-05-30days on market $165,000 Active 22 DOM
-
2026-05-08$165,000 Active 212-char remark
-
2022-02-25$145,000
-
1998-11-16soldstatus
ⓘ Source: listings_history table (triggers on properties + properties_extension) + one-shot
backfill from property_details.listing_events for pre-trigger history.
Tax reassessment forecast TX · Resets to sale price
- Current annual tax
- $1,891 · $158/mo
- Projected year-2 tax
- $2,745 · $229/mo
- Expected delta
- +$854/yr (+$71/mo · 45.1%)
ⓘ Screening estimate from a state-policy table — verify with the county assessor before closing.
Climate risk First Street
- Flood 1/10 Low FEMA zone X (unshaded) · 0% chance over 30 yrs
- Wildfire 6/10 Major
- Heat 8/10 Severe 7 d/yr ≥108°F today · 24 d/yr by 30 yrs out
- Wind 4/10 Moderate 12% chance of damaging wind over 30 yrs
- Air quality 1/10 Low 0 unhealthy d/yr today · 0 by 30 yrs out
Nearby sold comps map
Loading sold comps map…
Walkable amenities ~0.75 mi
Loading nearby amenities…
Taxation est. · year 1
- Rental income
- $21,320
- − Mortgage interest
- −$8,402
- − Property taxes
- −$1,891
- − Insurance
- −$750
- − Repairs & maintenance
- −$1,706
- − Management
- −$1,706
- − Depreciation
- −$4,364
- Taxable income
- $2,502
- Est. tax owed @ 24.0%
- −$600
- After-tax cash flow
- $4,162/yr
For passive investors: Depreciation is non-cash, so a rental often shows a tax loss while cash-flowing — sheltering income. Rental losses are passive: they offset passive income freely, and up to $25,000/yr can offset ordinary (W-2) income if you actively participate and your MAGI is under $100k (phasing out to $0 by $150k); unused losses carry forward. On sale, claimed depreciation is recaptured at up to 25%, and gains may owe capital-gains tax (a 1031 exchange can defer both). Figures are a year-1 estimate at your 24.0% rate — not tax advice; consult a CPA.
Schools (NCES district)
- District
- San Felipe-Del Rio CISD
- NCES district ID
- 4838900
- Math proficiency
- 25% ▼ -18.00%
- Reading proficiency
- 32% ▼ -5.00%
- Median HH income
- $40,582
- Composite
- 24.04/100
- National rank
- #7766
- State rank
- #667 of 826 in TX
Livability — Del Rio
- Score
- 70/100
- State rank
- #349
- US rank
- #7531
Category grades
Schools grade is shown separately in the Schools card above.
Census & demographics
- Census place
- Del Rio, TX
- County
- Val Verde County · 47,256 people
- City population
- 47,256
- Metro
- Del Rio, TX
- Population (ZIP)
- 47,256
- Household income
- $66,084
- Rent vs Own
- Severe rent burden
- 1111.0
Population outlook (Val Verde County) Hauer SSP2
- Today (2025)
- 48,073 people
- By 2030
- 47,468 · -1.3%
- By 2040
- 45,930 · -4.5%
- By 2050
- 43,904 · -8.7%
- By 2075
- 38,126 · -20.7%
- By 2100
- 26,217 · -45.5%
Race, ethnicity, and origin ACS 2023
- Neighborhood character
- Predominantly Hispanic (82%)
- Race & ethnicity
- Hispanic / Latino 82% Two or more races 24% White 15% Black 1%
- Hispanic origin (detail)
- Mexican 75%
- Common ancestry
- Italian 1% Lithuanian 1% Slovak 1%
- Foreign-born
- 19% · Canada
- Languages at home
- 36% English-only · Spanish 63%
Political lean MEDSL · Val Verde
- 2024 margin
- Strong R (+26.6) · D 36.2% · R 62.9%
- 2008→2024 swing
- -36.2pp toward R · 2008: 9.6pp · 2024: -26.6pp
- All cycles
- 2024: R+26.6 2020: R+9.9 2016: D+7.9 2012: D+5.4 2008: D+9.6
Not yet ingested
- Civics
- —
Market trends
- HPI YoY
- ▼ -81.95%
- Current HPI
- 161.762
- Rent YoY
- ▲ 1.55%
- Metro
- Del Rio, TX
- State GDP YoY
- ▲ 3.95%
- F500 in state
- 110
Industry mix (Fortune 500 HQ in TX)
| Industry | F500 HQs | Revenue |
|---|---|---|
| Energy | 16 | $1,198B |
|
||
| Technology | 5 | $198B |
|
||
| Engineering / Construction | 4 | $72B |
|
||
| Energy Services | 3 | $60B |
|
||
| Utilities | 3 | $41B |
|
||
| Healthcare | 2 | $330B |
|
||
Price history
+3.4% since first listed4 events — show timeline
- 2026-06-17 Price Changed $150,000 DRBORMLS
- 2026-05-08 Listed $165,000 DRBORMLS
- 2022-02-25 Listed $145,000 DRBORMLS
- 1998-11-16 Sold (Public Records) — Public Records
Property tax history
+1.9%/yrLatest (2025): $1,891 · +3.4% YoY. Source: county tax records.
Cash-flow waterfall
monthlySold comps — $/sqft
last 12 mo · ≤1 miLoading sold comps…