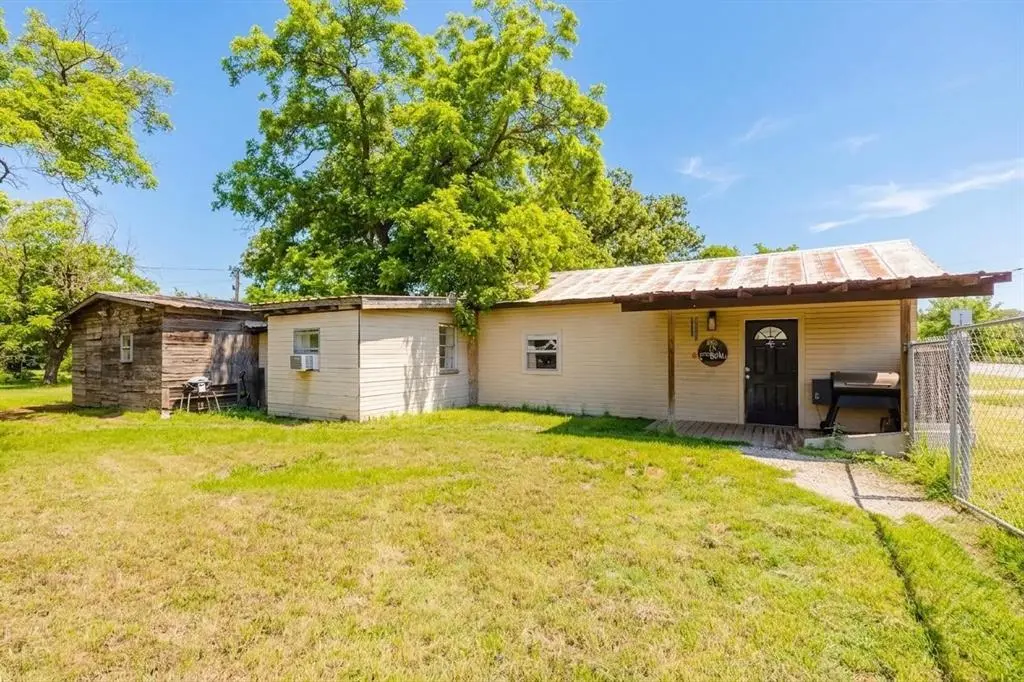
434 Highway 3363 · Eastland, TX
Flood risk 1/10 · Minimal
- FEMA flood zone
- X
- Chance of flooding over 30 yrs
- 0.0%
- Est. flood insurance / yr
- $507 – $1,088
Fire risk 7/10 · Major
- Est. fire insurance / yr
- $1,222 – $2,270
Heat risk 7/10 · Major
- Hot days now (above 106°F)
- 7 days/yr
- Hot days in 30 yrs
- 22 days/yr
Wind risk 6/10 · Moderate
- Chance of severe wind over 30 yrs
- 27.0%
Air-quality risk 1/10 · Minimal
- Unhealthy air days now
- 0 days/yr
- Unhealthy air days in 30 yrs
- 0 days/yr
Risk factors via First Street. Map © Google.
Why this score? — see what drove the B+ grade
The composite is a weighted blend of 9 inputs, each scored 0–100. Each bar is that input's sub-score; the figure is the points it added to the 100-point composite (weight × sub-score).
- Cash flow +30.0/30.0
- ARV discount +15.0/15.0
- 1% rule +10.0/10.0
- DSCR +10.0/10.0
- Livability +3.8/5.0
- Schools +3.6/10.0
- Rent growth +2.5/5.0
- Condition / age +2.5/5.0
- Appreciation +0.0/10.0
$75,000
🖨 Deal sheet (PDF) 📄 Offer letter ✓ Due diligence
Listing remarks
Tucked away in the quiet community of Olden, this charming 2 bedroom, 1 bathroom home offers the peaceful small-town lifestyle so many buyers are searching for. With 917 sq ft of living space, the home features an open living, kitchen, and dining layout that feels surprisingly spacious and welcoming. Recent updates throughout give the home a clean, comfortable feel while still leaving room to make it your own. The primary bedroom offers plenty of space to unwind, while the fully fenced backyard creates the perfect setup for pets, kids, or relaxing evenings outdoors. Conveniently located just minutes from Eastland, this property gives you the quiet of country-style living with easy access to
Key facts
- Quiet community
- 6,186 sq ft lot
- Built 1930
Tags
Property features AI
Finance
- Other: Property is detached (not attached to another unit); Standard listing conditions; Possession at closing/funding
- Financial info: Listing available for cash or conventional financing; Second mortgage: none
- HOA & community: No homeowners association
Exterior
- Parking: Driveway parking
- Utilities: City water; City sewer; No municipal utility district
- Home design: Single-family residence; Residential property; One story
- Construction: Built in 1930; Metal roof; Pillar/post/pier foundation
- Exterior features: Lot smaller than 0.5 acre; Subdivision: Dawson 111; GPS-friendly directions note
Interior
- Kitchen: Gas cooktop
- Bedrooms: 2 bedrooms on the main level (includes primary bedroom)
- Flooring: Carpet; Laminate
- Bathrooms: 1 full bathroom on the main level
- Heating & cooling: Natural gas heating; Window cooling units
- Interior features: Open floorplan; Decorative lighting; High-speed internet available; Six total rooms; One living area; One dining area; One level (single-story)
- Laundry & utility: Washer hookup; Electric dryer hookup; Utility room
Neighborhood map
What this means for you Summary
Snapshot
- This is a 2-bed/1.0-bath single-family listed at $75k.
Deal economics
- At list price, monthly cash flow is $418 ($5k/yr) — positive.
- The deal already cash-flows at list — no discount required.
- Meets the 1% rule at list price ($1k rent vs $75k).
- Recommended offer: $74k (1.5% below list) — sets the bar for market timing.
- Cap rate 13.0% vs local median 3.1% in Eastland — top-decile yield for the area; either an underpriced asset or a hidden risk that comps aren't pricing in. Stress-test before assuming the spread holds.
Location & tenants
- Location reads 76/100 on livability (#104 in TX, #3,483 nationally) — a middle-class / working-renter tenant base. Strengths: cost of living A+, housing A+, health & safety A+; Watch: amenities F, commute F, employment F.
- Eastland ISD (town): math 45% / reading 41% proficiency, ranked #349 of 826 in TX (top 42%) — families likely to look elsewhere, expect single-tenant / working-renter base with shorter leases.
- Zoned schools: Siebert El (math 49% / reading 43%, grade D-, #1,097 of 4,322 statewide, top 26%, 491 students, 65% FRL) — zoned schools average 65% FRL vs 50% district-wide (16 pts higher); higher-poverty schools than district average — tighter screening recommended.
- Market conditions: 84 active listings in the ZIP; 10 units permitted in Eastland County in 2024 (0 in 5+ unit buildings).
Forward outlook
- Local home prices are declining (-3.0%/yr); year-one equity from $519 of loan paydown is wiped out by about $2k of value loss. Plan a longer hold.
- Eastland County population projected at -14% by 2050 — secular population decline; favor cash flow + early exit over multi-decade hold.
- At projected returns (-3.0% appreciation + 3.0% rent growth), your $21k cash investment doubles in ~6 years — after that, you're playing with house money.
Negotiation context
- It's been on market 27 days — a 2% lower offer ($74k) is reasonable based on typical stale-listing flexibility.
Risks & watch-outs
- Watch-outs: built in 1930 — expect roof / HVAC / electrical / plumbing capex.
- Climate carrying-cost: major wind risk, 27% chance of damaging wind over 30y; major wildfire risk; extreme-heat days projected 7→22/yr by 2055 (HVAC capex compounding) — expect insurance premiums to compound above CPI over the hold.
Questions for the listing agent
- Built in 1930 — when were the roof, HVAC, electrical panel, plumbing, and water heater last replaced?
- Is there a deadline driving the sale (1031 exchange, divorce, estate, relocation)? That informs how much negotiation room exists.
- Schools are D-rated, which usually means shorter tenancies and higher turnover. Who's the typical renter profile here, and what's been the actual vacancy rate?
- What's the average days-on-market for RENTAL listings here right now (not sales)? A rising rental-DOM trend means longer vacancies and softer asking-rent achievability than the comps imply.
- What's the recent tenant-quality profile in this submarket — average credit score on applications, eviction rate, late-payment / NSF rate, and stable-employment percentage? A property-management company in the area should have these aggregated.
- How much new for-sale + rental construction is in the pipeline within 1–3 miles? Heavy new supply typically softens prices + rents 12–24 months out; constrained supply supports both.
Investment metrics
- 1% rule
- 1.52% ✓
- Cap rate
- 12.98%
- Cash-on-cash
- 23.87%
- DSCR
- 2.06
- GRM
- 5.5
CMA / ARV
- ARV (median comp)
- $104,233
- List price
- $75,000
- Delta
- -28.05%
- Verdict
- UNDERPRICED
- Comps
- 6 within 1.0 mi
Projected returns pro-forma
-3.0% appreciation · 3.0% rent growth · sell at horizon
- IRR
- 17.1%
- Equity multiple
- 1.69×
- Total profit
- $14,448
- Equity at exit
- $11,183
- IRR
- 25.6%
- Equity multiple
- 3.23×
- Total profit
- $46,817
- Equity at exit
- $6,485
Cash invested: $21,000 (down + closing). Projections, not guarantees.
Landlord ↔ Tenant lean methodology
- Overall (STATE)
- 87 Strongly Landlord-Friendly
- State Texas
- 87 Strongly Landlord-Friendly · R+5
- County
- — inherits STATE
- City
- — inherits STATE
ZIP-level market 76448
- Home prices YoY
- -21.7%
- Active inventory
- 84
- Price-to-rent
- 5.5×
Monthly cashflow live
- Estimated rent
- $1,137 medium interval (Pro) →
- Mortgage (P&I)
- −$393
- Tax from tax record
- −$56 /mo · $669/yr
- Insurance
- −$31
- HOA
- −$0
- Vacancy / Maint / Mgmt
- −$239
- Net cashflow
- $418
Break-even live
Sensitivity live
| Price | -10% $460 | -5% $439 | +0% $418 | +5% $397 | +10% $375 |
|---|---|---|---|---|---|
| Rent | -10% $328 | -5% $373 | +0% $418 | +5% $463 | +10% $508 |
| Rate | -1.0pp $456 | -0.5pp $437 | base $418 | +0.5pp $398 | +1.0pp $379 |
UW: 25.0% down · 7.5% · 30yr · 1.5% tax · 5.0% vac · 8.0% maint · 8.0% mgmt
Financing live
Cash to close
- Down payment
- $18,750
- Closing costs
- $2,250
- Reserves months
- —
- Total cash needed
- —
Loan-product check · same deal, 3 products live
Conventional
25% down · 7.5% · 30yr
- Down + closing
- —
- Monthly P&I
- —
- Monthly cashflow
- —
- DSCR
- —
- Eligible?
- —
Personal DTI + credit; lowest rate.
DSCR
20% down · 8.5% · 30yr
- Down + closing
- —
- Monthly P&I
- —
- Monthly cashflow
- —
- DSCR
- —
- Eligible?
- —
No personal income docs; deal must DSCR.
Hard money
10% down · 12.0% · 12mo
- Down + closing
- —
- Monthly P&I
- —
- Monthly cashflow
- —
- DSCR
- —
- Eligible?
- —
Short-term bridge; refi at stabilization.
Listing history 9 events
-
2026-06-07statusdays on market $75,000 Pending 27 DOM
-
2026-06-03days on market $75,000 Active Contingent 26 DOM
-
2026-06-02days on market $75,000 Active Contingent 25 DOM
-
2026-06-01days on market $75,000 Active Contingent 24 DOM
-
2026-05-31days on market $75,000 Active Contingent 23 DOM
-
2026-05-17historical Active Option Contract 866-char remark
-
2026-05-08$75,000 Active 866-char remark
-
2024-04-29soldstatus
-
2024-02-06soldstatus
ⓘ Source: listings_history table (triggers on properties + properties_extension) + one-shot
backfill from property_details.listing_events for pre-trigger history.
Tax reassessment forecast TX · Resets to sale price
- Current annual tax
- $669 · $56/mo
- Projected year-2 tax
- $1,372 · $114/mo
- Expected delta
- +$704/yr (+$59/mo · 105.3%)
ⓘ Screening estimate from a state-policy table — verify with the county assessor before closing.
Climate risk First Street
- Flood 1/10 Low FEMA zone X · 0% chance over 30 yrs
- Wildfire 7/10 Severe
- Heat 7/10 Severe 7 d/yr ≥106°F today · 22 d/yr by 30 yrs out
- Wind 6/10 Major 27% chance of damaging wind over 30 yrs
- Air quality 1/10 Low 0 unhealthy d/yr today · 0 by 30 yrs out
Nearby sold comps map
Loading sold comps map…
Walkable amenities ~0.75 mi
Loading nearby amenities…
Taxation est. · year 1
- Rental income
- $13,641
- − Mortgage interest
- −$4,201
- − Property taxes
- −$669
- − Insurance
- −$375
- − Repairs & maintenance
- −$1,091
- − Management
- −$1,091
- − Depreciation
- −$2,182
- Taxable income
- $4,032
- Est. tax owed @ 24.0%
- −$968
- After-tax cash flow
- $4,046/yr
For passive investors: Depreciation is non-cash, so a rental often shows a tax loss while cash-flowing — sheltering income. Rental losses are passive: they offset passive income freely, and up to $25,000/yr can offset ordinary (W-2) income if you actively participate and your MAGI is under $100k (phasing out to $0 by $150k); unused losses carry forward. On sale, claimed depreciation is recaptured at up to 25%, and gains may owe capital-gains tax (a 1031 exchange can defer both). Figures are a year-1 estimate at your 24.0% rate — not tax advice; consult a CPA.
Schools (NCES district)
- District
- Eastland ISD
- NCES district ID
- 4817960
- Math proficiency
- 45% ▼ -5.00%
- Reading proficiency
- 41% ▼ -8.00%
- Median HH income
- $35,347
- Composite
- 35.61/100
- National rank
- #4894
- State rank
- #349 of 826 in TX
Livability — Eastland
- Score
- 76/100
- State rank
- #104
- US rank
- #3483
Category grades
Schools grade is shown separately in the Schools card above.
Census & demographics
- Population (ZIP)
- 4,920
Population outlook (Eastland County) Hauer SSP2
- Today (2025)
- 17,433 people
- By 2030
- 16,908 · -3.0%
- By 2040
- 15,855 · -9.1%
- By 2050
- 14,906 · -14.5%
- By 2075
- 12,843 · -26.3%
- By 2100
- 10,344 · -40.7%
Race, ethnicity, and origin ACS 2023
- Neighborhood character
- Predominantly White (85%)
- Race & ethnicity
- White 85% Two or more races 11% Hispanic / Latino 10% Black 3% Native American 1%
- Hispanic origin (detail)
- Mexican 8%
- Common ancestry
- Italian 21% Slovak 2% Serbian 1%
- Foreign-born
- 5% · Canada
- Languages at home
- 92% English-only · Spanish 8%
Political lean MEDSL · Eastland
- 2024 margin
- Solid R (+77.5) · D 11.0% · R 88.5%
- 2008→2024 swing
- -17.6pp toward R · 2008: -59.8pp · 2024: -77.5pp
- All cycles
- 2024: R+77.5 2020: R+75.4 2016: R+75.4 2012: R+68.9 2008: R+59.8
Not yet ingested
- Civics
- —
Market trends
- HPI YoY
- ▼ -52.60%
- Current HPI
- 190.0993
- Rent YoY
- —
- Metro
- —
- State GDP YoY
- ▲ 3.95%
- F500 in state
- 110
Industry mix (Fortune 500 HQ in TX)
| Industry | F500 HQs | Revenue |
|---|---|---|
| Energy | 16 | $1,198B |
|
||
| Technology | 5 | $198B |
|
||
| Engineering / Construction | 4 | $72B |
|
||
| Energy Services | 3 | $60B |
|
||
| Utilities | 3 | $41B |
|
||
| Healthcare | 2 | $330B |
|
||
Price history
5 events — show timeline
- 2026-06-04 Pending — NTREIS
- 2026-05-17 Contingent — NTREIS
- 2026-05-08 Listed $75,000 NTREIS
- 2024-04-29 Sold (Public Records) — Public Records
- 2024-02-06 Sold (Public Records) — Public Records
Property tax history
+5.4%/yrLatest (2025): $669 · -1.0% YoY. Source: county tax records.
Cash-flow waterfall
monthlySold comps — $/sqft
last 12 mo · ≤1 miLoading sold comps…