2013 Whitby Dr · Orlando, FL
Flood risk 1/10 · Minimal
- FEMA flood zone
- X (unshaded)
- Chance of flooding over 30 yrs
- 0.0%
- Est. flood insurance / yr
- $507 – $1,088
Fire risk 1/10 · Minimal
- Est. fire insurance / yr
- $947 – $1,759
Heat risk 9/10 · Severe
- Hot days now (above 108°F)
- 7 days/yr
- Hot days in 30 yrs
- 23 days/yr
Wind risk 9/10 · Severe
- Chance of severe wind over 30 yrs
- 99.0%
Air-quality risk 1/10 · Minimal
- Unhealthy air days now
- 0 days/yr
- Unhealthy air days in 30 yrs
- 0 days/yr
Risk factors via First Street. Map © Google.
Why this score? — see what drove the D- grade
The composite is a weighted blend of 9 inputs, each scored 0–100. Each bar is that input's sub-score; the figure is the points it added to the 100-point composite (weight × sub-score).
- Cash flow +9.3/30.0
- ARV discount +7.5/15.0
- 1% rule +6.1/10.0
- Livability +4.3/5.0
- Schools +4.1/10.0
- DSCR +2.6/10.0
- Rent growth +2.4/5.0
- Condition / age +1.0/5.0
- Appreciation +0.0/10.0
$134,000
🖨 Deal sheet 📄 Offer letter ✓ Due diligence
Listing remarks MLS
JUST BRING YOUR GUITAR. Fully furnished 2 Bedroom 1 1/2 Bath CENTRAL A/C (3 YO) townhouse (VEHICLES AVAILABLE ALSO) (1982 Imperial Frank Sinatra Edition & 155CC PACE scooter) INCLUDES new 42 in TV, camera system security, wifi, new roof. Perfect retirement location close to downtown, WALMART & TARGET, 20 minutes to Disney or Universal, On 2 bus routes, loads of doctors great hospitals (PALMER & WOMANS). Last saw an inch of snow in 1979. Move in tomorrow just bring YOUR CLOTHES, SWIM SUIT AND SANDLES.
Key facts
- Gated community
- Covered balcony
- Walkin closet
Tags
Neighborhood map
What this means for you Summary
Snapshot
- This is a 2-bed/2.0-bath condo listed at $134k. Condition is rated poor.
Deal economics
- At list price, monthly cash flow is $-99 ($-1k/yr) — negative.
- The deal already cash-flows at list — no discount required.
- Meets the 1% rule at list price ($1k rent vs $134k).
- Recommended offer: $130k (3.0% below list) — sets the bar for market timing.
- Cap rate 5.4% vs local median 3.0% in Orlando — top-decile yield for the area; either an underpriced asset or a hidden risk that comps aren't pricing in. Stress-test before assuming the spread holds.
Location & tenants
- Location reads 86/100 on livability (#12 in FL, #360 nationally) — a professional / high-income tenant draw. Strengths: amenities A+, commute A+, housing A+.
- Orange (suburban): math 46% / reading 51% proficiency, ranked #43 of 73 in FL (top 59%) — families likely to look elsewhere, expect single-tenant / working-renter base with shorter leases.
- Market conditions: Rents soft (-0.5%/yr); 222 active listings in the ZIP; 40 comparable units currently listed for rent nearby; rentals at typical pace (median 24d on market — plan ~3-4 weeks tenant-placement turnaround); 8,053 units permitted in Orange County in 2024 (3,133 in 5+ unit buildings).
- This rent runs 38% of the median local income ($47k/yr) — at the standard rent-burdened threshold; future hikes will face affordability resistance.
Forward outlook
- Local home prices are declining (-3.0%/yr); year-one equity from $926 of loan paydown is wiped out by about $4k of value loss. Plan a longer hold.
- Orange County population projected at +52% by 2050 — long-run rental-demand tailwind backs the buy-and-hold thesis.
Negotiation context
- It's been on market 37 days — a 3% lower offer ($130k) is reasonable based on typical stale-listing flexibility.
- 2 sale attempts with the ask held roughly flat each time — persistent listings suggest the price (not the market) is what's stuck; bring a comps-based counter.
Risks & watch-outs
- Watch-outs: HOA is 23% of rent.
- Climate carrying-cost: severe wind risk, 99% chance of damaging wind over 30y; extreme-heat days projected 7→23/yr by 2055 (HVAC capex compounding) — expect insurance premiums to compound above CPI over the hold.
Questions for the listing agent
- What do current leases actually rent for vs. the listed asking? Can we see a recent rent roll and the last 12 months of T-12 income?
- It's been on market 37 days. Have you received any prior offers? Is the seller open to a 3% concession, seller financing, or rate buy-down credit?
- Have any recent inspections been done? Can we get a copy of the seller's disclosures and any deferred-maintenance estimates?
- Built in 1975 — when were the roof, HVAC, electrical panel, plumbing, and water heater last replaced?
- What does the HOA fee cover, when was the last increase, and are there any pending special assessments or reserve-fund shortfalls?
- Any open or pending special assessments — roof, HVAC, plumbing, elevator, façade? What's the per-unit balance and payoff schedule, and is the seller paying it off at close or rolling it to the buyer?
- Is there a deadline driving the sale (1031 exchange, divorce, estate, relocation)? That informs how much negotiation room exists.
- Schools are B-rated — typically a magnet for longer-tenancy family renters. What's the average tenant stay here, and is there a school-zone premium baked into asking?
- The area grade is low — what's the realistic commute time and amenity access for the typical tenant pool here? Any planned neighborhood developments (good or bad) we should know about?
- What's the average days-on-market for RENTAL listings here right now (not sales)? A rising rental-DOM trend means longer vacancies and softer asking-rent achievability than the comps imply.
- What's the recent tenant-quality profile in this submarket — average credit score on applications, eviction rate, late-payment / NSF rate, and stable-employment percentage? A property-management company in the area should have these aggregated.
- How much new apartment / multifamily construction is in the pipeline within 1–3 miles? Heavy new supply (>2% of stock underway) typically softens rents 12–24 months out; light construction supports rent growth.
Investment metrics
- 1% rule
- 1.11% ✓
- Cap rate
- 5.41%
- Cash-on-cash
- -3.16%
- DSCR
- 0.86
- GRM
- 7.5
CMA / ARV
No comps found within radius.
Projected returns pro-forma
-3.0% appreciation · 0.0% rent growth · sell at horizon
- IRR
- -26.3%
- Equity multiple
- 0.14×
- Total profit
- $-32,139
- Equity at exit
- $19,980
- IRR
- -47.7%
- Equity multiple
- -0.39×
- Total profit
- $-52,004
- Equity at exit
- $11,586
Cash invested: $37,520 (down + closing). Projections, not guarantees.
Landlord ↔ Tenant lean methodology
- Overall (STATE)
- 87 Strongly Landlord-Friendly
- State Florida
- 87 Strongly Landlord-Friendly · R+3
- County
- — inherits STATE
- City
- — inherits STATE
ZIP-level market 32839
- Home prices YoY
- -20.1%
- Rents YoY
- -0.5%
- Active inventory
- 222
- Price-to-rent
- 7.5×
Monthly cashflow live
- Estimated rent
- $1,490 high interval (Pro) →
- Mortgage (P&I)
- −$703
- Tax est. 1.5%
- −$168 /mo · $2,010/yr
- Insurance
- −$56
- HOA est. from 1 same-building comp
- −$350
- Vacancy / Maint / Mgmt
- −$313
- Net cashflow
- $-99
Break-even live
UW: 25.0% down · 7.5% · 30yr · 1.5% tax · 5.0% vac · 8.0% maint · 8.0% mgmt
Financing live
Cash to close
- Down payment
- $33,500
- Closing costs
- $4,020
- Reserves months
- —
- Total cash needed
- —
Loan-product check · same deal, 3 products live
Conventional
25% down · 7.5% · 30yr
- Down + closing
- —
- Monthly P&I
- —
- Monthly cashflow
- —
- DSCR
- —
- Eligible?
- —
Personal DTI + credit; lowest rate.
DSCR
20% down · 8.5% · 30yr
- Down + closing
- —
- Monthly P&I
- —
- Monthly cashflow
- —
- DSCR
- —
- Eligible?
- —
No personal income docs; deal must DSCR.
Hard money
10% down · 12.0% · 12mo
- Down + closing
- —
- Monthly P&I
- —
- Monthly cashflow
- —
- DSCR
- —
- Eligible?
- —
Short-term bridge; refi at stabilization.
Rent comps 40 comps
| Address | Beds | Baths | Sqft | Rent | $/sqft | DOM | Units | Dist |
|---|---|---|---|---|---|---|---|---|
| 4025 Billingsgate Rd #2004 Orlando, FL | 2.0 | 1.5 | 1164 | $1,700 | $1.46 | 23d | 1 | 0.06mi |
| 4023 Henley Rd #1702 Orlando, FL | 2.0 | 1.5 | 1164 | $1,400 | $1.20 | 23d | 1 | 0.12mi |
| 4029 Henley Rd #1705 Orlando, FL | 2.0 | 1.5 | 1164 | $1,625 | $1.40 | 23d | 1 | 0.12mi |
| 4033 Henley Rd #1707 Orlando, FL | 2.0 | 1.5 | 1164 | $1,500 | $1.29 | 21d | 1 | 0.12mi |
| 4255 Barwood Dr Orlando, FL | 1.0–3.0 | 1.0–2.5 | 1071 | $1,455 | $1.36 | 4d | 1 | 0.14mi |
| 2245 Lyme Bay Dr #1103 Orlando, FL | 2.0 | 1.5 | 1174 | $1,600 | $1.36 | 7d | 1 | 0.16mi |
| 3914 Crayrich Cir Unit GE Orlando, FL | 1.0 | 1.5 | 762 | $1,200 | $1.57 | 23d | 1 | 0.17mi |
| 4010 Dolomite St Unit A6 Orlando, FL | 1.0 | 1.5 | 762 | $1,200 | $1.57 | 14d | 1 | 0.18mi |
| 3977 Crayrich Cir Orlando, FL | 1.0 | 1.0 | 762 | $1,210 | $1.59 | 7d | 1 | 0.20mi |
| 3977 Crayrich Cir Unit C-1 Orlando, FL | 1.0 | 1.5 | 762 | $1,210 | $1.59 | 10d | 1 | 0.20mi |
| 4016 Woodfern Dr Unit B8 Orlando, FL | 2.0 | 2.5 | 1211 | $1,750 | $1.45 | 17d | 1 | 0.20mi |
| 3960 Crayrich Cir Orlando, FL | 1.0 | 2.0 | 762 | $1,150 | $1.51 | 23d | 1 | 0.23mi |
| 1831 Warringwood Dr Unit C4 Orlando, FL | 2.0 | 2.5 | 1211 | $1,200 | $0.99 | 23d | 1 | 0.26mi |
| 1835 Warringwood Dr Orlando, FL | 2.0 | 1.5 | 762 | $1,395 | $1.83 | 21d | 1 | 0.26mi |
| 1711 37th St Orlando, FL | 1.0 | 1.0 | 1485 | $1,250 | $0.84 | 7d | 1 | 0.28mi |
| 2418 Skan Ct Unit C Orlando, FL | 3.0 | 2.0 | 1308 | $1,825 | $1.40 | 23d | 1 | 0.28mi |
| 4405 S Texas Ave Orlando, FL | 2.0 | 2.0 | 1100 | $1,550 | $1.41 | 23d | 1 | 0.29mi |
| 4424 S Texas Ave Unit 1-2051-205 Orlando, FL | 2.0 | 2.0 | 900 | $1,750 | $1.94 | 2d | 1 | 0.35mi |
| 4424 S Texas Ave Unit 204 Orlando, FL | 2.0 | 2.0 | 900 | $1,900 | $2.11 | 10d | 1 | 0.35mi |
| 2482 Lakeway Branch Dr #904 Orlando, FL | 2.0 | 2.0 | 1227 | $1,625 | $1.32 | 23d | 1 | 0.35mi |
| 2482 Lakeway Branch Dr Orlando, FL | 2.0 | 2.0 | 1227 | $1,499 | $1.22 | 23d | 1 | 0.35mi |
| 1717 Holden Ave Orlando, FL | 1.0–3.0 | 1.0–2.5 | 980 | $1,424 | $1.45 | 2d | 26 | 0.53mi |
| 2225 Holden Ave #104 Orlando, FL | 2.0 | 2.0 | 1248 | $1,800 | $1.44 | 23d | 1 | 0.53mi |
| 2622 Lemon Tree Ln Unit 6-K Orlando, FL | 2.0 | 2.0 | 976 | $1,200 | $1.23 | 21d | 1 | 0.55mi |
| 1440 Holden Ave Unit B12 Orlando, FL | 2.0 | 2.0 | 970 | $1,500 | $1.55 | 23d | 1 | 0.57mi |
| 4746 Rio Grande Ave Orlando, FL | 1.0–3.0 | 1.0–2.0 | 920 | $1,574 | $1.71 | 2d | 40 | 0.61mi |
| 4749 S Texas Ave Unit 4749C Orlando, FL | 2.0 | 2.0 | 976 | $1,450 | $1.49 | 23d | 1 | 0.61mi |
| 1432 Holden Ave Unit C6 Orlando, FL | 2.0 | 2.0 | 970 | $1,500 | $1.55 | 23d | 1 | 0.62mi |
| 4733 S Texas Ave Unit 4733B Orlando, FL | 2.0 | 2.0 | 976 | $1,450 | $1.49 | 21d | 1 | 0.63mi |
| 4725 S Texas Ave Apt C Orlando, FL | 2.0 | 2.0 | 976 | $1,249 | $1.28 | 23d | 1 | 0.64mi |
| 3024 Rio Grande Ave Orlando, FL | 1.0–3.0 | 1.0–2.0 | 1058 | $1,290 | $1.22 | 23d | 1 | 0.64mi |
| 1406 Holden Ave Unit A10 Orlando, FL | 2.0 | 1.5 | 970 | $1,500 | $1.55 | 23d | 1 | 0.65mi |
| 4759 S Texas Ave Unit 4759C Orlando, FL | 2.0 | 2.0 | 976 | $1,450 | $1.49 | 16d | 1 | 0.66mi |
| 4767 S Texas Ave Unit 4767B Orlando, FL | 2.0 | 2.0 | 976 | $1,450 | $1.49 | 14d | 1 | 0.66mi |
| 1424 Holden Ave Unit 7 Orlando, FL | 2.0 | 1.5 | 970 | $1,250 | $1.29 | 14d | 1 | 0.67mi |
| 4791 S Texas Ave Orlando, FL | 2.0 | 2.0 | 976 | $1,300 | $1.33 | 23d | 1 | 0.67mi |
| 4795 S Texas Ave Unit 4795A Orlando, FL | 1.0 | 1.0 | 756 | $1,200 | $1.59 | 23d | 1 | 0.68mi |
| 2201 Metropolitan Way Orlando, FL | 2.0 | 2.0 | 874 | $1,475 | $1.69 | 3d | 1 | 0.68mi |
| 4779 S Texas Ave Unit 4779D Orlando, FL | 2.0 | 2.0 | 976 | $1,450 | $1.49 | 2d | 1 | 0.68mi |
| 4801 S Texas Ave Unit 4801D Orlando, FL | 1.0 | 1.0 | 756 | $1,200 | $1.59 | 23d | 1 | 0.68mi |
HOA detail condo
- Monthly dues
- $0 · $0/yr
- Likely covers
- internetsecurity
- Assessments
- None detected in remarks — confirm with the listing agent.
Listing history 17 events
-
2026-06-18days on market $134,000 Active 37 DOM
-
2026-06-17days on market $134,000 Active 36 DOM
-
2026-06-16days on market $134,000 Active 35 DOM
-
2026-06-15days on market $134,000 Active 34 DOM
-
2026-06-13days on market $134,000 Active 32 DOM
-
2026-06-13days on market $134,000 Active 31 DOM
-
2026-06-09days on market $134,000 Active 28 DOM
-
2026-06-08days on market $134,000 Active 27 DOM
-
2026-06-07days on market $134,000 Active 26 DOM
-
2026-06-04days on market $134,000 Active 23 DOM
-
2026-06-03days on market $134,000 Active 22 DOM
-
2026-06-02days on market $134,000 Active 21 DOM
-
2026-06-02days on market $134,000 Active 20 DOM
-
2026-05-31days on market $134,000 Active 19 DOM
-
2026-05-12$134,000 Active
-
2026-03-05price $134,000 525-char remark
Show marketing remark (525 chars)
JUST BRING YOUR GUITAR. Fully furnished 2 Bedroom 1 1/2 Bath CENTRAL A/C (3 YO) townhouse (VEHICLES AVAILABLE ALSO) (1982 Imperial Frank Sinatra Edition & 155CC PACE scooter) INCLUDES new 42 in TV, camera system security, wifi, new roof. Perfect retirement location close to downtown, WALMART & TARGET, 20 minutes to Disney or Universal, On 2 bus routes, loads of doctors great hospitals (PALMER & WOMANS). Last saw an inch of snow in 1979. Move in tomorrow just bring YOUR CLOTHES, SWIM SUIT AND SANDLES.
-
2026-01-21$150,000 Active 525-char remark
Show marketing remark (525 chars)
JUST BRING YOUR GUITAR. Fully furnished 2 Bedroom 1 1/2 Bath CENTRAL A/C (3 YO) townhouse (VEHICLES AVAILABLE ALSO) (1982 Imperial Frank Sinatra Edition & 155CC PACE scooter) INCLUDES new 42 in TV, camera system security, wifi, new roof. Perfect retirement location close to downtown, WALMART & TARGET, 20 minutes to Disney or Universal, On 2 bus routes, loads of doctors great hospitals (PALMER & WOMANS). Last saw an inch of snow in 1979. Move in tomorrow just bring YOUR CLOTHES, SWIM SUIT AND SANDLES.
ⓘ Source: listings_history table (triggers on properties + properties_extension) + one-shot
backfill from property_details.listing_events for pre-trigger history.
Climate risk First Street
- Flood 1/10 Low FEMA zone X (unshaded) · 0% chance over 30 yrs
- Wildfire 1/10 Low
- Heat 9/10 Extreme 7 d/yr ≥108°F today · 23 d/yr by 30 yrs out
- Wind 9/10 Extreme 99% chance of damaging wind over 30 yrs
- Air quality 1/10 Low 0 unhealthy d/yr today · 0 by 30 yrs out
Nearby sold comps map
Loading sold comps map…
Walkable amenities ~0.75 mi
Loading nearby amenities…
Taxation est. · year 1
- Rental income
- $17,881
- − Mortgage interest
- −$7,506
- − Property taxes
- −$2,010
- − Insurance
- −$670
- − Repairs & maintenance
- −$1,431
- − Management
- −$1,431
- − HOA
- −$4,200
- − Depreciation
- −$3,898
- Taxable loss
- −$3,264
- Est. tax savings @ 24.0%
- +$783
- After-tax cash flow
- $-403/yr
For passive investors: Depreciation is non-cash, so a rental often shows a tax loss while cash-flowing — sheltering income. Rental losses are passive: they offset passive income freely, and up to $25,000/yr can offset ordinary (W-2) income if you actively participate and your MAGI is under $100k (phasing out to $0 by $150k); unused losses carry forward. On sale, claimed depreciation is recaptured at up to 25%, and gains may owe capital-gains tax (a 1031 exchange can defer both). Figures are a year-1 estimate at your 24.0% rate — not tax advice; consult a CPA.
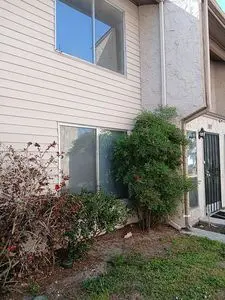
Condition & rehab AI · 1 photo
This property is in poor condition with extensive repairs and maintenance needed, including exterior, interior, and roof work. Landscaping and interior updates would significantly increase its value.
Repairs flagged
- Major exterior siding — Peeling paint and overgrown vegetation
- Major interior walls — No visible walls or paint
- Major flooring — No visible flooring
- Major roof — No visible roof, but the listing mentions a new roof
Value-add opportunities
- Both landscaping and exterior maintenance — Improving curb appeal and overall condition
- Both interior painting and flooring — Enhancing the interior appearance and condition
- Both replacing the roof — Ensuring the roof is in good condition and adding value
Renovation cost estimate screening
| Repair item | Severity | Est. cost |
|---|---|---|
| exterior siding · Peeling paint and overgrown vegetation | Major | $15,000–50,000 |
| interior walls · No visible walls or paint | Major | $15,000–50,000 |
| flooring · No visible flooring | Major | $15,000–50,000 |
| roof · No visible roof, but the listing mentions a new roof | Major | $15,000–50,000 |
| Total estimated repair cost · 4 items | $60,000–200,000 |
Value-add ROI direction
- Both landscaping and exterior maintenance — Improving curb appeal and overall condition ↑
- Both interior painting and flooring — Enhancing the interior appearance and condition ↑
- Both replacing the roof — Ensuring the roof is in good condition and adding value ↑
ⓘ Cost ranges are severity-bucket heuristics (US national rule-of-thumb). Get contractor quotes + a written scope before underwriting a rehab budget.
Schools (NCES district)
- District
- Orange
- NCES district ID
- 1201440
- Math proficiency
- 46% ▼ -9.00%
- Reading proficiency
- 51% ▼ -2.00%
- Median HH income
- $49,350
- Composite
- 41.47/100
- National rank
- #3461
- State rank
- #43 of 73 in FL
Livability — Orlando
- Score
- 86/100
- State rank
- #12
- US rank
- #360
Category grades
Schools grade is shown separately in the Schools card above.
Census & demographics
- County
- Orange County · 1,471,359 people
- City population
- 964,969
- Metro
- Orlando-Kissimmee-Sanford, FL
- Population (ZIP)
- 53,242
- Household income
- $47,313
- Rent vs Own
- Severe rent burden
- 5337.0
Population outlook (Orange County) Hauer SSP2
- Today (2025)
- 1,618,226 people
- By 2030
- 1,787,404 · +10.5%
- By 2040
- 2,125,621 · +31.4%
- By 2050
- 2,454,016 · +51.6%
- By 2075
- 3,173,711 · +96.1%
- By 2100
- 3,607,781 · +122.9%
Race, ethnicity, and origin ACS 2023
- Neighborhood character
- Diverse neighborhood (Simpson 0.69)
- Race & ethnicity
- Hispanic / Latino 39% Black 35% Two or more races 17% White 16% Asian 4%
- Hispanic origin (detail)
- Mexican 5% Puerto Rican 14% Cuban 2% Dominican 3%
- Common ancestry
- Hispanic 8% Estonian 1% Lithuanian 1%
- Foreign-born
- 30% · Canada, Jamaica, Vietnam
- Languages at home
- 51% English-only · Spanish 33% French/Haitian/Cajun 9% Other Indo-European 2%
Political lean MEDSL · Orange
- 2024 margin
- D (+13.6) · D 56.1% · R 42.5% · Other 1.3%
- 2008→2024 swing
- -5.0pp toward R · 2008: 18.6pp · 2024: 13.6pp
- All cycles
- 2024: D+13.6 2020: D+23.1 2016: D+24.6 2012: D+18.2 2008: D+18.6
Not yet ingested
- Civics
- —
Market trends
- HPI YoY
- ▼ -89.65%
- Current HPI
- 357.4828
- Rent YoY
- ▼ -0.50%
- Metro
- Orlando-Kissimmee-Sanford, FL
- State GDP YoY
- ▲ 3.28%
- F500 in state
- 36
Industry mix (Fortune 500 HQ in FL)
| Industry | F500 HQs | Revenue |
|---|---|---|
| Industrial Technology | 2 | $29B |
|
||
| Insurance | 2 | $17B |
|
||
| Retail | 1 | $60B |
|
||
| Technology Distribution | 1 | $58B |
|
||
| Homebuilding | 1 | $35B |
|
||
| Technology Manufacturing | 1 | $35B |
|
||
Price history
-10.7% since first listed3 events — show timeline
- 2026-05-12 Listed $134,000 FSBO.com
- 2026-03-05 Price Changed $134,000 ForSaleByOwner.com
- 2026-01-21 Listed $150,000 ForSaleByOwner.com
Cash-flow waterfall
monthlySold comps — $/sqft
last 12 mo · ≤1 miLoading sold comps…