 🏷️ Likely Rental
1541/1543 Hightower Ave S · Lehigh Acres, FL
Flood risk 1/10 · Minimal
- FEMA flood zone
- X (unshaded)
- Chance of flooding over 30 yrs
- 0.0%
- Est. flood insurance / yr
- $507 – $1,088
Fire risk 4/10 · Minor
- Est. fire insurance / yr
- $947 – $1,759
Heat risk 9/10 · Severe
- Hot days now (above 107°F)
- 7 days/yr
- Hot days in 30 yrs
- 28 days/yr
Wind risk 10/10 · Severe
- Chance of severe wind over 30 yrs
- 99.0%
Air-quality risk 2/10 · Minimal
- Unhealthy air days now
- 1 days/yr
- Unhealthy air days in 30 yrs
- 1 days/yr
Risk factors via First Street. Map © Google.
Why this score? — see what drove the C grade
The composite is a weighted blend of 9 inputs, each scored 0–100. Each bar is that input's sub-score; the figure is the points it added to the 100-point composite (weight × sub-score).
- Cash flow +19.1/30.0
- ARV discount +15.0/15.0
- DSCR +6.0/10.0
- 1% rule +5.1/10.0
- Schools +4.1/10.0
- Livability +3.0/5.0
- Condition / age +2.5/5.0
- Appreciation +0.8/10.0
- Rent growth +0.8/5.0
$350,000
🖨 Deal sheet 📄 Offer letter ✓ Due diligence
Multi-family units
County records classify this as Multi-Family (2-4 Unit). Listing-text estimate: 2 units. confirmed
Listing remarks
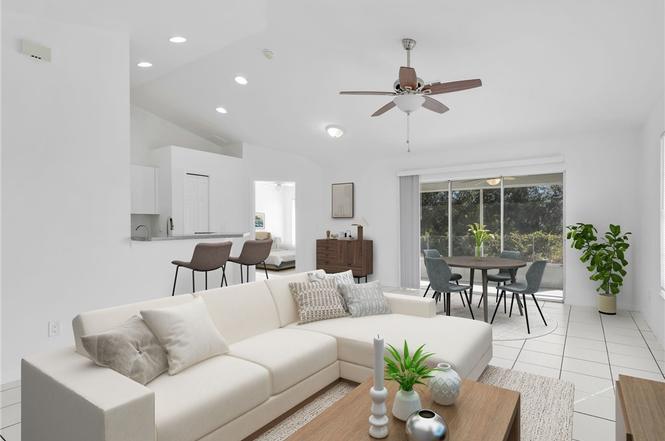
Seize the opportunity to own a piece of Florida’s fastest-growing corridor at an excellent price! This well-maintained duplex near Gunnery Road offers the ultimate flexibility: move into one side and let the other contribute to your mortgage, or hold it as a high-performing addition to your portfolio. Each unit features a spacious 3-bedroom, 2-bathroom layout with a modern open-concept floor plan designed to maximize natural light. Enjoy the Florida lifestyle with private screened lanais and fully fenced backyards on both sides—perfect for pets, play, or weekend BBQs. With one side currently secured with a tenant through March 2026, you have income from day one. Call to schedule
Key facts
- Open concept living
- Fenced yard
- Private lanai
Tags
Neighborhood map
What this means for you Summary
Snapshot
- This is a 2 × 3-bed/2.0-bath units multifamily listed at $350k.
Deal economics
- At list price, monthly cash flow is $370 ($4k/yr) — positive. Per door: $185/mo.
- The deal already cash-flows at list — no discount required.
- Meets the 1% rule at list price ($4k rent vs $350k).
- Cap rate 7.6% vs local median 4.7% in Lehigh Acres — top-decile yield for the area; either an underpriced asset or a hidden risk that comps aren't pricing in. Stress-test before assuming the spread holds.
Location & tenants
- Location reads 59/100 on livability (#826 in FL) — a working-class tenant base; expect higher turnover. Strengths: cost of living A+, housing A+; Watch: crime C-, employment D+, schools D-.
- Lee (suburban): math 47% / reading 50% proficiency, ranked #42 of 73 in FL (top 58%) — families likely to look elsewhere, expect single-tenant / working-renter base with shorter leases.
- Market conditions: Rents falling (-7.0%/yr); 292 active listings in the ZIP; 2 comparable units currently listed for rent nearby; 15,411 units permitted in Lee County in 2024 (4,686 in 5+ unit buildings).
- At $3,530/mo this rent would consume 70% of the median local household income ($61k/yr) (locally 1142% of renters already pay >50% of income on rent) — very limited rent-growth headroom before tenants either downsize or default.
Forward outlook
- Local home prices are declining (-3.0%/yr); year-one equity from $2k of loan paydown is wiped out by about $10k of value loss. Plan a longer hold.
- Lee County population projected at +44% by 2050 — long-run rental-demand tailwind backs the buy-and-hold thesis.
Negotiation context
- Only 6 days on market — expect competitive offers; lowballing is unlikely to land.
- 2 sale attempts with the ask held roughly flat each time — persistent listings suggest the price (not the market) is what's stuck; bring a comps-based counter.
Risks & watch-outs
- Climate carrying-cost: severe wind risk, 99% chance of damaging wind over 30y; extreme-heat days projected 7→28/yr by 2055 (HVAC capex compounding) — expect insurance premiums to compound above CPI over the hold.
Questions for the listing agent
- Can we see the unit-by-unit rent roll, current vacancy, and any below-market leases? What's the average tenancy length?
- What capital expenditures (roof, boiler, parking lot, exteriors) have been made in the last 5 years, and what's planned in the next 2?
- Is there a deadline driving the sale (1031 exchange, divorce, estate, relocation)? That informs how much negotiation room exists.
- Schools are D-rated, which usually means shorter tenancies and higher turnover. Who's the typical renter profile here, and what's been the actual vacancy rate?
- What's the average days-on-market for RENTAL listings here right now (not sales)? A rising rental-DOM trend means longer vacancies and softer asking-rent achievability than the comps imply.
- What's the recent tenant-quality profile in this submarket — average credit score on applications, eviction rate, late-payment / NSF rate, and stable-employment percentage? A property-management company in the area should have these aggregated.
- How much new apartment / multifamily construction is in the pipeline within 1–3 miles? Heavy new supply (>2% of stock underway) typically softens rents 12–24 months out; light construction supports rent growth.
Investment metrics
- 1% rule
- 1.01% ✓
- Cap rate
- 7.56%
- Cash-on-cash
- 4.53%
- DSCR
- 1.20
- GRM
- 8.3
CMA / ARV
- ARV (on-the-fly)
- $549,600
- Comps found
- 12
Show comp detail 12 sales within ~0.75 mi
| Address | Dist | Beds/Ba | Sqft | Sold | Price | $/sf | Match |
|---|---|---|---|---|---|---|---|
| 1541/1543 Hightower Ave S | 0.00mi | 6/4.0 | 2,400 (0%) | 2mo | $345,000 | $144 | 99 |
| 4525/4527 21st St SW | 0.24mi | 6/4.0 | 2,306 (-4%) | 6mo | $435,000 | $189 | 77 |
| 1121-1123 Harry Ave S | 0.40mi | 6/4.0 | 2,364 (-2%) | 10mo | $549,900 | $233 | 71 |
| 1116 Harold Ave S | 0.43mi | 6/4.0 | 2,360 (-2%) | 9mo | $550,000 | $233 | 70 |
| 22nd SW Unit 4417/4419 | 0.40mi | 6/4.0 | 2,396 (-0%) | 17mo | $550,000 | $230 | 67 |
| 4617-4619 30th St SW | 0.61mi | 6/4.0 | 2,392 (-0%) | 9mo | $550,000 | $230 | 63 |
| 4635/4633 27th St SW | 0.46mi | 6/4.0 | 2,226 (-7%) | 8mo | $392,000 | $176 | 60 |
| 725/727 Ivan Ave S | 0.57mi | 6/4.0 | 2,316 (-4%) | 15mo | $425,000 | $184 | 55 |
| 4452-4454 Golfview Blvd | 0.61mi | 6/4.0 | 2,400 (0%) | 20mo | $550,000 | $229 | 55 |
| 713-715 Homer Ave S #719 | 0.62mi | 6/4.0 | 2,360 (-2%) | 18mo | $549,900 | $233 | 53 |
| 4417/4419 28th St SW | 0.69mi | 6/4.0 | 2,350 (-2%) | 20mo | $535,000 | $228 | 48 |
| 724 Jenna Ave S | 0.63mi | 6/4.0 | 2,238 (-7%) | 20mo | $449,000 | $201 | 43 |
Match score weights: distance 35% · size 25% · config 20% · recency 20%. Top-matched comps best support the ARV.
Projected returns pro-forma
-3.0% appreciation · 0.0% rent growth · sell at horizon
- IRR
- -12.7%
- Equity multiple
- 0.56×
- Total profit
- $-43,446
- Equity at exit
- $52,186
- IRR
- -9.0%
- Equity multiple
- 0.52×
- Total profit
- $-47,257
- Equity at exit
- $30,262
Cash invested: $98,000 (down + closing). Projections, not guarantees.
Landlord ↔ Tenant lean methodology
- Overall (STATE)
- 87 Strongly Landlord-Friendly
- State Florida
- 87 Strongly Landlord-Friendly · R+3
- County
- — inherits STATE
- City
- — inherits STATE
ZIP-level market 33973
- Home prices YoY
- -3.4%
- Rents YoY
- -7.0%
- Active inventory
- 292
- Price-to-rent
- 16.5×
Monthly cashflow live
- Estimated rent
- $3,530 high interval (Pro) →
- Mortgage (P&I)
- −$1,835
- Tax est. 1.5%
- −$438 /mo · $5,250/yr
- Insurance
- −$146
- HOA
- −$0
- Vacancy / Maint / Mgmt
- −$741
- Net cashflow
- $370
Break-even live
2-unit breakdown (identical units grouped — click to expand)
| Units | Beds | Baths | Est. rent |
|---|---|---|---|
| 2× units | 3 | 2 | $3,530 |
| #1 | 3 | 2 | $1,765 |
| #2 | 3 | 2 | $1,765 |
| Total (2 units) | $3,530 | ||
UW: 25.0% down · 7.5% · 30yr · 1.5% tax · 5.0% vac · 8.0% maint · 8.0% mgmt
Financing live
Cash to close
- Down payment
- $87,500
- Closing costs
- $10,500
- Reserves months
- —
- Total cash needed
- —
Loan-product check · same deal, 3 products live
Conventional
25% down · 7.5% · 30yr
- Down + closing
- —
- Monthly P&I
- —
- Monthly cashflow
- —
- DSCR
- —
- Eligible?
- —
Personal DTI + credit; lowest rate.
DSCR
20% down · 8.5% · 30yr
- Down + closing
- —
- Monthly P&I
- —
- Monthly cashflow
- —
- DSCR
- —
- Eligible?
- —
No personal income docs; deal must DSCR.
Hard money
10% down · 12.0% · 12mo
- Down + closing
- —
- Monthly P&I
- —
- Monthly cashflow
- —
- DSCR
- —
- Eligible?
- —
Short-term bridge; refi at stabilization.
Rent comps 2 comps
| Address | Beds | Baths | Sqft | Rent | $/sqft | DOM | Units | Dist |
|---|---|---|---|---|---|---|---|---|
| 1133 Ichabod Ave Lehigh Acres, FL | 6.0 | 4.0 | 2376 | $2,100 | $0.88 | 24d | 1 | 0.29mi |
| 10849 Timber Creek Dr Fort Myers, FL | 5.0 | 4.5 | 3357 | $4,000 | $1.19 | 24d | 1 | 0.94mi |
Listing history 4 events
-
2026-02-24status Pending
-
2026-02-24status Active
-
2026-02-13status Pending
-
2026-02-07$350,000 Active
ⓘ Source: listings_history table (triggers on properties + properties_extension) + one-shot
backfill from property_details.listing_events for pre-trigger history.
Climate risk First Street
- Flood 1/10 Low FEMA zone X (unshaded) · 0% chance over 30 yrs
- Wildfire 4/10 Moderate
- Heat 9/10 Extreme 7 d/yr ≥107°F today · 28 d/yr by 30 yrs out
- Wind 10/10 Extreme 99% chance of damaging wind over 30 yrs
- Air quality 2/10 Low 1 unhealthy d/yr today · 1 by 30 yrs out
Nearby sold comps map
Loading sold comps map…
Walkable amenities ~0.75 mi
Loading nearby amenities…
Taxation est. · year 1
- Rental income
- $42,360
- − Mortgage interest
- −$19,605
- − Property taxes
- −$5,250
- − Insurance
- −$1,750
- − Repairs & maintenance
- −$3,389
- − Management
- −$3,389
- − Depreciation
- −$10,182
- Taxable loss
- −$1,205
- Est. tax savings @ 24.0%
- +$289
- After-tax cash flow
- $4,728/yr
For passive investors: Depreciation is non-cash, so a rental often shows a tax loss while cash-flowing — sheltering income. Rental losses are passive: they offset passive income freely, and up to $25,000/yr can offset ordinary (W-2) income if you actively participate and your MAGI is under $100k (phasing out to $0 by $150k); unused losses carry forward. On sale, claimed depreciation is recaptured at up to 25%, and gains may owe capital-gains tax (a 1031 exchange can defer both). Figures are a year-1 estimate at your 24.0% rate — not tax advice; consult a CPA.
Schools (NCES district)
- District
- Lee
- NCES district ID
- 1201080
- Math proficiency
- 47% ▼ -11.00%
- Reading proficiency
- 50% ▼ -4.00%
- Median HH income
- $49,518
- Composite
- 41.49/100
- National rank
- #3458
- State rank
- #42 of 73 in FL
Livability — Lehigh Acres
- Score
- 59/100
- State rank
- #826
- US rank
- #20055
Category grades
Schools grade is shown separately in the Schools card above.
Census & demographics
- Census place
- Lehigh Acres, FL
- County
- Lee County · 788,662 people
- City population
- 130,638
- Metro
- Cape Coral-Fort Myers, FL
- Population (ZIP)
- 14,392
- Household income
- $60,530
- Rent vs Own
- Severe rent burden
- 1142.0
Population outlook (Lee County) Hauer SSP2
- Today (2025)
- 871,946 people
- By 2030
- 955,468 · +9.6%
- By 2040
- 1,113,587 · +27.7%
- By 2050
- 1,256,891 · +44.1%
- By 2075
- 1,560,270 · +78.9%
- By 2100
- 1,726,848 · +98.0%
Race, ethnicity, and origin ACS 2023
- Neighborhood character
- Diverse neighborhood (Simpson 0.67)
- Race & ethnicity
- Hispanic / Latino 41% Black 36% Two or more races 21% White 18%
- Hispanic origin (detail)
- Mexican 21% Puerto Rican 7% Cuban 4% Dominican 1%
- Common ancestry
- Hispanic 14% Russian 1% Estonian 1%
- Foreign-born
- 23% · Canada, China
- Languages at home
- 54% English-only · Spanish 31% French/Haitian/Cajun 13% Other Indo-European 1%
Political lean MEDSL · Lee
- 2024 margin
- Strong R (+28.4) · D 35.5% · R 63.9%
- 2008→2024 swing
- -18.0pp toward R · 2008: -10.4pp · 2024: -28.4pp
- All cycles
- 2024: R+28.4 2020: R+19.2 2016: R+20.4 2012: R+16.6 2008: R+10.4
Not yet ingested
- Civics
- —
Market trends
- HPI YoY
- ▼ -8.43%
- Current HPI
- 237.694
- Rent YoY
- ▼ -6.99%
- Metro
- Cape Coral-Fort Myers, FL
- State GDP YoY
- ▲ 3.28%
- F500 in state
- 36
Industry mix (Fortune 500 HQ in FL)
| Industry | F500 HQs | Revenue |
|---|---|---|
| Industrial Technology | 2 | $29B |
|
||
| Insurance | 2 | $17B |
|
||
| Retail | 1 | $60B |
|
||
| Technology Distribution | 1 | $58B |
|
||
| Homebuilding | 1 | $35B |
|
||
| Technology Manufacturing | 1 | $35B |
|
||
Price history
4 events — show timeline
- 2026-02-24 Pending — FORTMLS
- 2026-02-24 Relisted — FORTMLS
- 2026-02-13 Pending — FORTMLS
- 2026-02-07 Listed $350,000 FORTMLS
Cash-flow waterfall
monthlySold comps — $/sqft
last 12 mo · ≤1 miLoading sold comps…