 🏷️ Likely Rental
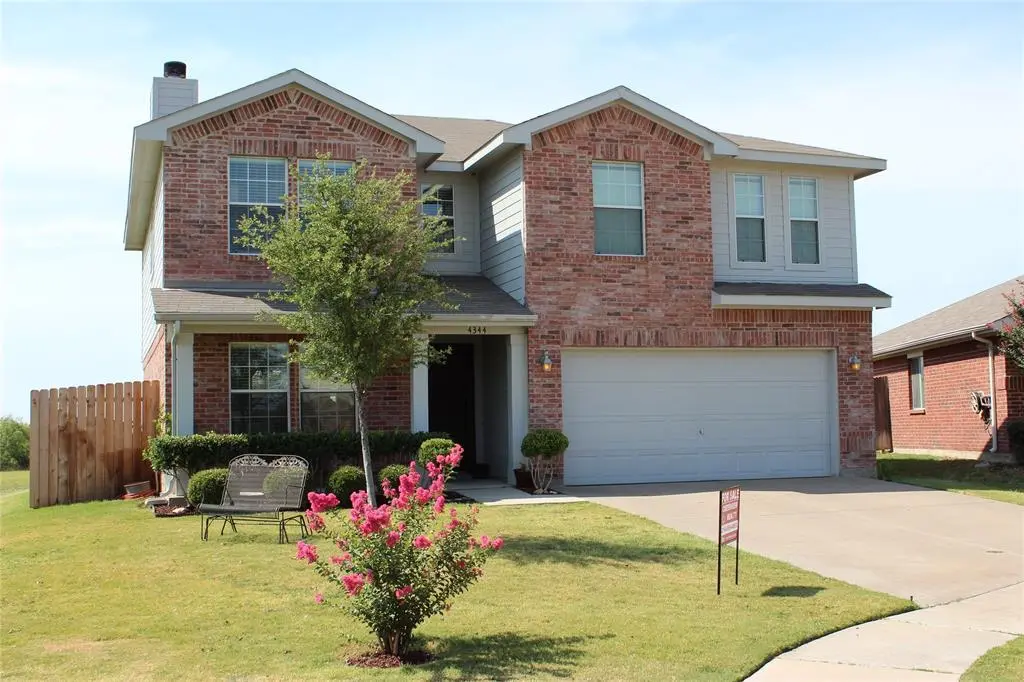
4344 Silverwood Trl · Fort Worth, TX
Flood risk 1/10 · Minimal
- FEMA flood zone
- X (unshaded)
- Chance of flooding over 30 yrs
- 0.0%
- Est. flood insurance / yr
- $507 – $1,088
Fire risk 3/10 · Minor
- Est. fire insurance / yr
- $1,222 – $2,270
Heat risk 7/10 · Major
- Hot days now (above 109°F)
- 7 days/yr
- Hot days in 30 yrs
- 24 days/yr
Wind risk 4/10 · Minor
- Chance of severe wind over 30 yrs
- 23.0%
Air-quality risk 4/10 · Minor
- Unhealthy air days now
- 4 days/yr
- Unhealthy air days in 30 yrs
- 5 days/yr
Risk factors via First Street. Map © Google.
Why this score? — see what drove the D+ grade
The composite is a weighted blend of 9 inputs, each scored 0–100. Each bar is that input's sub-score; the figure is the points it added to the 100-point composite (weight × sub-score).
- Cash flow +15.0/30.0
- ARV discount +7.5/15.0
- 1% rule +5.0/10.0
- DSCR +5.0/10.0
- Schools +4.8/10.0
- Livability +4.0/5.0
- Rent growth +2.7/5.0
- Condition / age +2.5/5.0
- Appreciation +0.0/10.0
$2,350
🖨 Deal sheet 📄 Offer letter ✓ Due diligence
Listing remarks MLS
Absolutely Beautiful BREATHTAKING views located on greenbelt and on a premium corner cul-de-sac in the highly-desired Keller ISD! Walking Trails, Parks, and a Pond with Fountain are right out the front door. Owners selling only because husband was transferred. Optimal location, close to Alliance Shopping, Restaurants, and Movies. 2 Living, 2 Dining, SS Appliances, Cherry Cabinets, HUGE Master BR & Closet, Jetted Tub, Huge Backyard!
Key facts
- Pergola
- Fenced backyard
- 6,186 sq ft lot
Tags
Property features AI
Finance
- Other: Property type: Residential single family; Restrictions: None
- HOA & community: Mandatory association with annual fee (management fees included); HOA managed by SpectrumAM.com (contact available)
Exterior
- Parking: 1-car garage (approximately 19' x 19'); Additional covered storage in parking area
- Security: Security system
- Utilities: City water; City sewer; Not in a municipal utility district
- Home design: Single family residence; Two stories; Not attached; Built in 2006; Security system installed; Subdivision: Heritage Glen Add
- Construction: Brick and siding exterior; Preowned home (built 2006)
- Exterior features: Wood fencing (fenced yard); Lot under 0.5 acre
Interior
- Kitchen: Built-in cabinets; Eat-in kitchen layout; Kitchen island; Walk-in pantry; Dishwasher; Disposal; Electric cooktop; Electric oven; Microwave; Vented exhaust fan
- Bedrooms: 3 bedrooms (primary suite on second level with sitting area and walk-in closet)
- Flooring: Ceramic tile; Luxury vinyl plank
- Bathrooms: 3 bathrooms total (2 full, 1 half); Primary bath with dual sinks, separate shower, jetted tub, linen closet, and medicine cabinet
- Heating & cooling: Central heating (electric); Central air conditioning (electric)
- Interior features: Cedar closets; Kitchen island; Pantry; Walk-in closets; Two living areas; One dining area; Room count: 8; Two levels
- Laundry & utility: Utility room on first level
Neighborhood map
What this means for you Summary
Snapshot
- This is a 3-bed/2.0-bath single-family listed at $2k.
Deal economics
- At list price, monthly cash flow is $2k ($23k/yr) — positive.
- The deal already cash-flows at list — no discount required.
- Meets the 1% rule at list price ($2k rent vs $2k).
- Cap rate 969.6% vs local median 3.9% in Fort Worth — top-decile yield for the area; either an underpriced asset or a hidden risk that comps aren't pricing in. Stress-test before assuming the spread holds.
Location & tenants
- Location reads 80/100 on livability (#49 in TX, #1,954 nationally) — a professional / high-income tenant draw. Strengths: amenities A+, cost of living A+, housing A+; Watch: crime F.
- Keller ISD (urban): math 50% / reading 54% proficiency, ranked #91 of 826 in TX (top 11%) — acceptable for families but not a draw, mixed tenant base, ~2y average lease; only 19% free/reduced lunch — higher-income household profile.
- Zoned schools: Bette Perot El (math 57% / reading 67%, grade B, #321 of 4,322 statewide, top 8%, 576 students, 23% FRL) — zoned schools at 23% FRL track the district average.
- Market conditions: Rents flat; 341 active listings in the ZIP; 40 comparable units currently listed for rent nearby; rentals at typical pace (median 21d on market — plan ~3-4 weeks tenant-placement turnaround); high-income renter base; 18,938 units permitted in Tarrant County in 2024 (8,336 in 5+ unit buildings).
Forward outlook
- Local home prices are declining (-3.0%/yr); year-one equity from $16 of loan paydown is wiped out by about $70 of value loss. Plan a longer hold.
- Tarrant County population projected at +41% by 2050 — long-run rental-demand tailwind backs the buy-and-hold thesis.
- At projected returns (-3.0% appreciation + 0.7% rent growth), your $658 cash investment doubles in ~1 year — after that, you're playing with house money.
Negotiation context
- Only 4 days on market — expect competitive offers; lowballing is unlikely to land.
- 4 sale attempts since 15y ago with the ask held roughly flat each time — persistent listings suggest the price (not the market) is what's stuck; bring a comps-based counter.
Risks & watch-outs
- Climate carrying-cost: extreme-heat days projected 7→24/yr by 2055 (HVAC capex compounding) — expect insurance premiums to compound above CPI over the hold.
Questions for the listing agent
- Is there a deadline driving the sale (1031 exchange, divorce, estate, relocation)? That informs how much negotiation room exists.
- Schools are D-rated, which usually means shorter tenancies and higher turnover. Who's the typical renter profile here, and what's been the actual vacancy rate?
- Crime grade is F in this area — have there been break-ins, vandalism, or insurance claims at this property in the last 3 years? What carrier currently insures it and at what premium?
- The area grade is low — what's the realistic commute time and amenity access for the typical tenant pool here? Any planned neighborhood developments (good or bad) we should know about?
- What's the average days-on-market for RENTAL listings here right now (not sales)? A rising rental-DOM trend means longer vacancies and softer asking-rent achievability than the comps imply.
- What's the recent tenant-quality profile in this submarket — average credit score on applications, eviction rate, late-payment / NSF rate, and stable-employment percentage? A property-management company in the area should have these aggregated.
- How much new for-sale + rental construction is in the pipeline within 1–3 miles? Heavy new supply typically softens prices + rents 12–24 months out; constrained supply supports both.
Investment metrics
- 1% rule
- 102.49% ✓
- Cap rate
- 969.64%
- Cash-on-cash
- 3440.51%
- DSCR
- 154.08
- GRM
- 0.1
CMA / ARV
- ARV (on-the-fly)
- $392,547
- Comps found
- 12
Show comp detail 12 sales within ~0.75 mi
| Address | Dist | Beds/Ba | Sqft | Sold | Price | $/sf | Match |
|---|---|---|---|---|---|---|---|
| 8929 Brook Hill Ln | 0.16mi | 3/2.0 | 2,098 (-4%) | 2mo | $375,000 | $179 | 84 |
| 4852 Aidan Ct | 0.60mi | 3/2.0 | 2,185 (-0%) | 1mo | $439,900 | $201 | 71 |
| 4808 Grinstein Dr | 0.52mi | 3/2.0 | 2,119 (-3%) | 1mo | $399,900 | $189 | 69 |
| 4128 Gladney Ln | 0.34mi | 4/2.0 (+1) | 1,926 (-12%) | 1mo | $305,000 | $158 | 58 |
| 8716 Golden Sunset Trl | 0.49mi | 4/2.5 (+1) | 1,986 (-9%) | 0mo | $355,000 | $179 | 54 |
| 8828 Night Wind Ln | 0.34mi | 4/2.5 (+1) | 2,500 (+14%) | 1mo | $345,000 | $138 | 53 |
| 4045 Diamond Ridge Dr | 0.40mi | 4/2.0 (+1) | 1,879 (-14%) | 0mo | $345,000 | $184 | 52 |
| 3813 Tidball Dr | 0.61mi | 4/2.0 (+1) | 2,002 (-9%) | 1mo | $373,000 | $186 | 51 |
| 4845 Cliburn Dr | 0.62mi | 4/2.0 (+1) | 2,380 (+8%) | 2mo | $439,000 | $184 | 51 |
| 4009 Summerhill Ln | 0.49mi | 4/2.5 (+1) | 2,498 (+14%) | 1mo | $349,900 | $140 | 46 |
| 4840 Valley Springs Trl | 0.70mi | 4/2.5 (+1) | 2,387 (+9%) | 1mo | $369,999 | $155 | 44 |
| 4117 Chelan Ct | 0.64mi | 4/2.0 (+1) | 1,914 (-13%) | 1mo | $315,000 | $165 | 44 |
Match score weights: distance 35% · size 25% · config 20% · recency 20%. Top-matched comps best support the ARV.
Projected returns pro-forma
-3.0% appreciation · 0.65% rent growth · sell at horizon
- IRR
- —
- Equity multiple
- 174.63×
- Total profit
- $114,246
- Equity at exit
- $350
- IRR
- —
- Equity multiple
- 354.44×
- Total profit
- $232,566
- Equity at exit
- $203
Cash invested: $658 (down + closing). Projections, not guarantees.
Landlord ↔ Tenant lean methodology
- Overall (STATE)
- 87 Strongly Landlord-Friendly
- State Texas
- 87 Strongly Landlord-Friendly · R+5
- County
- — inherits STATE
- City
- — inherits STATE
ZIP-level market 76244
- Home prices YoY
- -11.5%
- Rents YoY
- 0.7%
- Active inventory
- 341
- Price-to-rent
- 0.1×
Monthly cashflow live
- Estimated rent
- $2,409 high interval (Pro) →
- Mortgage (P&I)
- −$12
- Tax est. 1.5%
- −$3 /mo · $35/yr
- Insurance
- −$1
- HOA
- −$0
- Vacancy / Maint / Mgmt
- −$506
- Net cashflow
- $1,887
Break-even live
UW: 25.0% down · 7.5% · 30yr · 1.5% tax · 5.0% vac · 8.0% maint · 8.0% mgmt
Financing live
Cash to close
- Down payment
- $588
- Closing costs
- $70
- Reserves months
- —
- Total cash needed
- —
Loan-product check · same deal, 3 products live
Conventional
25% down · 7.5% · 30yr
- Down + closing
- —
- Monthly P&I
- —
- Monthly cashflow
- —
- DSCR
- —
- Eligible?
- —
Personal DTI + credit; lowest rate.
DSCR
20% down · 8.5% · 30yr
- Down + closing
- —
- Monthly P&I
- —
- Monthly cashflow
- —
- DSCR
- —
- Eligible?
- —
No personal income docs; deal must DSCR.
Hard money
10% down · 12.0% · 12mo
- Down + closing
- —
- Monthly P&I
- —
- Monthly cashflow
- —
- DSCR
- —
- Eligible?
- —
Short-term bridge; refi at stabilization.
Rent comps 40 comps
| Address | Beds | Baths | Sqft | Rent | $/sqft | DOM | Units | Dist |
|---|---|---|---|---|---|---|---|---|
| 4344 Silverwood Trl Fort Worth, TX | 3.0 | 2.5 | 2265 | $2,350 | $1.04 | 8d | 1 | 0.03mi |
| 4405 Centennial Ct Fort Worth, TX | 4.0 | 2.5 | 2397 | $2,450 | $1.02 | 24d | 1 | 0.06mi |
| 4313 Silverwood Trl Fort Worth, TX | 4.0 | 2.5 | 2362 | $2,300 | $0.97 | 8d | 1 | 0.09mi |
| 9209 Centennial Dr Fort Worth, TX | 4.0 | 2.5 | 2401 | $2,300 | $0.96 | 44d | 1 | 0.11mi |
| 9004 Brook Hill Ln Fort Worth, TX | 4.0 | 2.5 | 3000 | $2,800 | $0.93 | 24d | 1 | 0.15mi |
| 9224 Monument Ct Fort Worth, TX | 3.0 | 2.0 | 1591 | $2,095 | $1.32 | 21d | 1 | 0.19mi |
| 9001 N Beach St Fort Worth, TX | 1.0–3.0 | 1.0–2.0 | 1099 | $2,672 | $2.43 | 44d | 33 | 0.22mi |
| 9032 Heartwood Dr Fort Worth, TX | 3.0 | 2.0 | 1757 | $2,200 | $1.25 | 44d | 1 | 0.35mi |
| 9221 Goldenview Dr Fort Worth, TX | 4.0 | 2.0 | 1830 | $2,499 | $1.37 | 8d | 1 | 0.37mi |
| 8801 Granite Path Fort Worth, TX | 3.0 | 2.5 | 2300 | $900 | $0.39 | 24d | 1 | 0.39mi |
| 9328 Goldenview Dr Fort Worth, TX | 4.0 | 2.0 | 1866 | $2,150 | $1.15 | 15d | 1 | 0.40mi |
| 8724 Limestone Dr Fort Worth, TX | 3.0 | 2.0 | 1607 | $2,120 | $1.32 | 21d | 1 | 0.44mi |
| 8833 Sunset Trace Dr Fort Worth, TX | 4.0 | 2.0 | 1916 | $2,750 | $1.44 | 19d | 1 | 0.56mi |
| 3900 Summerhill Ln Fort Worth, TX | 3.0 | 2.0 | 1947 | $2,100 | $1.08 | 2d | 1 | 0.58mi |
| 4841 Jodi Dr Fort Worth, TX | 4.0 | 2.0 | 2026 | $2,400 | $1.18 | 15d | 1 | 0.63mi |
| 9112 Steiner St Fort Worth, TX | 4.0 | 2.0 | 2404 | $3,000 | $1.25 | 15d | 1 | 0.63mi |
| 8729 Sunset Trace Dr Fort Worth, TX | 4.0 | 2.5 | 2338 | $2,400 | $1.03 | 8d | 1 | 0.66mi |
| 8640 Rainy Lake Dr Fort Worth, TX | 4.0 | 2.0 | 1888 | $2,150 | $1.14 | 8d | 1 | 0.70mi |
| 8705 Sunset Trace Dr Fort Worth, TX | 3.0 | 2.0 | 2044 | $2,395 | $1.17 | 8d | 1 | 0.71mi |
| 8705 Sunset Trace Dr Fort Worth, TX | 3.0 | 2.0 | 2044 | $2,395 | $1.17 | 2d | 1 | 0.71mi |
| 9120 Rose Ct Fort Worth, TX | 4.0 | 2.0 | 2197 | $2,695 | $1.23 | 5d | 1 | 0.74mi |
| 8832 Stirrup Way Fort Worth, TX | 3.0 | 2.0 | 1812 | $2,300 | $1.27 | 24d | 1 | 0.75mi |
| 9021 Georgetown Pl Fort Worth, TX | 4.0 | 2.0 | 2311 | $2,450 | $1.06 | 8d | 1 | 0.75mi |
| 3916 Big Thicket Dr Fort Worth, TX | 3.0 | 2.0 | 1581 | $2,000 | $1.27 | 44d | 1 | 0.75mi |
| 4917 Stirrup Way Fort Worth, TX | 3.0 | 2.0 | 1592 | $2,006 | $1.26 | 22d | 1 | 0.81mi |
| 8609 Muir Dr Fort Worth, TX | 3.0 | 2.5 | 2400 | $2,895 | $1.21 | 8d | 1 | 0.82mi |
| 4937 Spur Ridge Ct Fort Worth, TX | 3.0 | 2.0 | 1525 | $2,395 | $1.57 | 44d | 1 | 0.85mi |
| 8655 Sumter Way Fort Worth, TX | 4.0 | 2.0 | 1864 | $2,100 | $1.13 | 44d | 1 | 0.85mi |
| 4116 Fossile Butte Dr Fort Worth, TX | 3.0 | 2.0 | 1824 | $2,500 | $1.37 | 44d | 1 | 0.85mi |
| 3925 Cane River Rd Fort Worth, TX | 3.0 | 3.0 | 2112 | $2,375 | $1.12 | 44d | 1 | 0.89mi |
| 4725 Bristol Trace Trl Fort Worth, TX | 4.0 | 2.0 | 2341 | $2,795 | $1.19 | 44d | 1 | 0.89mi |
| 8808 Chaps Ave Fort Worth, TX | 3.0 | 2.0 | 2000 | $2,295 | $1.15 | 15d | 1 | 0.91mi |
| 5009 Holliday Dr Fort Worth, TX | 3.0 | 2.0 | 1799 | $2,599 | $1.44 | 44d | 1 | 0.95mi |
| 5020 Nash Ln Fort Worth, TX | 3.0 | 2.0 | 1861 | $2,550 | $1.37 | 5d | 1 | 0.99mi |
| 8604 Stetson Dr Fort Worth, TX | 4.0 | 2.0 | 1741 | $2,250 | $1.29 | 8d | 1 | 1.01mi |
| 3405 Alliance Town Ctr Fort Worth, TX | 1.0–3.0 | 1.0–3.0 | 1323 | $3,585 | $2.71 | 1d | 34 | 1.01mi |
| 4820 Western Meadows Ct Fort Worth, TX | 3.0 | 2.0 | 1843 | $1,995 | $1.08 | 44d | 1 | 1.04mi |
| 9216 Askew St Fort Worth, TX | 4.0 | 4.0 | 2917 | $1,300 | $0.45 | 5d | 1 | 1.05mi |
| 5117 Meridian Ln Fort Worth, TX | 3.0 | 2.0 | 1940 | $2,100 | $1.08 | 24d | 1 | 1.06mi |
| 5109 Keating St Fort Worth, TX | 3.0 | 2.0 | 1886 | $2,700 | $1.43 | 44d | 1 | 1.07mi |
Listing history 4 events
-
2026-06-09days on market $2,350 Active 4 DOM
-
2026-06-08days on market $2,350 Active 3 DOM
-
2026-06-07remarks 462-char remark
-
2026-06-07$2,350 Active 2 DOM
ⓘ Source: listings_history table (triggers on properties + properties_extension) + one-shot
backfill from property_details.listing_events for pre-trigger history.
Climate risk First Street
- Flood 1/10 Low FEMA zone X (unshaded) · 0% chance over 30 yrs
- Wildfire 3/10 Moderate
- Heat 7/10 Severe 7 d/yr ≥109°F today · 24 d/yr by 30 yrs out
- Wind 4/10 Moderate 23% chance of damaging wind over 30 yrs
- Air quality 4/10 Moderate 4 unhealthy d/yr today · 5 by 30 yrs out
Nearby sold comps map
Loading sold comps map…
Walkable amenities ~0.75 mi
Loading nearby amenities…
Taxation est. · year 1
- Rental income
- $28,903
- − Mortgage interest
- −$132
- − Property taxes
- −$35
- − Insurance
- −$12
- − Repairs & maintenance
- −$2,312
- − Management
- −$2,312
- − Depreciation
- −$68
- Taxable income
- $24,032
- Est. tax owed @ 24.0%
- −$5,768
- After-tax cash flow
- $16,871/yr
For passive investors: Depreciation is non-cash, so a rental often shows a tax loss while cash-flowing — sheltering income. Rental losses are passive: they offset passive income freely, and up to $25,000/yr can offset ordinary (W-2) income if you actively participate and your MAGI is under $100k (phasing out to $0 by $150k); unused losses carry forward. On sale, claimed depreciation is recaptured at up to 25%, and gains may owe capital-gains tax (a 1031 exchange can defer both). Figures are a year-1 estimate at your 24.0% rate — not tax advice; consult a CPA.
Schools (NCES district)
- District
- Keller ISD
- NCES district ID
- 4825260
- Math proficiency
- 50% ▼ -14.00%
- Reading proficiency
- 54% ▼ -9.00%
- Median HH income
- $92,106
- Composite
- 48.46/100
- National rank
- #2131
- State rank
- #91 of 826 in TX
Livability — Fort Worth
- Score
- 80/100
- State rank
- #49
- US rank
- #1954
Category grades
Schools grade is shown separately in the Schools card above.
Census & demographics
- Census place
- Fort Worth, TX
- County
- Tarrant County · 2,033,669 people
- City population
- 911,619
- Metro
- Dallas-Fort Worth-Arlington, TX
- Population (ZIP)
- 76,728
- Household income
- $122,217
- Rent vs Own
- Severe rent burden
- 1419.0
Population outlook (Tarrant County) Hauer SSP2
- Today (2025)
- 2,380,417 people
- By 2030
- 2,578,900 · +8.3%
- By 2040
- 2,974,995 · +25.0%
- By 2050
- 3,350,489 · +40.8%
- By 2075
- 4,216,909 · +77.2%
- By 2100
- 4,741,527 · +99.2%
Race, ethnicity, and origin ACS 2023
- Neighborhood character
- Diverse neighborhood (Simpson 0.59)
- Race & ethnicity
- White 60% Hispanic / Latino 17% Two or more races 10% Black 10% Asian 9%
- Hispanic origin (detail)
- Mexican 11% Puerto Rican 1%
- Common ancestry
- Italian 2% Slovak 2% Lithuanian 2%
- Foreign-born
- 13% · Canada, Vietnam, Jamaica
- Languages at home
- 80% English-only · Spanish 9% Other Indo-European 5% Other Asian/Pacific 2%
Political lean MEDSL · Tarrant
- 2024 margin
- Lean R (+5.1) · D 46.7% · R 51.9% · Other 1.4%
- 2008→2024 swing
- +6.6pp toward D · 2008: -11.7pp · 2024: -5.1pp
- All cycles
- 2024: R+5.1 2020: D+0.2 2016: R+8.7 2012: R+15.7 2008: R+11.7
Not yet ingested
- Civics
- —
Market trends
- HPI YoY
- ▼ -32.25%
- Current HPI
- 249.0762
- Rent YoY
- ▲ 0.65%
- Metro
- Dallas-Fort Worth-Arlington, TX
- State GDP YoY
- ▲ 3.95%
- F500 in state
- 110
Industry mix (Fortune 500 HQ in TX)
| Industry | F500 HQs | Revenue |
|---|---|---|
| Energy | 16 | $1,198B |
|
||
| Technology | 5 | $198B |
|
||
| Engineering / Construction | 4 | $72B |
|
||
| Energy Services | 3 | $60B |
|
||
| Utilities | 3 | $41B |
|
||
| Healthcare | 2 | $330B |
|
||
Price history
-98.3% since first listed14 events — show timeline
- 2026-06-05 Listed $2,350 NTREIS
- 2024-08-01 Rental Removed $2,400 NTREIS
- 2024-07-15 Listed for Rent $2,400 NTREIS
- 2013-08-14 Sold (Public Records) — Public Records
- 2013-08-09 Sold (MLS) — NTREIS
- 2013-07-16 Pending — NTREIS
- 2013-07-06 Contingent — NTREIS
- 2013-06-28 Price Changed $154,999 NTREIS
- 2013-06-18 Listed $158,000 NTREIS
- 2011-04-05 Sold (Public Records) — Public Records
- 2011-03-31 Sold (MLS) — NTREIS
- 2011-03-14 Pending — NTREIS
- 2011-03-08 Contingent — NTREIS
- 2011-02-25 Listed $140,000 NTREIS
Property tax history
+4.4%/yrLatest (2025): $7,634 · -4.9% YoY. Source: county tax records.
Cash-flow waterfall
monthlySold comps — $/sqft
last 12 mo · ≤1 miLoading sold comps…