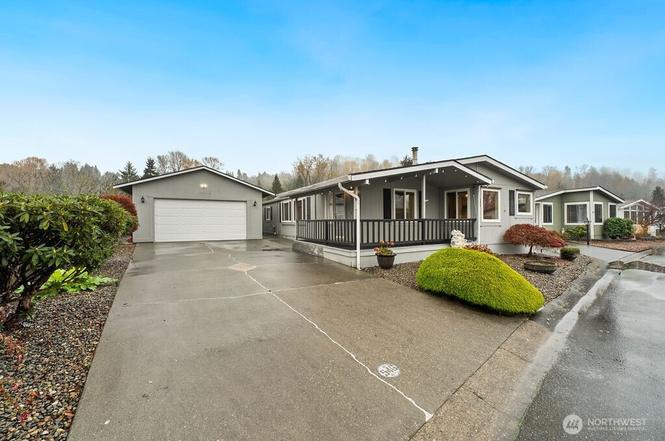
1402 22nd St NE #546 · Auburn, WA
Flood risk 6/10 · Moderate
- FEMA flood zone
- X (unshaded)
- Chance of flooding over 30 yrs
- 0.27%
- Est. flood insurance / yr
- $507 – $1,088
Fire risk 1/10 · Minimal
- Est. fire insurance / yr
- $604 – $1,122
Heat risk 4/10 · Minor
- Hot days now (above 87°F)
- 7 days/yr
- Hot days in 30 yrs
- 16 days/yr
Wind risk 1/10 · Minimal
- Chance of severe wind over 30 yrs
- —
Air-quality risk 7/10 · Major
- Unhealthy air days now
- 10 days/yr
- Unhealthy air days in 30 yrs
- 11 days/yr
Risk factors via First Street. Map © Google.
Why this score? — see what drove the C- grade
The composite is a weighted blend of 9 inputs, each scored 0–100. Each bar is that input's sub-score; the figure is the points it added to the 100-point composite (weight × sub-score).
- Cash flow +20.6/30.0
- DSCR +6.5/10.0
- ARV discount +5.6/15.0
- 1% rule +5.4/10.0
- Schools +4.7/10.0
- Livability +4.0/5.0
- Rent growth +2.9/5.0
- Condition / age +2.5/5.0
- Appreciation +0.0/10.0
$211,888
🖨 Deal sheet (PDF) 📄 Offer letter ✓ Due diligence
Listing remarks
Rare opportunity in a desirable 55+ community! This spacious 1,848 sq. ft. Silvercrest home offers comfort, functionality, and exceptional storage—perfect for relaxed, low-maintenance living. Recent updates include fresh interior paint, new tile flooring in the bathroom, and freshly cleaned carpeting, creating a bright and welcoming atmosphere throughout. Enjoy the convenience of a 2-car garage, a large workshop, and an additional storage shed, providing ample space for hobbies, projects, and storage needs. The open great room flows seamlessly into the dining area and features a cozy woodstove, perfect for cool evenings and AC for summer. The generous kitchen offers beautiful oak cabi
Key facts
- Generous kitchen
- Oak cabinets
- Large workshop
Tags
Property features AI
Finance
- Other: Land lease amount: $1,241
- Financial info: Listing terms: Cash or Conventional
- HOA & community: Senior community; Park name: Rio Verde; Park amenities: BBQs, clubhouse, exercise room, pool, RV parking, security gate; Land lease amount
Exterior
- Parking: Individual garage (has garage)
- Security: Security gate (community and property); Community security gate
- Utilities: Electric power; Community water; Community sewer; Power provided by PSE
- Home design: Manufactured double-wide home; One level; Residential property in good condition; Silvercrest make; Mobile home remains
- Construction: Metal/vinyl construction materials; Composition roof
- Exterior features: Metal/vinyl exterior; Corner lot; Paved lot; Patio/Porch/Deck
Interior
- Kitchen: Dishwasher; Refrigerator; Stove/Range
- Bedrooms: 3 bedrooms
- Flooring: Laminate flooring; Carpet
- Bathrooms: 1 full bathroom; 1 three-quarter bathroom
- Heating & cooling: Forced air heating; Heat pump (heating and cooling)
- Interior features: Wood-burning fireplace; Patio/Porch/Deck; Walk-in closet
- Laundry & utility: Washer; Dryer
Neighborhood map
What this means for you Summary
Snapshot
- This is a 3-bed/2.0-bath manufactured listed at $212k.
Deal economics
- At list price, monthly cash flow is $281 ($3k/yr) — positive.
- The deal already cash-flows at list — no discount required.
- Meets the 1% rule at list price ($2k rent vs $212k).
- Recommended offer: $186k (12.0% below list) — sets the bar for market timing.
- Cap rate 7.9% vs local median 2.7% in Auburn — top-decile yield for the area; either an underpriced asset or a hidden risk that comps aren't pricing in. Stress-test before assuming the spread holds.
Location & tenants
- Location reads 81/100 on livability (#75 in WA, #1,371 nationally) — a professional / high-income tenant draw. Strengths: amenities A+, commute A+, employment A+; Watch: crime F, cost of living F.
- Auburn School District (urban): math 47% / reading 56% proficiency, ranked #125 of 291 in WA (top 43%) — acceptable for families but not a draw, mixed tenant base, ~2y average lease.
- Market conditions: Rents rising (+1.5%/yr); 176 active listings in the ZIP; 5 comparable units currently listed for rent nearby; rentals at typical pace (median 26d on market — plan ~3-4 weeks tenant-placement turnaround); solid renter incomes; 10,555 units permitted in King County in 2024 (7,119 in 5+ unit buildings).
- This rent runs 34% of the median local income ($79k/yr) — at the standard rent-burdened threshold; future hikes will face affordability resistance.
Forward outlook
- Local home prices are declining (-3.0%/yr); year-one equity from $1k of loan paydown is wiped out by about $6k of value loss. Plan a longer hold.
- King County population projected at +44% by 2050 — long-run rental-demand tailwind backs the buy-and-hold thesis.
Negotiation context
- It's been on market 175 days — a 12% lower offer ($186k) is reasonable based on typical stale-listing flexibility.
- 2 sale attempts since 20y ago; this cycle's ask has dropped $18k (8%) from the opening price — seller is motivated, your offer sets the floor, not the list.
- Current owner paid $160k; 32% above their basis — modest negotiation headroom, anchor on the comps not their cost.
Risks & watch-outs
- Climate carrying-cost: major flood risk — expect insurance premiums to compound above CPI over the hold.
Questions for the listing agent
- It's been on market 175 days. Have you received any prior offers? Is the seller open to a 12% concession, seller financing, or rate buy-down credit?
- Why hasn't it sold? Are there any deal-killer items the seller is aware of (foundation, flood, title, zoning, code violations)?
- Is there a deadline driving the sale (1031 exchange, divorce, estate, relocation)? That informs how much negotiation room exists.
- Crime grade is F in this area — have there been break-ins, vandalism, or insurance claims at this property in the last 3 years? What carrier currently insures it and at what premium?
- What's the average days-on-market for RENTAL listings here right now (not sales)? A rising rental-DOM trend means longer vacancies and softer asking-rent achievability than the comps imply.
- What's the recent tenant-quality profile in this submarket — average credit score on applications, eviction rate, late-payment / NSF rate, and stable-employment percentage? A property-management company in the area should have these aggregated.
- How much new for-sale + rental construction is in the pipeline within 1–3 miles? Heavy new supply typically softens prices + rents 12–24 months out; constrained supply supports both.
Investment metrics
- 1% rule
- 1.04% ✓
- Cap rate
- 7.89%
- Cash-on-cash
- 5.69%
- DSCR
- 1.25
- GRM
- 8.0
CMA / ARV
- ARV (on-the-fly)
- $203,280
- Comps found
- 12
Show comp detail 12 sales within ~0.75 mi
| Address | Dist | Beds/Ba | Sqft | Sold | Price | $/sf | Match |
|---|---|---|---|---|---|---|---|
| 1402 22nd St NE #454 | 0.00mi | 3/2.0 | 1,880 (+2%) | 1mo | $210,000 | $112 | 96 |
| 1402 22nd St NE #301 | 0.00mi | 3/2.0 | 1,874 (+1%) | 14mo | $189,000 | $101 | 86 |
| 1402 22nd St NE #440 | 0.00mi | 2/2.0 (-1) | 1,866 (+1%) | 11mo | $205,000 | $110 | 84 |
| 1402 22nd St NE #531 | 0.38mi | 3/2.0 | 1,848 (0%) | 6mo | $122,500 | $66 | 77 |
| 1402 22nd St NE #203 | 0.00mi | 3/2.0 | 1,632 (-12%) | 5mo | $143,500 | $88 | 76 |
| 1402 22nd St NE #558 | 0.40mi | 3/2.0 | 1,848 (0%) | 9mo | $240,500 | $130 | 74 |
| 1402 22nd St NE #419 | 0.00mi | 3/2.0 | 1,660 (-10%) | 14mo | $186,500 | $112 | 72 |
| 1402 22nd St NE #126 | 0.02mi | 2/2.0 (-1) | 2,040 (+10%) | 8mo | $178,570 | $88 | 70 |
| 1402 22nd St NE #536 | 0.37mi | 3/2.0 | 1,848 (0%) | 15mo | $175,000 | $95 | 70 |
| 1402 22nd St NE #86 | 0.37mi | 2/2.0 (-1) | 1,780 (-4%) | 6mo | $110,000 | $62 | 66 |
| 1402 22nd St NE #438 | 0.38mi | 3/2.0 | 1,716 (-7%) | 11mo | $240,000 | $140 | 61 |
| 1402 22nd St NE #515 | 0.38mi | 3/2.0 | 1,680 (-9%) | 11mo | $221,000 | $132 | 58 |
Match score weights: distance 35% · size 25% · config 20% · recency 20%. Top-matched comps best support the ARV.
Projected returns pro-forma
-3.0% appreciation · 1.51% rent growth · sell at horizon
- IRR
- -9.2%
- Equity multiple
- 0.67×
- Total profit
- $-19,656
- Equity at exit
- $31,593
- IRR
- -1.8%
- Equity multiple
- 0.88×
- Total profit
- $-6,917
- Equity at exit
- $18,320
Cash invested: $59,329 (down + closing). Projections, not guarantees.
Landlord ↔ Tenant lean methodology
- Overall (STATE)
- 28 Tenant-Leaning
- State Washington
- 28 Tenant-Leaning · D+8
- County
- — inherits STATE
- City
- — inherits STATE
ZIP-level market 98002
- Rents YoY
- 1.5%
- Active inventory
- 176
- Price-to-rent
- 8.0×
Monthly cashflow live
- Estimated rent
- $2,210 high interval (Pro) →
- Mortgage (P&I)
- −$1,111
- Tax est. 1.5%
- −$265 /mo · $3,178/yr
- Insurance
- −$88
- HOA
- −$0
- Vacancy / Maint / Mgmt
- −$464
- Net cashflow
- $281
Break-even live
Sensitivity live
| Price | -10% $428 | -5% $354 | +0% $281 | +5% $208 | +10% $135 |
|---|---|---|---|---|---|
| Rent | -10% $107 | -5% $194 | +0% $281 | +5% $368 | +10% $456 |
| Rate | -1.0pp $388 | -0.5pp $335 | base $281 | +0.5pp $226 | +1.0pp $170 |
UW: 25.0% down · 7.5% · 30yr · 1.5% tax · 5.0% vac · 8.0% maint · 8.0% mgmt
Financing live
Cash to close
- Down payment
- $52,972
- Closing costs
- $6,357
- Reserves months
- —
- Total cash needed
- —
Loan-product check · same deal, 3 products live
Conventional
25% down · 7.5% · 30yr
- Down + closing
- —
- Monthly P&I
- —
- Monthly cashflow
- —
- DSCR
- —
- Eligible?
- —
Personal DTI + credit; lowest rate.
DSCR
20% down · 8.5% · 30yr
- Down + closing
- —
- Monthly P&I
- —
- Monthly cashflow
- —
- DSCR
- —
- Eligible?
- —
No personal income docs; deal must DSCR.
Hard money
10% down · 12.0% · 12mo
- Down + closing
- —
- Monthly P&I
- —
- Monthly cashflow
- —
- DSCR
- —
- Eligible?
- —
Short-term bridge; refi at stabilization.
Rent comps 5 comps
| Address | Beds | Baths | Sqft | Rent | $/sqft | DOM | Units | Dist |
|---|---|---|---|---|---|---|---|---|
| 2025 M St NE Unit 2045 Auburn, WA | 2.0 | 1.5 | 1248 | $2,095 | $1.68 | 23d | 1 | 0.13mi |
| 2414 N St NE Unit C Auburn, WA | 3.0 | 1.0 | 1271 | $1,950 | $1.53 | 25d | 1 | 0.18mi |
| 2317 I St NE Unit 2319 Auburn, WA | 3.0 | 2.0 | 1400 | $2,275 | $1.62 | 25d | 1 | 0.41mi |
| 1433 8th St NE Auburn, WA | 1.0–3.0 | 1.0–1.5 | 1025 | $2,799 | $2.73 | 0d | 13 | 0.69mi |
| 31900 104th Ave SE Unit A206 Auburn, WA | 2.0 | 1.5 | 1250 | $2,000 | $1.60 | 25d | 1 | 0.72mi |
Listing history 12 events
-
2026-06-21days on market $211,888 Active 175 DOM
-
2026-06-18days on market $211,888 Active 172 DOM
-
2026-06-17days on market $211,888 Active 171 DOM
-
2026-06-16days on market $211,888 Active 170 DOM
-
2026-06-15days on market $211,888 Active 169 DOM
-
2026-06-13days on market $211,888 Active 167 DOM
-
2026-06-13pricedays on market $211,888 Active 166 DOM
-
2026-05-21price $214,000
-
2026-03-24price $224,550
-
2025-12-12$229,450 Active
-
2006-10-06soldstatus $160,000
-
2006-09-23$160,000
ⓘ Source: listings_history table (triggers on properties + properties_extension) + one-shot
backfill from property_details.listing_events for pre-trigger history.
Climate risk First Street
- Flood 6/10 Major FEMA zone X (unshaded) · 27% chance over 30 yrs
- Wildfire 1/10 Low
- Heat 4/10 Moderate 7 d/yr ≥87°F today · 16 d/yr by 30 yrs out
- Wind 1/10 Low
- Air quality 7/10 Severe 10 unhealthy d/yr today · 11 by 30 yrs out
Nearby sold comps map
Loading sold comps map…
Walkable amenities ~0.75 mi
Loading nearby amenities…
Taxation est. · year 1
- Rental income
- $26,514
- − Mortgage interest
- −$11,869
- − Property taxes
- −$3,178
- − Insurance
- −$1,059
- − Repairs & maintenance
- −$2,121
- − Management
- −$2,121
- − Depreciation
- −$6,164
- Taxable income
- $1
- Est. tax owed @ 24.0%
- −$0
- After-tax cash flow
- $3,374/yr
For passive investors: Depreciation is non-cash, so a rental often shows a tax loss while cash-flowing — sheltering income. Rental losses are passive: they offset passive income freely, and up to $25,000/yr can offset ordinary (W-2) income if you actively participate and your MAGI is under $100k (phasing out to $0 by $150k); unused losses carry forward. On sale, claimed depreciation is recaptured at up to 25%, and gains may owe capital-gains tax (a 1031 exchange can defer both). Figures are a year-1 estimate at your 24.0% rate — not tax advice; consult a CPA.
Schools (NCES district)
- District
- Auburn School District
- NCES district ID
- 5300300
- Math proficiency
- 47% ▼ -3.00%
- Reading proficiency
- 56% ▼ -1.00%
- Median HH income
- $58,048
- Composite
- 46.73/100
- National rank
- #5240
- State rank
- #125 of 291 in WA
Livability — Auburn
- Score
- 81/100
- State rank
- #75
- US rank
- #1371
Category grades
Schools grade is shown separately in the Schools card above.
Census & demographics
- Census place
- Auburn, WA
- County
- King County · 2,251,916 people
- City population
- 74,969
- Metro
- Seattle-Tacoma-Bellevue, WA
- Population (ZIP)
- 37,509
- Household income
- $78,684
- Rent vs Own
- Severe rent burden
- 2202.0
Population outlook (King County) Hauer SSP2
- Today (2025)
- 2,576,485 people
- By 2030
- 2,803,316 · +8.8%
- By 2040
- 3,255,921 · +26.4%
- By 2050
- 3,706,444 · +43.9%
- By 2075
- 4,746,063 · +84.2%
- By 2100
- 5,407,730 · +109.9%
Race, ethnicity, and origin ACS 2023
- Neighborhood character
- Highly diverse neighborhood (Simpson 0.72)
- Race & ethnicity
- White 46% Hispanic / Latino 24% Two or more races 13% Black 12% Asian 6% Pacific Islander 4% Native American 2%
- Hispanic origin (detail)
- Mexican 20%
- Common ancestry
- Portuguese 4% Subsaharan African 4% Lithuanian 3%
- Foreign-born
- 24% · Canada, Vietnam
- Languages at home
- 63% English-only · Spanish 19% Russian/Polish/Slavic 6% Other Asian/Pacific 3%
Political lean MEDSL · King
- 2024 margin
- Solid D (+51.7) · D 74.2% · R 22.5% · Other 3.4%
- 2008→2024 swing
- +9.6pp toward D · 2008: 42.1pp · 2024: 51.7pp
- All cycles
- 2024: D+51.7 2020: D+52.7 2016: D+50.4 2012: D+39.9 2008: D+42.1
Not yet ingested
- Civics
- —
Market trends
- HPI YoY
- ▼ -677.96%
- Current HPI
- 298.0849
- Rent YoY
- ▲ 1.51%
- Metro
- Seattle-Tacoma-Bellevue, WA
- State GDP YoY
- ▲ 4.65%
- F500 in state
- 22
Industry mix (Fortune 500 HQ in WA)
| Industry | F500 HQs | Revenue |
|---|---|---|
| Retail | 2 | $269B |
|
||
| Technology / Retail | 1 | $638B |
|
||
| Technology | 1 | $245B |
|
||
| Telecommunications | 1 | $38B |
|
||
| Food / Beverage | 1 | $36B |
|
||
| Automotive / Trucks | 1 | $34B |
|
||
Price history
+33.8% since first listed5 events — show timeline
- 2026-05-21 Price Changed $214,000 NWMLS as Distributed by MLS Grid
- 2026-03-24 Price Changed $224,550 NWMLS as Distributed by MLS Grid
- 2025-12-12 Listed $229,450 NWMLS as Distributed by MLS Grid
- 2006-10-06 Sold (MLS) $160,000 NWMLS as Distributed by MLS Grid
- 2006-09-23 Listed $160,000 NWMLS as Distributed by MLS Grid
Cash-flow waterfall
monthlySold comps — $/sqft
last 12 mo · ≤1 miLoading sold comps…