 🔨 Auction
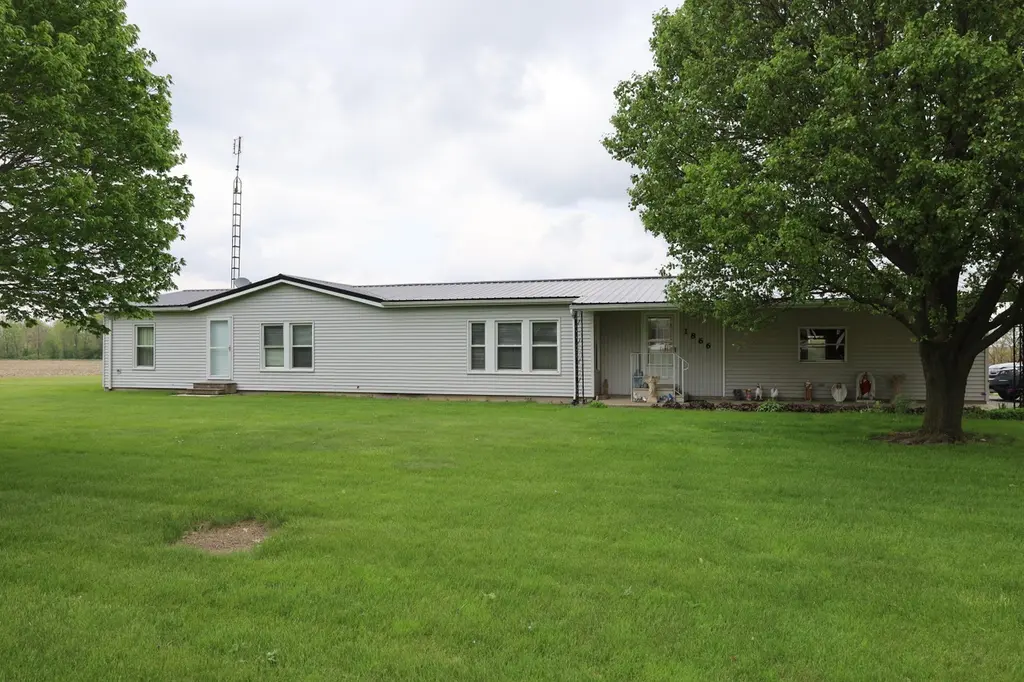
1866 Township Line Rd · St. Henry, OH
Flood risk 1/10 · Minimal
- FEMA flood zone
- X (unshaded)
- Chance of flooding over 30 yrs
- 0.0%
- Est. flood insurance / yr
- $473 – $860
Fire risk 1/10 · Minimal
- Est. fire insurance / yr
- $713 – $1,323
Heat risk 3/10 · Minor
- Hot days now (above 101°F)
- 7 days/yr
- Hot days in 30 yrs
- 18 days/yr
Wind risk 2/10 · Minimal
- Chance of severe wind over 30 yrs
- 1.0%
Air-quality risk 2/10 · Minimal
- Unhealthy air days now
- 1 days/yr
- Unhealthy air days in 30 yrs
- 3 days/yr
Risk factors via First Street. Map © Google.
Why this score? — see what drove the C- grade
The composite is a weighted blend of 9 inputs, each scored 0–100. Each bar is that input's sub-score; the figure is the points it added to the 100-point composite (weight × sub-score).
- Cash flow +15.0/30.0
- ARV discount +7.5/15.0
- Schools +7.5/10.0
- Appreciation +7.4/10.0
- 1% rule +5.0/10.0
- DSCR +5.0/10.0
- Rent growth +2.5/5.0
- Livability +2.5/5.0
- Condition / age +2.5/5.0
$1
🖨 Deal sheet 📄 Offer letter ✓ Due diligence
Listing remarks
DUE TO THE PASING OF KATHLEEN WENDEL THIS AUCTION WILL BE POSTPONED UNTIL AUGUST!!! CHECK BACK FOR DETAILS COMING SOON. Up for public auction on June 13, 2026 @ 10AM is a 3 bedroom, 2 bath home located at 1866 Township Line Road in Saint Henry, Ohio. This home sits on 1.09 acres and offers 1,704 square feet of living space with a full unfinished basement. This country property has a 40' x 16 shed and is located in the Saint Henry school district. Home comes complete with refrigerator, microwave, stove, dishwasher, washer and dryer. Many updates include Furnace and AC/heat pump in 2011, metal roof in 2020, replacement windows in 2001, garage doors in 2011, hot water heater in 2014, walk in d
Key facts
- 1.09 acre lot
- 2 garage spots
- Built 1989
Property features AI
Exterior
- Parking: Attached 2-car garage
- Utilities: Shared well water; Septic tank
- Home design: Single-family residence; Built in 1989; Residential property
- Construction: Vinyl siding construction; Built in 1989; Full poured foundation
- Exterior features: Vinyl siding; Residential lot; Shared well
Interior
- Kitchen: Kitchen (approx. 13 x 13); Dishwasher; Range; Microwave; Refrigerator
- Bedrooms: Bedroom 1 (13 x 10); Bedroom 2 (13 x 10); Bedroom 3 (14 x 13)
- Bathrooms: 2 full bathrooms (one approx. 9 x 6, one approx. 9 x 5)
- Heating & cooling: Forced air heating with propane; Central air conditioning
- Interior features: 9 total rooms; Full poured, unfinished basement
- Laundry & utility: Washer; Dryer; Utility room (approx. 13 x 10)
Neighborhood map
What this means for you Summary
Snapshot
- This is a 2-bed/2.0-bath single-family listed at $1.
Deal economics
- At list price, monthly cash flow is $831 ($10k/yr) — positive.
- The deal already cash-flows at list — no discount required.
- Meets the 1% rule at list price ($1k rent vs $1).
Location & tenants
- Location reads: area grade C — affects rentability + tenant quality, not the cash-flow math above.
- St Henry Consolidated Local (rural): math 90% / reading 84% proficiency, ranked #20 of 656 in OH (top 3%) — strong family-tenant draw, lease renewals of 3-5y typical; only 11% free/reduced lunch — higher-income household profile.
- Market conditions: 2 active listings in the ZIP; high-income renter base; 92 units permitted in Mercer County in 2024 (0 in 5+ unit buildings).
- This rent is only 11% of the median local income ($113k/yr) — well below the 30% rent-burden line; pricing power to push rent on renewal without tenant pushback.
Forward outlook
- Mercer County population projected at -13% by 2050 — secular population decline; favor cash flow + early exit over multi-decade hold.
- At projected returns (4.7% appreciation + 3.0% rent growth), your $0 cash investment doubles in ~1 year — after that, you're playing with house money.
Negotiation context
- It's been on market 41 days — a 3% lower offer ($0) is reasonable based on typical stale-listing flexibility.
Questions for the listing agent
- It's been on market 41 days. Have you received any prior offers? Is the seller open to a 5% concession, seller financing, or rate buy-down credit?
- Is there a deadline driving the sale (1031 exchange, divorce, estate, relocation)? That informs how much negotiation room exists.
- What's the average days-on-market for RENTAL listings here right now (not sales)? A rising rental-DOM trend means longer vacancies and softer asking-rent achievability than the comps imply.
- What's the recent tenant-quality profile in this submarket — average credit score on applications, eviction rate, late-payment / NSF rate, and stable-employment percentage? A property-management company in the area should have these aggregated.
- How much new for-sale + rental construction is in the pipeline within 1–3 miles? Heavy new supply typically softens prices + rents 12–24 months out; constrained supply supports both.
Investment metrics
- 1% rule
- 105171.00% ✓
- Cap rate
- 997019.08%
- Cash-on-cash
- 3560759.95%
- DSCR
- 158434.78
- GRM
- 0.0
CMA / ARV
No comps found within radius.
Projected returns pro-forma
4.7% appreciation · 3.0% rent growth · sell at horizon
- IRR
- —
- Equity multiple
- 189047.34×
- Total profit
- $52,933
- Equity at exit
- $1
- IRR
- —
- Equity multiple
- 408204.56×
- Total profit
- $114,297
- Equity at exit
- $1
Cash invested: $0 (down + closing). Projections, not guarantees.
Landlord ↔ Tenant lean methodology
- Overall (STATE)
- 73 Landlord-Friendly
- State Ohio
- 73 Landlord-Friendly · R+6
- County
- — inherits STATE
- City
- — inherits STATE
ZIP-level market 45883
- Home prices YoY
- 1.9%
- Active inventory
- 2
Monthly cashflow live
- Estimated rent
- $1,052 medium interval (Pro) →
- Mortgage (P&I)
- −$0
- Tax est. 1.5%
- −$0 /mo · $0/yr
- Insurance
- −$0
- HOA
- −$0
- Vacancy / Maint / Mgmt
- −$221
- Net cashflow
- $831
Break-even live
UW: 25.0% down · 7.5% · 30yr · 1.5% tax · 5.0% vac · 8.0% maint · 8.0% mgmt
Financing live
Cash to close
- Down payment
- $0
- Closing costs
- $0
- Reserves months
- —
- Total cash needed
- —
Loan-product check · same deal, 3 products live
Conventional
25% down · 7.5% · 30yr
- Down + closing
- —
- Monthly P&I
- —
- Monthly cashflow
- —
- DSCR
- —
- Eligible?
- —
Personal DTI + credit; lowest rate.
DSCR
20% down · 8.5% · 30yr
- Down + closing
- —
- Monthly P&I
- —
- Monthly cashflow
- —
- DSCR
- —
- Eligible?
- —
No personal income docs; deal must DSCR.
Hard money
10% down · 12.0% · 12mo
- Down + closing
- —
- Monthly P&I
- —
- Monthly cashflow
- —
- DSCR
- —
- Eligible?
- —
Short-term bridge; refi at stabilization.
Listing history 9 events
-
2026-06-09days on market $1 Active 41 DOM
-
2026-06-08days on market $1 Active 40 DOM
-
2026-06-08days on market $1 Active 39 DOM
-
2026-06-05days on market $1 Active 37 DOM
-
2026-06-04days on market $1 Active 35 DOM
-
2026-06-02days on market $1 Active 34 DOM
-
2026-06-01days on market $1 Active 33 DOM
-
2026-05-31days on market $1 Active 32 DOM
-
2026-03-25$1 Active
ⓘ Source: listings_history table (triggers on properties + properties_extension) + one-shot
backfill from property_details.listing_events for pre-trigger history.
Climate risk First Street
- Flood 1/10 Low FEMA zone X (unshaded) · 0% chance over 30 yrs
- Wildfire 1/10 Low
- Heat 3/10 Moderate 7 d/yr ≥101°F today · 18 d/yr by 30 yrs out
- Wind 2/10 Low 100% chance of damaging wind over 30 yrs
- Air quality 2/10 Low 1 unhealthy d/yr today · 3 by 30 yrs out
Nearby sold comps map
Loading sold comps map…
Walkable amenities ~0.75 mi
Loading nearby amenities…
Taxation est. · year 1
- Rental income
- $12,621
- − Mortgage interest
- −$0
- − Property taxes
- −$0
- − Insurance
- −$0
- − Repairs & maintenance
- −$1,010
- − Management
- −$1,010
- − Depreciation
- −$0
- Taxable income
- $10,601
- Est. tax owed @ 24.0%
- −$2,544
- After-tax cash flow
- $7,426/yr
For passive investors: Depreciation is non-cash, so a rental often shows a tax loss while cash-flowing — sheltering income. Rental losses are passive: they offset passive income freely, and up to $25,000/yr can offset ordinary (W-2) income if you actively participate and your MAGI is under $100k (phasing out to $0 by $150k); unused losses carry forward. On sale, claimed depreciation is recaptured at up to 25%, and gains may owe capital-gains tax (a 1031 exchange can defer both). Figures are a year-1 estimate at your 24.0% rate — not tax advice; consult a CPA.
Schools (NCES district)
- District
- St Henry Consolidated Local
- NCES district ID
- 3904858
- Math proficiency
- 90% ▼ -2.00%
- Reading proficiency
- 84% ▼ -2.00%
- Median HH income
- $64,642
- Composite
- 74.9/100
- National rank
- #144
- State rank
- #20 of 656 in OH
Livability — St. Henry
No livability data for this city. (Only ~50 U.S. cities are tracked.)
Census & demographics
- County
- Mercer · 42,068 people
- Population (ZIP)
- 4,099
- Household income
- $113,427
- Rent vs Own
- Severe rent burden
- 5.5
Population outlook (Mercer County) Hauer SSP2
- Today (2025)
- 40,163 people
- By 2030
- 39,367 · -2.0%
- By 2040
- 37,406 · -6.9%
- By 2050
- 34,917 · -13.1%
- By 2075
- 28,969 · -27.9%
- By 2100
- 21,338 · -46.9%
Race, ethnicity, and origin ACS 2023
- Neighborhood character
- Predominantly White (97%)
- Race & ethnicity
- White 97% Hispanic / Latino 2%
- Common ancestry
- Lithuanian 4% Italian 1% Romanian 1%
- Foreign-born
- 1% · Canada
- Languages at home
- 98% English-only · Spanish 1%
Political lean MEDSL · Mercer
- 2024 margin
- Solid R (+66.7) · D 16.3% · R 83.0%
- 2008→2024 swing
- -23.2pp toward R · 2008: -43.5pp · 2024: -66.7pp
- All cycles
- 2024: R+66.7 2020: R+64.9 2016: R+65.0 2012: R+54.8 2008: R+43.5
Not yet ingested
- Civics
- —
Market trends
- HPI YoY
- ▲ 4.70%
- Current HPI
- 248.8367
- Rent YoY
- —
- Metro
- —
- State GDP YoY
- ▲ 1.98%
- F500 in state
- 48
Industry mix (Fortune 500 HQ in OH)
| Industry | F500 HQs | Revenue |
|---|---|---|
| Insurance | 3 | $145B |
|
||
| Industrial Machinery | 3 | $49B |
|
||
| Financial Services | 3 | $24B |
|
||
| Consumer Goods | 2 | $93B |
|
||
| Aerospace / Defense | 2 | $47B |
|
||
| Utilities | 2 | $33B |
|
||
Property tax history
+2.2%/yrLatest (2024): $2,153 · +0.5% YoY. Source: county tax records.
Cash-flow waterfall
monthlySold comps — $/sqft
last 12 mo · ≤1 miLoading sold comps…