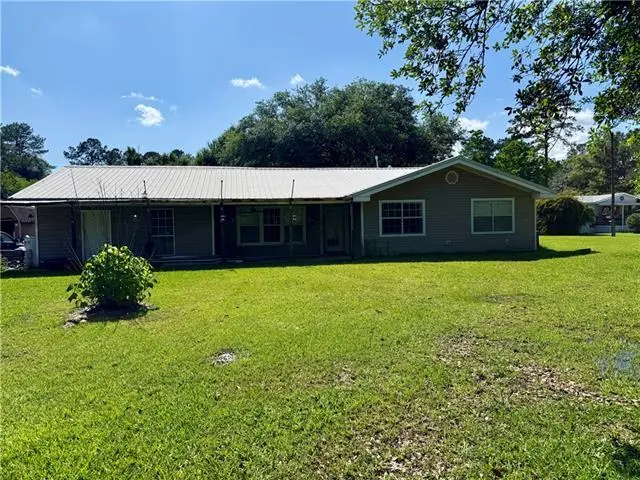
46231 Milton Rd · Hammond, LA
Flood risk No data
- FEMA flood zone
- —
- Chance of flooding over 30 yrs
- —
- Est. flood insurance / yr
- —
Fire risk No data
- Est. fire insurance / yr
- —
Heat risk No data
- Hot days now (above threshold)
- —
- Hot days in 30 yrs
- —
Wind risk No data
- Chance of severe wind over 30 yrs
- —
Air-quality risk No data
- Unhealthy air days now
- —
- Unhealthy air days in 30 yrs
- —
Risk factors via First Street. Map © Google.
Why this score? — see what drove the B grade
The composite is a weighted blend of 9 inputs, each scored 0–100. Each bar is that input's sub-score; the figure is the points it added to the 100-point composite (weight × sub-score).
- Cash flow +30.0/30.0
- ARV discount +15.0/15.0
- DSCR +10.0/10.0
- 1% rule +7.7/10.0
- Livability +3.5/5.0
- Rent growth +2.5/5.0
- Condition / age +2.5/5.0
- Schools +2.0/10.0
- Appreciation +0.0/10.0
$129,900
🖨 Deal sheet 📄 Offer letter ✓ Due diligence
Listing remarks MLS
Large home for a growing family including Guest/ Mother-in-law suite with private entrance and bathroom. Minutes to SLU and I-55. Property would also make a nice rental or investment property. Large kitchen, living, and dining in the center of home. Large shed on property will remain with sale. Add your own personal touches to make this a great home. All appliances remain. No flood zone, never flooded.
Key facts
- 1.03 acre lot
- Built 1967
- Listed 12 days
Property features AI
Exterior
- Utilities: Electric service by Entergy
- Home design: Single family residence
- Construction: Vinyl siding construction; Metal roof
- Exterior features: Metal roof; Vinyl siding; Acreage
Interior
- Kitchen: Kitchen (details not specified)
- Bedrooms: Bedroom 1; Bedroom 2; Bedroom 3
- Bathrooms: 3 full bathrooms
- Heating & cooling: Central heating; Central air conditioning; Wood-burning fireplace
- Interior features: Living room; Dining room; Kitchen
- Laundry & utility: No laundry details provided
Neighborhood map
What this means for you Summary
Snapshot
- This is a 4-bed/3.0-bath single-family listed at $130k.
Deal economics
- At list price, monthly cash flow is $495 ($6k/yr) — positive.
- The deal already cash-flows at list — no discount required.
- Meets the 1% rule at list price ($2k rent vs $130k).
- Cap rate 10.9% vs local median 5.0% in Hammond — top-decile yield for the area; either an underpriced asset or a hidden risk that comps aren't pricing in. Stress-test before assuming the spread holds.
Location & tenants
- Location reads 69/100 on livability (#77 in LA) — a middle-class / working-renter tenant base. Strengths: cost of living A+, health & safety A+; Watch: amenities C-, commute D+, schools D.
- Tangipahoa Parish (rural): math 18% / reading 29% proficiency, ranked #63 of 98 in LA (top 64%) — low school quality limits family demand, transient renter base, plan for 1-2y turnover; 73% free/reduced lunch — lower-income household profile, screen leases tightly.
- Market conditions: Rents flat; 220 active listings in the ZIP; 1 comparable units currently listed for rent nearby; 1,085 units permitted in Tangipahoa Parish in 2024 (378 in 5+ unit buildings).
- This rent runs 39% of the median local income ($51k/yr) — at the standard rent-burdened threshold; future hikes will face affordability resistance.
Forward outlook
- Local home prices are declining (-3.0%/yr); year-one equity from $898 of loan paydown is wiped out by about $4k of value loss. Plan a longer hold.
- Tangipahoa County population projected at +22% by 2050 — long-run rental-demand tailwind backs the buy-and-hold thesis.
- At projected returns (-3.0% appreciation + 0.1% rent growth), your $36k cash investment doubles in ~10 years — after that, you're playing with house money.
Negotiation context
- Only 13 days on market — expect competitive offers; lowballing is unlikely to land.
- 6 sale attempts since 16y ago with the ask held roughly flat each time — persistent listings suggest the price (not the market) is what's stuck; bring a comps-based counter.
- Current owner paid $97k; 34% above their basis — modest negotiation headroom, anchor on the comps not their cost.
Questions for the listing agent
- Built in 1967 — when were the roof, HVAC, electrical panel, plumbing, and water heater last replaced?
- Is there a deadline driving the sale (1031 exchange, divorce, estate, relocation)? That informs how much negotiation room exists.
- Schools are D-rated, which usually means shorter tenancies and higher turnover. Who's the typical renter profile here, and what's been the actual vacancy rate?
- Crime grade is F in this area — have there been break-ins, vandalism, or insurance claims at this property in the last 3 years? What carrier currently insures it and at what premium?
- What's the average days-on-market for RENTAL listings here right now (not sales)? A rising rental-DOM trend means longer vacancies and softer asking-rent achievability than the comps imply.
- What's the recent tenant-quality profile in this submarket — average credit score on applications, eviction rate, late-payment / NSF rate, and stable-employment percentage? A property-management company in the area should have these aggregated.
- How much new for-sale + rental construction is in the pipeline within 1–3 miles? Heavy new supply typically softens prices + rents 12–24 months out; constrained supply supports both.
Investment metrics
- 1% rule
- 1.27% ✓
- Cap rate
- 10.87%
- Cash-on-cash
- 16.33%
- DSCR
- 1.73
- GRM
- 6.6
CMA / ARV
- ARV (on-the-fly)
- $244,920
- Comps found
- 12
Show comp detail 12 sales within ~0.75 mi
| Address | Dist | Beds/Ba | Sqft | Sold | Price | $/sf | Match |
|---|---|---|---|---|---|---|---|
| 46113 Kate St | 0.38mi | 4/2.0 | 1,735 (+10%) | 3mo | $240,000 | $138 | 59 |
| 46473 Country Ln | 0.55mi | 3/2.0 (-1) | 1,710 (+9%) | 6mo | $215,000 | $126 | 46 |
| 11528 Alan Dr | 0.58mi | 3/2.0 (-1) | 1,442 (-8%) | 9mo | $200,000 | $139 | 43 |
| 46183 Lavelle Dr | 0.59mi | 3/2.0 (-1) | 1,370 (-13%) | 7mo | $214,000 | $156 | 36 |
| 11404 Rabbit Run | 0.63mi | 3/2.0 (-1) | 1,424 (-9%) | 21mo | $222,500 | $156 | 29 |
| 11496 Rabbit Run | 0.55mi | 3/2.0 (-1) | 1,400 (-11%) | 23mo | $210,000 | $150 | 28 |
| 11440 Rabbit Run | 0.61mi | 3/2.0 (-1) | 1,424 (-9%) | 24mo | $223,000 | $157 | 27 |
| 11379 Rabbit Run | 0.70mi | 3/2.0 (-1) | 1,424 (-9%) | 21mo | $223,000 | $157 | 26 |
| 11403 Rabbit Run | 0.63mi | 3/2.0 (-1) | 1,394 (-11%) | 22mo | $220,000 | $158 | 24 |
| 46176 Joele Dr | 0.63mi | 3/2.0 (-1) | 1,394 (-11%) | 23mo | $219,000 | $157 | 24 |
| 11416 Rabbit Run | 0.62mi | 3/2.0 (-1) | 1,363 (-13%) | 20mo | $213,000 | $156 | 23 |
| 11456 Rabbit Run | 0.60mi | 3/2.0 (-1) | 1,363 (-13%) | 22mo | $215,000 | $158 | 23 |
Match score weights: distance 35% · size 25% · config 20% · recency 20%. Top-matched comps best support the ARV.
Projected returns pro-forma
-3.0% appreciation · 0.06% rent growth · sell at horizon
- IRR
- 4.2%
- Equity multiple
- 1.16×
- Total profit
- $5,715
- Equity at exit
- $19,369
- IRR
- 10.9%
- Equity multiple
- 1.75×
- Total profit
- $27,150
- Equity at exit
- $11,231
Cash invested: $36,372 (down + closing). Projections, not guarantees.
Landlord ↔ Tenant lean methodology
- Overall (STATE)
- 90 Strongly Landlord-Friendly
- State Louisiana
- 90 Strongly Landlord-Friendly · R+12
- County
- — inherits STATE
- City
- — inherits STATE
ZIP-level market 70401
- Rents YoY
- 0.1%
- Active inventory
- 220
- Price-to-rent
- 6.6×
Monthly cashflow live
- Estimated rent
- $1,644 medium interval (Pro) →
- Mortgage (P&I)
- −$681
- Tax from tax record
- −$69 /mo · $826/yr
- Insurance
- −$54
- HOA
- −$0
- Vacancy / Maint / Mgmt
- −$345
- Net cashflow
- $495
Break-even live
UW: 25.0% down · 7.5% · 30yr · 1.5% tax · 5.0% vac · 8.0% maint · 8.0% mgmt
Financing live
Cash to close
- Down payment
- $32,475
- Closing costs
- $3,897
- Reserves months
- —
- Total cash needed
- —
Loan-product check · same deal, 3 products live
Conventional
25% down · 7.5% · 30yr
- Down + closing
- —
- Monthly P&I
- —
- Monthly cashflow
- —
- DSCR
- —
- Eligible?
- —
Personal DTI + credit; lowest rate.
DSCR
20% down · 8.5% · 30yr
- Down + closing
- —
- Monthly P&I
- —
- Monthly cashflow
- —
- DSCR
- —
- Eligible?
- —
No personal income docs; deal must DSCR.
Hard money
10% down · 12.0% · 12mo
- Down + closing
- —
- Monthly P&I
- —
- Monthly cashflow
- —
- DSCR
- —
- Eligible?
- —
Short-term bridge; refi at stabilization.
Rent comps 1 comps
| Address | Beds | Baths | Sqft | Rent | $/sqft | DOM | Units | Dist |
|---|---|---|---|---|---|---|---|---|
| 46088 N Baptist Rd Hammond, LA | 3.0 | 2.0 | 1151 | $1,400 | $1.22 | 43d | 1 | 0.37mi |
Listing history 13 events
-
2026-06-19days on market $129,900 Active 13 DOM
-
2026-06-18days on market $129,900 Active 12 DOM
-
2026-06-17days on market $129,900 Active 11 DOM
-
2026-06-17price $129,900 Active 10 DOM
-
2026-06-16days on market $135,000 Active 10 DOM
-
2026-06-15days on market $135,000 Active 9 DOM
-
2026-06-14days on market $135,000 Active 7 DOM
-
2026-06-13days on market $135,000 Active 6 DOM
-
2026-06-10days on market $135,000 Active 4 DOM
-
2026-06-09days on market $135,000 Active 3 DOM
-
2026-06-08days on market $135,000 Active 2 DOM
-
2026-06-07remarks 580-char remark
-
2026-06-07$135,000 Active 1 DOM
ⓘ Source: listings_history table (triggers on properties + properties_extension) + one-shot
backfill from property_details.listing_events for pre-trigger history.
Tax reassessment forecast LA · Resets to sale price
- Current annual tax
- $826 · $69/mo
- Projected year-2 tax
- $826 · $69/mo
- Expected delta
- $0/yr ($0/mo · 0.0%)
ⓘ Screening estimate from a state-policy table — verify with the county assessor before closing.
Nearby sold comps map
Loading sold comps map…
Walkable amenities ~0.75 mi
Loading nearby amenities…
Taxation est. · year 1
- Rental income
- $19,733
- − Mortgage interest
- −$7,276
- − Property taxes
- −$826
- − Insurance
- −$650
- − Repairs & maintenance
- −$1,579
- − Management
- −$1,579
- − Depreciation
- −$3,779
- Taxable income
- $4,045
- Est. tax owed @ 24.0%
- −$971
- After-tax cash flow
- $4,968/yr
For passive investors: Depreciation is non-cash, so a rental often shows a tax loss while cash-flowing — sheltering income. Rental losses are passive: they offset passive income freely, and up to $25,000/yr can offset ordinary (W-2) income if you actively participate and your MAGI is under $100k (phasing out to $0 by $150k); unused losses carry forward. On sale, claimed depreciation is recaptured at up to 25%, and gains may owe capital-gains tax (a 1031 exchange can defer both). Figures are a year-1 estimate at your 24.0% rate — not tax advice; consult a CPA.
Schools (NCES district)
- District
- Tangipahoa Parish
- NCES district ID
- 2201680
- Math proficiency
- 18% ▼ -32.00%
- Reading proficiency
- 29% ▼ -31.00%
- Median HH income
- $41,283
- Composite
- 19.94/100
- National rank
- #8676
- State rank
- #63 of 98 in LA
Livability — Hammond
- Score
- 69/100
- State rank
- #77
- US rank
- #8868
Category grades
Schools grade is shown separately in the Schools card above.
Census & demographics
- County
- Tangipahoa Parish · 85,958 people
- City population
- 51,394
- Metro
- Hammond, LA
- Population (ZIP)
- 21,221
- Household income
- $50,653
- Rent vs Own
- Severe rent burden
- 1255.0
Population outlook (Tangipahoa County) Hauer SSP2
- Today (2025)
- 144,204 people
- By 2030
- 151,413 · +5.0%
- By 2040
- 164,374 · +14.0%
- By 2050
- 175,427 · +21.7%
- By 2075
- 195,165 · +35.3%
- By 2100
- 201,641 · +39.8%
Race, ethnicity, and origin ACS 2023
- Neighborhood character
- Diverse neighborhood (Simpson 0.57)
- Race & ethnicity
- White 54% Black 36% Two or more races 6% Hispanic / Latino 4%
- Common ancestry
- Lithuanian 6% Slovak 2% Iranian 1%
- Foreign-born
- 2% · Canada
- Languages at home
- 97% English-only · Spanish 2%
Political lean MEDSL · Tangipahoa
- 2024 margin
- Solid R (+37.4) · D 30.6% · R 68.0% · Other 1.3%
- 2008→2024 swing
- -6.5pp toward R · 2008: -30.9pp · 2024: -37.4pp
- All cycles
- 2024: R+37.4 2020: R+32.8 2016: R+32.6 2012: R+27.7 2008: R+30.9
Not yet ingested
- Civics
- —
Market trends
- HPI YoY
- ▼ -77.61%
- Current HPI
- 136.1629
- Rent YoY
- ▲ 0.06%
- Metro
- Hammond, LA
- State GDP YoY
- ▲ 3.29%
- F500 in state
- 10
Industry mix (Fortune 500 HQ in LA)
| Industry | F500 HQs | Revenue |
|---|---|---|
| Telecommunications | 2 | $23B |
|
||
| Utilities | 1 | $12B |
|
||
| Wholesale / Distribution | 1 | $5B |
|
||
| Advertising | 1 | $2B |
|
||
Price history
+108.0% since first listed13 events — show timeline
- 2026-06-06 Listed $135,000 AcadianaMLS
- 2018-12-19 Sold (Public Records) $97,000 Public Records
- 2018-12-19 Sold (MLS) $97,000 GSREIN
- 2018-12-17 Pending — GSREIN
- 2018-12-15 Pending — GSREIN
- 2018-12-04 Contingent — GSREIN
- 2018-11-19 Relisted — GSREIN
- 2018-11-02 Contingent — GSREIN
- 2018-09-28 Listed $110,000 AcadianaMLS
- 2018-09-28 Listed $110,000 GSREIN
- 2010-08-31 Sold (MLS) $61,900 GSREIN
- 2010-03-23 Listed $64,900 GSREIN
- 2010-03-23 Listed $64,900 AcadianaMLS
Property tax history
+0.7%/yrLatest (2025): $826 · +0.5% YoY. Source: county tax records.
Cash-flow waterfall
monthlySold comps — $/sqft
last 12 mo · ≤1 miLoading sold comps…