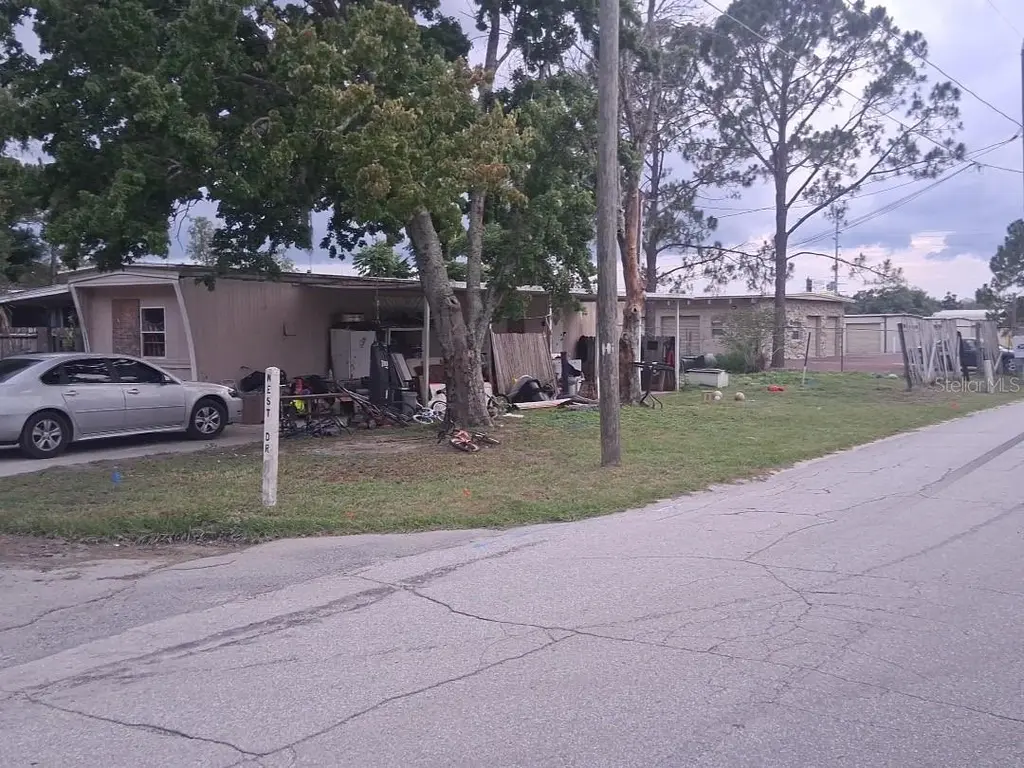
36449 West Dr · Fruitland Park, FL
Flood risk 1/10 · Minimal
- FEMA flood zone
- X (unshaded)
- Chance of flooding over 30 yrs
- 0.0%
- Est. flood insurance / yr
- $507 – $1,088
Fire risk 5/10 · Moderate
- Est. fire insurance / yr
- $947 – $1,759
Heat risk 8/10 · Major
- Hot days now (above 108°F)
- 6 days/yr
- Hot days in 30 yrs
- 18 days/yr
Wind risk 9/10 · Severe
- Chance of severe wind over 30 yrs
- 99.0%
Air-quality risk 3/10 · Minor
- Unhealthy air days now
- 2 days/yr
- Unhealthy air days in 30 yrs
- 4 days/yr
Risk factors via First Street. Map © Google.
Why this score? — see what drove the B grade
The composite is a weighted blend of 9 inputs, each scored 0–100. Each bar is that input's sub-score; the figure is the points it added to the 100-point composite (weight × sub-score).
- Cash flow +30.0/30.0
- 1% rule +10.0/10.0
- DSCR +10.0/10.0
- ARV discount +7.5/15.0
- Schools +4.2/10.0
- Livability +3.5/5.0
- Rent growth +2.5/5.0
- Condition / age +2.5/5.0
- Appreciation +0.0/10.0
$70,000
🖨 Deal sheet (PDF) 📄 Offer letter ✓ Due diligence
Listing remarks
Attention Investors, Builders, and Fix-and-Flip Specialists! Looking for your next real estate project in Central Florida? This property offers a blank-slate opportunity for a complete overhaul or a brand-new build on a well-located lot in Fruitland Park. Whether you plan to tear down and build fresh or take on a major renovation project, this site is packed with potential for the right buyer. Positioned on West Dr, this corner lot provides a great foundation for a future manufactured or single-family home. The exterior views showcase the mature trees framing the lot and a paved driveway leading to the covered carport. The existing manufactured home is in need of significant remediation,
Key facts
- Covered carport
- Paved driveway
- Well-located lot
Tags
Property features AI
Finance
- Other: Zoning: RM; Universal property ID available; Directions: From I-4, take 408 W to Florida's Turnpike; follow to exit for US-27 N in Groveland; continue on US-27 N to West Dr.
- Financial info: Unfurnished; No lease restrictions reported; Annual tax information available (not included per instructions)
- HOA & community: No association reported; No association approval required
Exterior
- Parking: Carport with 2 spaces
- Utilities: Public water; Public sewer; Public utilities
- Home design: Single-wide mobile home; Residential property; One story; Faces northwest; Entry level: One
- Construction: Metal frame construction; Shingle roof; Built area approximately 912 square feet
- Exterior features: Paved road access; Lot dimensions approximately 54 x 90; Lot area about 0.11 acres
Interior
- Kitchen: No appliances listed
- Bedrooms: 2 bedrooms
- Flooring: Carpet flooring
- Bathrooms: 1 full bathroom
- Heating & cooling: No heating; No cooling
- Interior features: Other interior features
- Laundry & utility: Laundry located outside
Neighborhood map
What this means for you Summary
Snapshot
- This is a 2-bed/1.0-bath manufactured listed at $70k.
Deal economics
- At list price, monthly cash flow is $610 ($7k/yr) — positive.
- The deal already cash-flows at list — no discount required.
- Meets the 1% rule at list price ($1k rent vs $70k).
- Recommended offer: $69k (1.5% below list) — sets the bar for market timing.
- Cap rate 16.8% vs local median 4.0% in Fruitland Park — top-decile yield for the area; either an underpriced asset or a hidden risk that comps aren't pricing in. Stress-test before assuming the spread holds.
Location & tenants
- Location reads 70/100 on livability (#447 in FL) — a middle-class / working-renter tenant base. Strengths: housing A+, crime A, health & safety A-; Watch: amenities F, commute F.
- Lake (suburban): math 49% / reading 50% proficiency, ranked #37 of 73 in FL (top 51%) — families likely to look elsewhere, expect single-tenant / working-renter base with shorter leases.
- Zoned schools: Fruitland Park Elementary School (math 46% / reading 41%, grade F, #1,345 of 2,144 statewide, top 64%, 733 students, 66% FRL); Carver Middle School (math 41% / reading 41%, grade F, #353 of 571 statewide, top 63%, 837 students, 65% FRL); Leesburg High School (math 24% / reading 32%, grade F, #464 of 667 statewide, top 70%, 1,641 students, 58% FRL).
- Zoned-school proficiency averages 38% at this address vs 50% district-wide (-12 pts) — the specific schools serving this property underperform the Lake average; the district grade overstates school quality for this exact location.
- Market conditions: 168 active listings in the ZIP; 4 comparable units currently listed for rent nearby; rentals at typical pace (median 26d on market — plan ~3-4 weeks tenant-placement turnaround); 4,799 units permitted in Lake County in 2024 (814 in 5+ unit buildings).
Forward outlook
- Local home prices are declining (-3.0%/yr); year-one equity from $484 of loan paydown is wiped out by about $2k of value loss. Plan a longer hold.
- Lake County population projected at +37% by 2050 — long-run rental-demand tailwind backs the buy-and-hold thesis.
- At projected returns (-3.0% appreciation + 3.0% rent growth), your $20k cash investment doubles in ~4 years — after that, you're playing with house money.
Negotiation context
- It's been on market 18 days — a 2% lower offer ($69k) is reasonable based on typical stale-listing flexibility.
- 3 sale attempts since 7y ago; this cycle's ask has dropped $10k (12%) from the opening price — seller is motivated, your offer sets the floor, not the list.
- Current owner paid $24k; list at $70k implies a 197% gain — meaningful room to come down on a strong offer.
Risks & watch-outs
- Climate carrying-cost: severe wind risk, 99% chance of damaging wind over 30y; moderate wildfire risk; extreme-heat days projected 6→18/yr by 2055 (HVAC capex compounding) — expect insurance premiums to compound above CPI over the hold.
Questions for the listing agent
- Built in 1972 — when were the roof, HVAC, electrical panel, plumbing, and water heater last replaced?
- Is there a deadline driving the sale (1031 exchange, divorce, estate, relocation)? That informs how much negotiation room exists.
- Schools are D-rated, which usually means shorter tenancies and higher turnover. Who's the typical renter profile here, and what's been the actual vacancy rate?
- What's the average days-on-market for RENTAL listings here right now (not sales)? A rising rental-DOM trend means longer vacancies and softer asking-rent achievability than the comps imply.
- What's the recent tenant-quality profile in this submarket — average credit score on applications, eviction rate, late-payment / NSF rate, and stable-employment percentage? A property-management company in the area should have these aggregated.
- How much new for-sale + rental construction is in the pipeline within 1–3 miles? Heavy new supply typically softens prices + rents 12–24 months out; constrained supply supports both.
Investment metrics
- 1% rule
- 1.99% ✓
- Cap rate
- 16.76%
- Cash-on-cash
- 37.37%
- DSCR
- 2.66
- GRM
- 4.2
CMA / ARV
No comps found within radius.
Projected returns pro-forma
-3.0% appreciation · 3.0% rent growth · sell at horizon
- IRR
- 33.3%
- Equity multiple
- 2.41×
- Total profit
- $27,556
- Equity at exit
- $10,437
- IRR
- 40.3%
- Equity multiple
- 4.78×
- Total profit
- $74,152
- Equity at exit
- $6,052
Cash invested: $19,600 (down + closing). Projections, not guarantees.
Landlord ↔ Tenant lean methodology
- Overall (STATE)
- 87 Strongly Landlord-Friendly
- State Florida
- 87 Strongly Landlord-Friendly · R+3
- County
- — inherits STATE
- City
- — inherits STATE
ZIP-level market 34731
- Home prices YoY
- -10.1%
- Active inventory
- 168
- Price-to-rent
- 4.2×
Monthly cashflow live
- Estimated rent
- $1,392 medium interval (Pro) →
- Mortgage (P&I)
- −$367
- Tax from tax record
- −$93 /mo · $1,115/yr
- Insurance
- −$29
- HOA
- −$0
- Vacancy / Maint / Mgmt
- −$292
- Net cashflow
- $610
Break-even live
Sensitivity live
| Price | -10% $650 | -5% $630 | +0% $610 | +5% $591 | +10% $571 |
|---|---|---|---|---|---|
| Rent | -10% $500 | -5% $555 | +0% $610 | +5% $665 | +10% $720 |
| Rate | -1.0pp $646 | -0.5pp $628 | base $610 | +0.5pp $592 | +1.0pp $574 |
UW: 25.0% down · 7.5% · 30yr · 1.5% tax · 5.0% vac · 8.0% maint · 8.0% mgmt
Financing live
Cash to close
- Down payment
- $17,500
- Closing costs
- $2,100
- Reserves months
- —
- Total cash needed
- —
Loan-product check · same deal, 3 products live
Conventional
25% down · 7.5% · 30yr
- Down + closing
- —
- Monthly P&I
- —
- Monthly cashflow
- —
- DSCR
- —
- Eligible?
- —
Personal DTI + credit; lowest rate.
DSCR
20% down · 8.5% · 30yr
- Down + closing
- —
- Monthly P&I
- —
- Monthly cashflow
- —
- DSCR
- —
- Eligible?
- —
No personal income docs; deal must DSCR.
Hard money
10% down · 12.0% · 12mo
- Down + closing
- —
- Monthly P&I
- —
- Monthly cashflow
- —
- DSCR
- —
- Eligible?
- —
Short-term bridge; refi at stabilization.
Rent comps 4 comps
| Address | Beds | Baths | Sqft | Rent | $/sqft | DOM | Units | Dist |
|---|---|---|---|---|---|---|---|---|
| 1508 Spring Lake Cove Ln Fruitland Park, FL | 2.0–3.0 | 1.0–2.0 | 971 | $1,249 | $1.29 | 0d | 8 | 0.54mi |
| 316 E Primrose Ln Lady Lake, FL | 3.0 | 1.5 | 1000 | $1,295 | $1.29 | 25d | 1 | 1.02mi |
| 607 Patricia Ave Fruitland Park, FL | 1.0 | 1.0 | 532 | $750 | $1.41 | 25d | 1 | 1.14mi |
| 735 S Highway 27/441 Lady Lake, FL | 1.0–4.0 | 1.0–3.0 | 1022 | $1,321 | $1.29 | 0d | 34 | 1.42mi |
Listing history 12 events
-
2026-06-21days on market $70,000 Active 18 DOM
-
2026-06-18days on market $70,000 Active 15 DOM
-
2026-06-17price $70,000 Active 14 DOM
-
2026-06-17days on market $80,000 Active 14 DOM
-
2026-06-16days on market $80,000 Active 13 DOM
-
2026-06-15days on market $80,000 Active 12 DOM
-
2026-06-13days on market $80,000 Active 10 DOM
-
2026-06-09days on market $80,000 Active 6 DOM
-
2026-06-08days on market $80,000 Active 5 DOM
-
2026-06-07days on market $80,000 Active 4 DOM
-
2026-06-04remarks 699-char remark
-
2026-06-04$80,000 Active 1 DOM
ⓘ Source: listings_history table (triggers on properties + properties_extension) + one-shot
backfill from property_details.listing_events for pre-trigger history.
Tax reassessment forecast FL · Resets to sale price
- Current annual tax
- $1,115 · $93/mo
- Projected year-2 tax
- $1,115 · $93/mo
- Expected delta
- $0/yr ($0/mo · 0.0%)
ⓘ Screening estimate from a state-policy table — verify with the county assessor before closing.
Climate risk First Street
- Flood 1/10 Low FEMA zone X (unshaded) · 0% chance over 30 yrs
- Wildfire 5/10 Major
- Heat 8/10 Severe 6 d/yr ≥108°F today · 18 d/yr by 30 yrs out
- Wind 9/10 Extreme 99% chance of damaging wind over 30 yrs
- Air quality 3/10 Moderate 2 unhealthy d/yr today · 4 by 30 yrs out
Nearby sold comps map
Loading sold comps map…
Walkable amenities ~0.75 mi
Loading nearby amenities…
Taxation est. · year 1
- Rental income
- $16,702
- − Mortgage interest
- −$3,921
- − Property taxes
- −$1,115
- − Insurance
- −$350
- − Repairs & maintenance
- −$1,336
- − Management
- −$1,336
- − Depreciation
- −$2,036
- Taxable income
- $6,607
- Est. tax owed @ 24.0%
- −$1,586
- After-tax cash flow
- $5,739/yr
For passive investors: Depreciation is non-cash, so a rental often shows a tax loss while cash-flowing — sheltering income. Rental losses are passive: they offset passive income freely, and up to $25,000/yr can offset ordinary (W-2) income if you actively participate and your MAGI is under $100k (phasing out to $0 by $150k); unused losses carry forward. On sale, claimed depreciation is recaptured at up to 25%, and gains may owe capital-gains tax (a 1031 exchange can defer both). Figures are a year-1 estimate at your 24.0% rate — not tax advice; consult a CPA.
Schools (NCES district)
- District
- Lake
- NCES district ID
- 1201050
- Math proficiency
- 49% ▼ -7.00%
- Reading proficiency
- 50% ▼ -4.00%
- Median HH income
- $46,632
- Composite
- 42.05/100
- National rank
- #3327
- State rank
- #37 of 73 in FL
Livability — Fruitland Park
- Score
- 70/100
- State rank
- #447
- US rank
- #8098
Category grades
Schools grade is shown separately in the Schools card above.
Census & demographics
- County
- Lake County · 364,602 people
- City population
- 12,196
- Metro
- Orlando-Kissimmee-Sanford, FL
- Population (ZIP)
- 12,196
- Household income
- $66,300
- Rent vs Own
- Severe rent burden
- 269.0
Population outlook (Lake County) Hauer SSP2
- Today (2025)
- 386,640 people
- By 2030
- 417,107 · +7.9%
- By 2040
- 476,676 · +23.3%
- By 2050
- 531,296 · +37.4%
- By 2075
- 648,303 · +67.7%
- By 2100
- 698,530 · +80.7%
Race, ethnicity, and origin ACS 2023
- Neighborhood character
- Predominantly White (76%)
- Race & ethnicity
- White 76% Black 11% Two or more races 11% Hispanic / Latino 3%
- Common ancestry
- Romanian 3% Serbian 2% Iranian 2%
- Foreign-born
- 5% · Canada
- Languages at home
- 98% English-only · Spanish 1% German/W. Germanic 1%
Political lean MEDSL · Lake
- 2024 margin
- Strong R (+24.7) · D 37.3% · R 62.0%
- 2008→2024 swing
- -11.2pp toward R · 2008: -13.5pp · 2024: -24.7pp
- All cycles
- 2024: R+24.7 2020: R+20.0 2016: R+23.1 2012: R+17.1 2008: R+13.5
Not yet ingested
- Civics
- —
Market trends
- HPI YoY
- ▼ -35.91%
- Current HPI
- 318.8206
- Rent YoY
- —
- Metro
- Orlando-Kissimmee-Sanford, FL
- State GDP YoY
- ▲ 3.28%
- F500 in state
- 36
Industry mix (Fortune 500 HQ in FL)
| Industry | F500 HQs | Revenue |
|---|---|---|
| Industrial Technology | 2 | $29B |
|
||
| Insurance | 2 | $17B |
|
||
| Retail | 1 | $60B |
|
||
| Technology Distribution | 1 | $58B |
|
||
| Homebuilding | 1 | $35B |
|
||
| Technology Manufacturing | 1 | $35B |
|
||
Price history
+239.0% since first listed7 events — show timeline
- 2026-06-03 Listed $80,000 Stellar MLS as Distributed by MLS Grid
- 2019-11-29 Listing Removed — Stellar MLS as Distributed by MLS Grid
- 2019-11-19 Price Changed $19,000 Stellar MLS as Distributed by MLS Grid
- 2019-11-14 Relisted — Stellar MLS as Distributed by MLS Grid
- 2019-10-30 Pending — Stellar MLS as Distributed by MLS Grid
- 2019-10-23 Listed $25,000 Stellar MLS as Distributed by MLS Grid
- 1999-04-19 Sold (Public Records) $23,600 Public Records
Property tax history
+9.2%/yrLatest (2025): $1,115 · +1.8% YoY. Source: county tax records.
Cash-flow waterfall
monthlySold comps — $/sqft
last 12 mo · ≤1 miLoading sold comps…