 Duplex
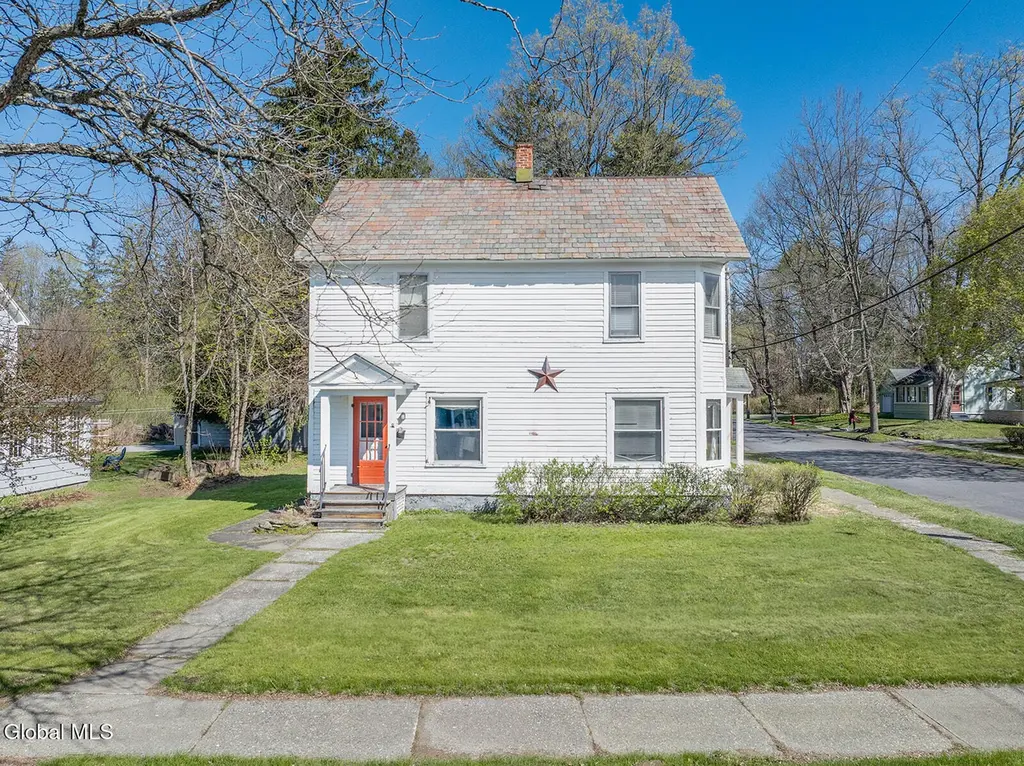
24 Mowry Ave · Greenwich, NY
Flood risk 1/10 · Minimal
- FEMA flood zone
- X
- Chance of flooding over 30 yrs
- 0.0%
- Est. flood insurance / yr
- $473 – $860
Fire risk 4/10 · Minor
- Est. fire insurance / yr
- $691 – $1,283
Heat risk 3/10 · Minor
- Hot days now (above 94°F)
- 7 days/yr
- Hot days in 30 yrs
- 16 days/yr
Wind risk 2/10 · Minimal
- Chance of severe wind over 30 yrs
- 4.0%
Air-quality risk 2/10 · Minimal
- Unhealthy air days now
- 0 days/yr
- Unhealthy air days in 30 yrs
- 1 days/yr
Risk factors via First Street. Map © Google.
Why this score? — see what drove the C+ grade
The composite is a weighted blend of 9 inputs, each scored 0–100. Each bar is that input's sub-score; the figure is the points it added to the 100-point composite (weight × sub-score).
- Cash flow +23.6/30.0
- Appreciation +10.0/10.0
- DSCR +7.6/10.0
- 1% rule +6.6/10.0
- Schools +5.3/10.0
- Livability +3.5/5.0
- Rent growth +2.5/5.0
- Condition / age +2.5/5.0
- ARV discount +0.0/15.0
$239,000
🖨 Deal sheet 📄 Offer letter ✓ Due diligence
Multi-family units
County records classify this as Multi-Family (2-4 Unit). Listing-text estimate: 2 units. confirmed
Listing remarks
Charming two-family home located at 24 Mowry Ave in the quaint Village of Greenwich, perfectly situated on the corner of Cottage Street and Mowry Avenue! This versatile property is an excellent owner-occupy opportunity, offering a spacious main unit with 4 bedrooms and plenty of room to spread out, while the second 2-bedroom unit provides the perfect chance for rental income or multi-generational living. Filled with great natural light and timeless old-house charm, this home also features an attached garage, generous living spaces, and an expansive backyard ideal for entertaining, gardening, or simply enjoying the outdoors. Conveniently located close to all the wonderful shops, local eateri
Key facts
- Attached garage
- Two-family home
- Expansive backyard
Tags
Property features AI
Finance
- Financial info: Multi-family property with 2 total units; Tenants pay internet, cable TV, and electricity
Exterior
- Parking: Attached garage (1 garage space); Driveway parking; Off-street parking; Total parking for 4 vehicles
- Security: Smoke detectors; Carbon monoxide detectors
- Utilities: Public water; Septic tank sewer; Electric with fuses; Cable connected
- Home design: Duplex; 2,536 living area (reported)
- Construction: Clapboard and wood siding; Stone foundation; Slate and metal roof
- Exterior features: Side enclosed porch; Level, landscaped corner lot
Interior
- Kitchen: Unit 1: 1 kitchen on first floor; Unit 2: 1 kitchen on first floor
- Bedrooms: Unit 1: 4 bedrooms (all on 2nd floor); Unit 2: 2 bedrooms (on 2nd floor)
- Flooring: Wood flooring; Carpet
- Bathrooms: Unit 1: 1 full bath (2nd floor); Unit 2: 1 full bath (2nd floor); Total full bathrooms: 2
- Heating & cooling: Forced air heating; Propane heating; Zoned heating
- Interior features: High-speed internet; French doors; Blinds
- Laundry & utility: Washer hookup; Electric dryer hookup; Laundry located in basement
Neighborhood map
What this means for you Summary
Snapshot
- This is a 2 × 3-bed/1.0-bath units multifamily listed at $239k.
Deal economics
- At list price, monthly cash flow is $451 ($5k/yr) — positive. Per door: $226/mo.
- The deal already cash-flows at list — no discount required.
- Meets the 1% rule at list price ($3k rent vs $239k).
Location & tenants
- Location reads 69/100 on livability (#507 in NY) — a middle-class / working-renter tenant base. Strengths: housing A+, crime A-, employment A-; Watch: health & safety D, amenities F, commute F.
- Greenwich Central School District (town): math 59% / reading 60% proficiency, ranked #266 of 755 in NY (top 35%) — acceptable for families but not a draw, mixed tenant base, ~2y average lease.
- Zoned schools: Greenwich Elementary School (math 44% / reading 64%, grade C, #908 of 2,108 statewide, top 46%, 466 students, 37% FRL); Greenwich Junior-Senior High School (math 98% / reading 87%, grade A+, #158 of 1,100 statewide, top 15%, 429 students, 32% FRL).
- Zoned-school proficiency averages 73% at this address vs 60% district-wide (+14 pts) — the actual schools serving this property are materially stronger than the Greenwich Central School District average implies; a family-tenant draw the district grade alone would hide.
- Market conditions: 23 active listings in the ZIP; 106 units permitted in Washington County in 2024 (0 in 5+ unit buildings).
Forward outlook
- In year one you build about $26k of equity ($2k loan paydown + $24k appreciation (10.0% local appreciation)).
- Washington County population projected at -20% by 2050 — secular population decline; favor cash flow + early exit over multi-decade hold.
- At projected returns (10.0% appreciation + 3.0% rent growth), your $67k cash investment doubles in ~3 years — after that, you're playing with house money.
- By year 2, paydown + projected appreciation supports a ~$41k cash-out refi (75% LTV) — recoverable capital for the next deal without selling this one.
Negotiation context
- Only 7 days on market — expect competitive offers; lowballing is unlikely to land.
Risks & watch-outs
- Watch-outs: built in 1923 — expect roof / HVAC / electrical / plumbing capex.
Questions for the listing agent
- Can we see the unit-by-unit rent roll, current vacancy, and any below-market leases? What's the average tenancy length?
- What capital expenditures (roof, boiler, parking lot, exteriors) have been made in the last 5 years, and what's planned in the next 2?
- Built in 1923 — when were the roof, HVAC, electrical panel, plumbing, and water heater last replaced?
- Is there a deadline driving the sale (1031 exchange, divorce, estate, relocation)? That informs how much negotiation room exists.
- Schools are B-rated — typically a magnet for longer-tenancy family renters. What's the average tenant stay here, and is there a school-zone premium baked into asking?
- What's the average days-on-market for RENTAL listings here right now (not sales)? A rising rental-DOM trend means longer vacancies and softer asking-rent achievability than the comps imply.
- What's the recent tenant-quality profile in this submarket — average credit score on applications, eviction rate, late-payment / NSF rate, and stable-employment percentage? A property-management company in the area should have these aggregated.
- How much new apartment / multifamily construction is in the pipeline within 1–3 miles? Heavy new supply (>2% of stock underway) typically softens rents 12–24 months out; light construction supports rent growth.
Investment metrics
- 1% rule
- 1.16% ✓
- Cap rate
- 8.56%
- Cash-on-cash
- 8.09%
- DSCR
- 1.36
- GRM
- 7.2
CMA / ARV
- ARV (on-the-fly)
- $162,304
- Comps found
- 1
Show comp detail 1 sale within ~0.75 mi
| Address | Dist | Beds/Ba | Sqft | Sold | Price | $/sf | Match |
|---|---|---|---|---|---|---|---|
| 35 John St | 0.49mi | 5/2.5 (-1) | 2,420 (-5%) | 21mo | $155,000 | $64 | 44 |
Match score weights: distance 35% · size 25% · config 20% · recency 20%. Top-matched comps best support the ARV.
Projected returns pro-forma
10.0% appreciation · 3.0% rent growth · sell at horizon
- IRR
- 30.2%
- Equity multiple
- 3.38×
- Total profit
- $159,015
- Equity at exit
- $215,310
- IRR
- 26.2%
- Equity multiple
- 7.66×
- Total profit
- $445,859
- Equity at exit
- $464,324
Cash invested: $66,920 (down + closing). Projections, not guarantees.
Landlord ↔ Tenant lean methodology
- Overall (STATE)
- 15 Strongly Tenant-Friendly
- State New York
- 15 Strongly Tenant-Friendly · D+10
- County
- — inherits STATE
- City
- — inherits STATE
ZIP-level market 12834
- Home prices YoY
- 21.5%
- Active inventory
- 23
- Price-to-rent
- 14.3×
Monthly cashflow live
- Estimated rent
- $2,778 medium interval (Pro) →
- Mortgage (P&I)
- −$1,253
- Tax from tax record
- −$390 /mo · $4,683/yr
- Insurance
- −$100
- HOA
- −$0
- Vacancy / Maint / Mgmt
- −$583
- Net cashflow
- $451
Break-even live
2-unit breakdown (identical units grouped — click to expand)
| Units | Beds | Baths | Est. rent |
|---|---|---|---|
| 2× units | 3 | 1 | $2,778 |
| #1 | 3 | 1 | $1,389 |
| #2 | 3 | 1 | $1,389 |
| Total (2 units) | $2,778 | ||
UW: 25.0% down · 7.5% · 30yr · 1.5% tax · 5.0% vac · 8.0% maint · 8.0% mgmt
Financing live
Cash to close
- Down payment
- $59,750
- Closing costs
- $7,170
- Reserves months
- —
- Total cash needed
- —
Loan-product check · same deal, 3 products live
Conventional
25% down · 7.5% · 30yr
- Down + closing
- —
- Monthly P&I
- —
- Monthly cashflow
- —
- DSCR
- —
- Eligible?
- —
Personal DTI + credit; lowest rate.
DSCR
20% down · 8.5% · 30yr
- Down + closing
- —
- Monthly P&I
- —
- Monthly cashflow
- —
- DSCR
- —
- Eligible?
- —
No personal income docs; deal must DSCR.
Hard money
10% down · 12.0% · 12mo
- Down + closing
- —
- Monthly P&I
- —
- Monthly cashflow
- —
- DSCR
- —
- Eligible?
- —
Short-term bridge; refi at stabilization.
Listing history 2 events
-
2026-05-01status Pending
-
2026-04-24$239,000 Active
ⓘ Source: listings_history table (triggers on properties + properties_extension) + one-shot
backfill from property_details.listing_events for pre-trigger history.
Tax reassessment forecast NY · Partial reset (capped growth)
- Current annual tax
- $4,683 · $390/mo
- Projected year-2 tax
- $4,683 · $390/mo
- Expected delta
- $0/yr ($0/mo · 0.0%)
ⓘ Screening estimate from a state-policy table — verify with the county assessor before closing.
Climate risk First Street
- Flood 1/10 Low FEMA zone X · 0% chance over 30 yrs
- Wildfire 4/10 Moderate
- Heat 3/10 Moderate 7 d/yr ≥94°F today · 16 d/yr by 30 yrs out
- Wind 2/10 Low 4% chance of damaging wind over 30 yrs
- Air quality 2/10 Low 0 unhealthy d/yr today · 1 by 30 yrs out
Nearby sold comps map
Loading sold comps map…
Walkable amenities ~0.75 mi
Loading nearby amenities…
Taxation est. · year 1
- Rental income
- $33,336
- − Mortgage interest
- −$13,388
- − Property taxes
- −$4,683
- − Insurance
- −$1,195
- − Repairs & maintenance
- −$2,667
- − Management
- −$2,667
- − Depreciation
- −$6,953
- Taxable income
- $1,784
- Est. tax owed @ 24.0%
- −$428
- After-tax cash flow
- $4,989/yr
For passive investors: Depreciation is non-cash, so a rental often shows a tax loss while cash-flowing — sheltering income. Rental losses are passive: they offset passive income freely, and up to $25,000/yr can offset ordinary (W-2) income if you actively participate and your MAGI is under $100k (phasing out to $0 by $150k); unused losses carry forward. On sale, claimed depreciation is recaptured at up to 25%, and gains may owe capital-gains tax (a 1031 exchange can defer both). Figures are a year-1 estimate at your 24.0% rate — not tax advice; consult a CPA.
Schools (NCES district)
- District
- Greenwich Central School District
- NCES district ID
- 3612900
- Math proficiency
- 59% ▲ 2.00%
- Reading proficiency
- 60% ▼ -2.00%
- Median HH income
- $62,128
- Composite
- 53.45/100
- National rank
- #3147
- State rank
- #266 of 755 in NY
Livability — Greenwich
- Score
- 69/100
- State rank
- #507
- US rank
- #8929
Category grades
Schools grade is shown separately in the Schools card above.
Census & demographics
- Census place
- Greenwich, NY
- Population (ZIP)
- 6,137
Population outlook (Washington County) Hauer SSP2
- Today (2025)
- 59,576 people
- By 2030
- 57,618 · -3.3%
- By 2040
- 52,751 · -11.5%
- By 2050
- 47,514 · -20.2%
- By 2075
- 35,690 · -40.1%
- By 2100
- 24,807 · -58.4%
Race, ethnicity, and origin ACS 2023
- Neighborhood character
- Predominantly White (95%)
- Race & ethnicity
- White 95% Hispanic / Latino 3% Two or more races 2% Asian 1%
- Common ancestry
- Lithuanian 6% Romanian 4% Iranian 3%
- Foreign-born
- 4% · Canada, China
- Languages at home
- 96% English-only · Chinese 1% French/Haitian/Cajun 1% Spanish 1%
Political lean MEDSL · Washington
- 2024 margin
- Strong R (+21.2) · D 39.4% · R 60.6%
- 2008→2024 swing
- -22.0pp toward R · 2008: 0.8pp · 2024: -21.2pp
- All cycles
- 2024: R+21.2 2020: R+15.6 2016: R+20.2 2012: D+1.6 2008: D+0.8
Not yet ingested
- Civics
- —
Market trends
- HPI YoY
- ▲ 66.00%
- Current HPI
- 373.2809
- Rent YoY
- —
- Metro
- —
- State GDP YoY
- ▲ 2.60%
- F500 in state
- 92
Industry mix (Fortune 500 HQ in NY)
| Industry | F500 HQs | Revenue |
|---|---|---|
| Financial Services | 10 | $950B |
|
||
| Consumer Goods | 9 | $162B |
|
||
| Insurance | 4 | $225B |
|
||
| Telecommunications | 2 | $144B |
|
||
| Pharmaceuticals | 2 | $112B |
|
||
| Media / Entertainment | 2 | $69B |
|
||
Price history
2 events — show timeline
- 2026-05-01 Pending — Global MLS
- 2026-04-24 Listed $239,000 Global MLS
Property tax history
+5.4%/yrLatest (2025): $4,683 · +1.9% YoY. Source: county tax records.
Cash-flow waterfall
monthlySold comps — $/sqft
last 12 mo · ≤1 miLoading sold comps…