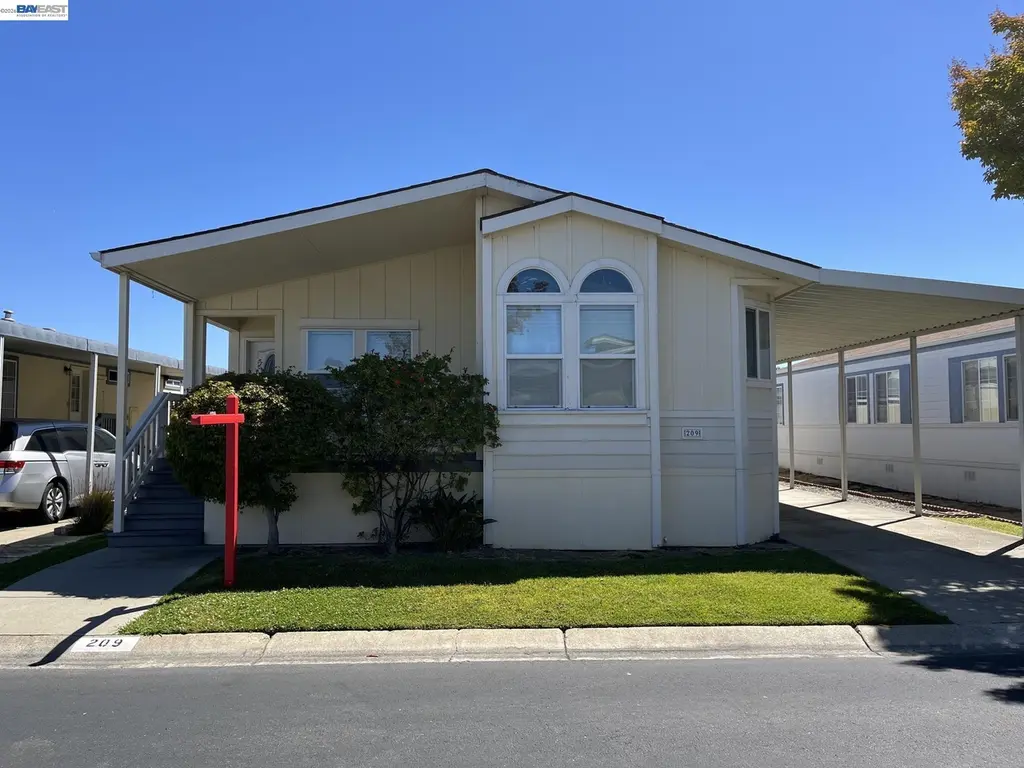
209 Santa Susana · San Leandro, CA
Flood risk 1/10 · Minimal
- FEMA flood zone
- X (shaded)
- Chance of flooding over 30 yrs
- 0.0%
- Est. flood insurance / yr
- $507 – $1,088
Fire risk 1/10 · Minimal
- Est. fire insurance / yr
- $659 – $1,223
Heat risk 3/10 · Minor
- Hot days now (above 85°F)
- 7 days/yr
- Hot days in 30 yrs
- 15 days/yr
Wind risk 1/10 · Minimal
- Chance of severe wind over 30 yrs
- —
Air-quality risk 8/10 · Major
- Unhealthy air days now
- 14 days/yr
- Unhealthy air days in 30 yrs
- 14 days/yr
Risk factors via First Street. Map © Google.
Why this score? — see what drove the C+ grade
The composite is a weighted blend of 9 inputs, each scored 0–100. Each bar is that input's sub-score; the figure is the points it added to the 100-point composite (weight × sub-score).
- Cash flow +27.4/30.0
- DSCR +9.6/10.0
- ARV discount +9.0/15.0
- 1% rule +6.1/10.0
- Livability +3.4/5.0
- Schools +2.9/10.0
- Rent growth +2.5/5.0
- Condition / age +2.5/5.0
- Appreciation +0.0/10.0
$325,000
🖨 Deal sheet 📄 Offer letter ✓ Due diligence
Listing remarks MLS
VERY NICE SENIOR PARK. THIS HOME FEATURES NEWER REMODELED KITCHEN. NEW FRONT & BACK STEPS ENCLOSED SUN PORCH 2 STORAGE SHEDS
Key facts
- Clerestory skylight
- Dual-pane windows
- Front porch
Tags
Property features AI
Finance
- HOA & community: Park: MISSION BAY MHP; Pets allowed with number/size limits and upon approval; Community clubhouse, pool and spa; Senior community
Exterior
- Parking: Carport for 2 or more vehicles; Guest parking
- Utilities: Public water; Public sewer
- Home design: Manufactured in park (mobile home); Double-wide model (Advantage Home)
- Construction: Cement siding; Composition shingle roof; Built as a mobile home
- Exterior features: Front porch with awning(s); Front yard; Storage; Landscaped front; Rectangular lot
Interior
- Kitchen: Breakfast nook / eat-in kitchen; Laminate counters; Kitchen island; Dishwasher; Range/oven (free-standing); Microwave; Refrigerator; Disposal
- Bedrooms: 3 bedrooms (street level)
- Flooring: Laminate; Tile; Carpet
- Bathrooms: 2 full bathrooms; Primary bathroom with stall shower, sunken tub, tile and double vanity; Other bathroom(s) with shower over tub and tile
- Heating & cooling: Forced air heating; Central air conditioning
- Interior features: Breakfast nook; Dining area; Formal dining room; Double-pane windows; Fireplace (living room, wood-burning)
- Laundry & utility: Laundry room with washer and dryer; Gas water heater
Neighborhood map
What this means for you Summary
Snapshot
- This is a 3-bed/2.0-bath manufactured listed at $325k.
Deal economics
- At list price, monthly cash flow is $947 ($11k/yr) — positive.
- The deal already cash-flows at list — no discount required.
- Meets the 1% rule at list price ($4k rent vs $325k).
- Cap rate 9.8% vs local median 2.0% in San Leandro — top-decile yield for the area; either an underpriced asset or a hidden risk that comps aren't pricing in. Stress-test before assuming the spread holds.
Location & tenants
- Location reads 68/100 on livability (#289 in CA) — a middle-class / working-renter tenant base. Strengths: commute A+, employment A+, health & safety A+; Watch: amenities C-, schools D, crime F.
- San Lorenzo Unified (suburban): math 23% / reading 33% proficiency, ranked #1,044 of 1,400 in CA (top 75%) — low school quality limits family demand, transient renter base, plan for 1-2y turnover.
- Market conditions: 32 active listings in the ZIP; 4 comparable units currently listed for rent nearby; rentals leasing fast (median 2d on market — plan ~1-2 weeks tenant-placement turnaround); 1,742 units permitted in Alameda County in 2024 (856 in 5+ unit buildings).
Forward outlook
- Local home prices are declining (-3.0%/yr); year-one equity from $2k of loan paydown is wiped out by about $10k of value loss. Plan a longer hold.
- Alameda County population projected at +34% by 2050 — long-run rental-demand tailwind backs the buy-and-hold thesis.
- At projected returns (-3.0% appreciation + 3.0% rent growth), your $91k cash investment doubles in ~10 years — after that, you're playing with house money.
Negotiation context
- Only 6 days on market — expect competitive offers; lowballing is unlikely to land.
- 2 sale attempts since 27y ago with the ask held roughly flat each time — persistent listings suggest the price (not the market) is what's stuck; bring a comps-based counter.
- Current owner paid $40k; list at $325k implies a 712% gain — meaningful room to come down on a strong offer.
Questions for the listing agent
- Is there a deadline driving the sale (1031 exchange, divorce, estate, relocation)? That informs how much negotiation room exists.
- Schools are D-rated, which usually means shorter tenancies and higher turnover. Who's the typical renter profile here, and what's been the actual vacancy rate?
- Crime grade is F in this area — have there been break-ins, vandalism, or insurance claims at this property in the last 3 years? What carrier currently insures it and at what premium?
- What's the average days-on-market for RENTAL listings here right now (not sales)? A rising rental-DOM trend means longer vacancies and softer asking-rent achievability than the comps imply.
- What's the recent tenant-quality profile in this submarket — average credit score on applications, eviction rate, late-payment / NSF rate, and stable-employment percentage? A property-management company in the area should have these aggregated.
- How much new for-sale + rental construction is in the pipeline within 1–3 miles? Heavy new supply typically softens prices + rents 12–24 months out; constrained supply supports both.
Investment metrics
- 1% rule
- 1.11% ✓
- Cap rate
- 9.79%
- Cash-on-cash
- 12.49%
- DSCR
- 1.56
- GRM
- 7.5
CMA / ARV
- ARV (on-the-fly)
- $336,000
- Comps found
- 12
Show comp detail 12 sales within ~0.75 mi
| Address | Dist | Beds/Ba | Sqft | Sold | Price | $/sf | Match |
|---|---|---|---|---|---|---|---|
| 232 Santa Susana #232 | 0.11mi | 3/2.0 | 1,678 (-0%) | 0mo | $350,000 | $209 | 94 |
| 407 Santa Monica | 0.07mi | 3/2.0 | 1,596 (-5%) | 3mo | $319,900 | $200 | 86 |
| 210 Santa Susana | 0.02mi | 2/2.0 (-1) | 1,600 (-5%) | 4mo | $320,000 | $200 | 82 |
| 227 Santa Susana | 0.09mi | 3/2.0 | 1,500 (-11%) | 12mo | $323,400 | $216 | 68 |
| 509 Santa Ynez | 0.10mi | 3/2.0 | 1,428 (-15%) | 8mo | $300,000 | $210 | 64 |
| 404 Santa Monica | 0.09mi | 2/2.0 (-1) | 1,440 (-14%) | 12mo | $199,500 | $139 | 57 |
| 154 Santa Teresa | 0.20mi | 2/2.0 (-1) | 1,440 (-14%) | 7mo | $175,900 | $122 | 56 |
| 27 Santa Anita | 0.09mi | 2/2.0 (-1) | 1,429 (-15%) | 14mo | $310,000 | $217 | 54 |
| 401 Santa Monica St #401 | 0.08mi | 2/2.0 (-1) | 1,464 (-13%) | 21mo | $199,000 | $136 | 53 |
| 375 Santa Paula | 0.32mi | 2/2.0 (-1) | 1,440 (-14%) | 4mo | $199,000 | $138 | 53 |
| 286 Santa Susana #286 | 0.38mi | 2/2.0 (-1) | 1,440 (-14%) | 2mo | $239,000 | $166 | 52 |
| 259 Santa Susana | 0.23mi | 3/2.0 | 1,440 (-14%) | 24mo | $230,000 | $160 | 46 |
Match score weights: distance 35% · size 25% · config 20% · recency 20%. Top-matched comps best support the ARV.
Projected returns pro-forma
-3.0% appreciation · 3.0% rent growth · sell at horizon
- IRR
- 2.1%
- Equity multiple
- 1.08×
- Total profit
- $7,494
- Equity at exit
- $48,459
- IRR
- 11.7%
- Equity multiple
- 1.92×
- Total profit
- $83,576
- Equity at exit
- $28,100
Cash invested: $91,000 (down + closing). Projections, not guarantees.
Landlord ↔ Tenant lean methodology
- Overall (STATE)
- 18 Strongly Tenant-Friendly
- State California
- 18 Strongly Tenant-Friendly · D+13
- County
- — inherits STATE
- City
- — inherits STATE
ZIP-level market 94579
- Active inventory
- 32
- Price-to-rent
- 7.5×
Monthly cashflow live
- Estimated rent
- $3,622 medium interval (Pro) →
- Mortgage (P&I)
- −$1,704
- Tax from tax record
- −$75 /mo · $898/yr
- Insurance
- −$135
- HOA
- −$0
- Vacancy / Maint / Mgmt
- −$761
- Net cashflow
- $947
Break-even live
UW: 25.0% down · 7.5% · 30yr · 1.5% tax · 5.0% vac · 8.0% maint · 8.0% mgmt
Financing live
Cash to close
- Down payment
- $81,250
- Closing costs
- $9,750
- Reserves months
- —
- Total cash needed
- —
Loan-product check · same deal, 3 products live
Conventional
25% down · 7.5% · 30yr
- Down + closing
- —
- Monthly P&I
- —
- Monthly cashflow
- —
- DSCR
- —
- Eligible?
- —
Personal DTI + credit; lowest rate.
DSCR
20% down · 8.5% · 30yr
- Down + closing
- —
- Monthly P&I
- —
- Monthly cashflow
- —
- DSCR
- —
- Eligible?
- —
No personal income docs; deal must DSCR.
Hard money
10% down · 12.0% · 12mo
- Down + closing
- —
- Monthly P&I
- —
- Monthly cashflow
- —
- DSCR
- —
- Eligible?
- —
Short-term bridge; refi at stabilization.
Rent comps 4 comps
| Address | Beds | Baths | Sqft | Rent | $/sqft | DOM | Units | Dist |
|---|---|---|---|---|---|---|---|---|
| 15184 Swenson St San Leandro, CA | 3.0 | 1.5 | 1700 | $3,700 | $2.18 | 1d | 1 | 1.02mi |
| Corvallis St San Leandro, CA | 3.0 | 1.0 | 1100 | $3,600 | $3.27 | 1d | 1 | 1.07mi |
| 13933 Santiago Rd San Leandro, CA | 3.0 | 2.0 | 1336 | $3,800 | $2.84 | 1d | 1 | 1.26mi |
| 2343 Fairway Dr Unit 1 San Leandro, CA | 3.0 | 2.0 | 1270 | $3,300 | $2.60 | 43d | 1 | 1.40mi |
Listing history 7 events
-
2026-06-18status $325,000 Pending 6 DOM
-
2026-06-18days on market $325,000 Active 6 DOM
-
2026-06-17days on market $325,000 Active 5 DOM
-
2026-06-16days on market $325,000 Active 4 DOM
-
2026-06-15days on market $325,000 Active 3 DOM
-
2026-06-13remarks 699-char remark
-
2026-06-13$325,000 Active 1 DOM
ⓘ Source: listings_history table (triggers on properties + properties_extension) + one-shot
backfill from property_details.listing_events for pre-trigger history.
Tax reassessment forecast CA · Resets to sale price
- Current annual tax
- $898 · $75/mo
- Projected year-2 tax
- $2,470 · $206/mo
- Expected delta
- +$1,572/yr (+$131/mo · 175.1%)
ⓘ Screening estimate from a state-policy table — verify with the county assessor before closing.
Climate risk First Street
- Flood 1/10 Low FEMA zone X (shaded) · 0% chance over 30 yrs
- Wildfire 1/10 Low
- Heat 3/10 Moderate 7 d/yr ≥85°F today · 15 d/yr by 30 yrs out
- Wind 1/10 Low
- Air quality 8/10 Severe 14 unhealthy d/yr today · 14 by 30 yrs out
Nearby sold comps map
Loading sold comps map…
Walkable amenities ~0.75 mi
Loading nearby amenities…
Taxation est. · year 1
- Rental income
- $43,465
- − Mortgage interest
- −$18,205
- − Property taxes
- −$898
- − Insurance
- −$1,625
- − Repairs & maintenance
- −$3,477
- − Management
- −$3,477
- − Depreciation
- −$9,455
- Taxable income
- $6,328
- Est. tax owed @ 24.0%
- −$1,519
- After-tax cash flow
- $9,844/yr
For passive investors: Depreciation is non-cash, so a rental often shows a tax loss while cash-flowing — sheltering income. Rental losses are passive: they offset passive income freely, and up to $25,000/yr can offset ordinary (W-2) income if you actively participate and your MAGI is under $100k (phasing out to $0 by $150k); unused losses carry forward. On sale, claimed depreciation is recaptured at up to 25%, and gains may owe capital-gains tax (a 1031 exchange can defer both). Figures are a year-1 estimate at your 24.0% rate — not tax advice; consult a CPA.
Schools (NCES district)
- District
- San Lorenzo Unified
- NCES district ID
- 0634710
- Math proficiency
- 23% ▬ 0.00%
- Reading proficiency
- 33% ▼ -1.00%
- Median HH income
- $61,114
- Composite
- 28.5/100
- National rank
- #12087
- State rank
- #1044 of 1400 in CA
Livability — San Leandro
- Score
- 68/100
- State rank
- #289
- US rank
- #9768
Category grades
Schools grade is shown separately in the Schools card above.
Census & demographics
- Census place
- San Leandro, CA
- City population
- 88,086
- Population (ZIP)
- 19,955
Population outlook (Alameda County) Hauer SSP2
- Today (2025)
- 1,928,884 people
- By 2030
- 2,069,146 · +7.3%
- By 2040
- 2,338,405 · +21.2%
- By 2050
- 2,586,608 · +34.1%
- By 2075
- 3,061,911 · +58.7%
- By 2100
- 3,234,133 · +67.7%
Race, ethnicity, and origin ACS 2023
- Neighborhood character
- Diverse neighborhood (Simpson 0.64)
- Race & ethnicity
- Asian 54% White 20% Hispanic / Latino 17% Two or more races 9% Black 3% Pacific Islander 1%
- Hispanic origin (detail)
- Mexican 11% Puerto Rican 2%
- Common ancestry
- Russian 7% American 1% Slovak 1%
- Foreign-born
- 44% · China, Canada, Vietnam
- Languages at home
- 42% English-only · Chinese 34% Spanish 9% Tagalog/Filipino 5%
Political lean MEDSL · Alameda
- 2024 margin
- Solid D (+53.6) · D 74.6% · R 21.0% · Other 4.4%
- 2008→2024 swing
- -5.9pp toward R · 2008: 59.5pp · 2024: 53.6pp
- All cycles
- 2024: D+53.6 2020: D+62.5 2016: D+64.4 2012: D+59.8 2008: D+59.5
Not yet ingested
- Civics
- —
Market trends
- HPI YoY
- ▼ -797.47%
- Current HPI
- 272.3821
- Rent YoY
- —
- Metro
- —
- State GDP YoY
- ▲ 3.21%
- F500 in state
- 116
Industry mix (Fortune 500 HQ in CA)
| Industry | F500 HQs | Revenue |
|---|---|---|
| Technology | 27 | $1,492B |
|
||
| Financial Services | 3 | $174B |
|
||
| Retail | 3 | $44B |
|
||
| Insurance | 3 | $26B |
|
||
| Media / Entertainment | 2 | $115B |
|
||
| Pharmaceuticals / Biotech | 2 | $62B |
|
||
Price history
+712.5% since first listed4 events — show timeline
- 2026-06-12 Listed $325,000 bridgeMLS, Bay East AOR, or Contra Costa AOR
- 1999-12-17 Sold (MLS) $40,000 bridgeMLS, Bay East AOR, or Contra Costa AOR
- 1999-11-11 Listing Removed — bridgeMLS, Bay East AOR, or Contra Costa AOR
- 1999-10-29 Listed $39,999 bridgeMLS, Bay East AOR, or Contra Costa AOR
Property tax history
-0.2%/yrLatest (2025): $898 · -0.4% YoY. Source: county tax records.
Cash-flow waterfall
monthlySold comps — $/sqft
last 12 mo · ≤1 miLoading sold comps…