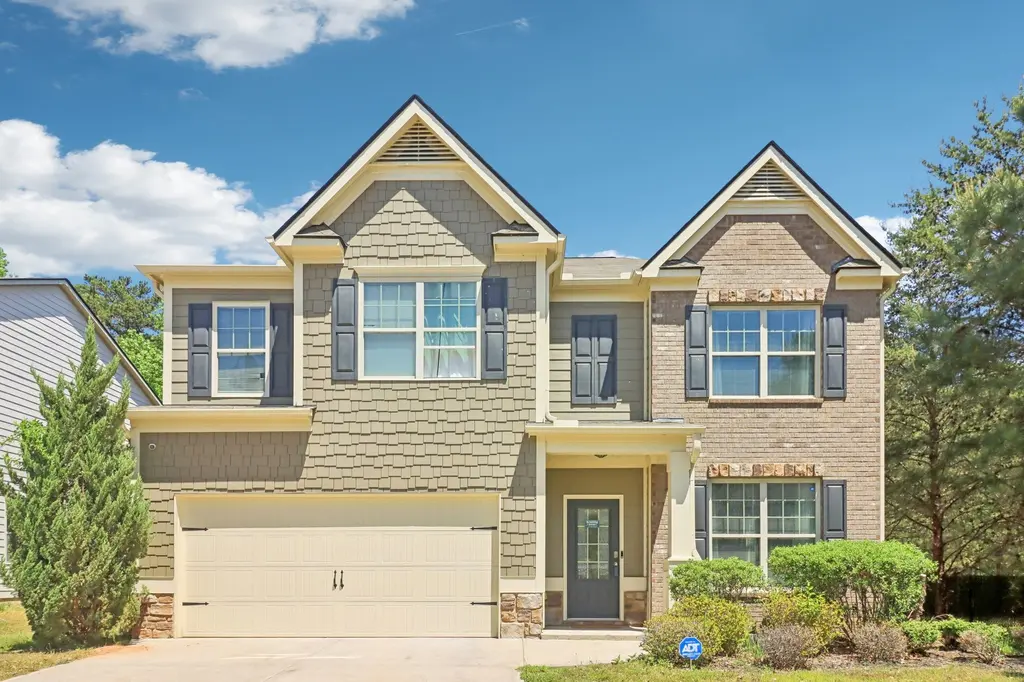
521 Greyhound Ct · South Fulton, GA
Flood risk 1/10 · Minimal
- FEMA flood zone
- X (unshaded)
- Chance of flooding over 30 yrs
- 0.0%
- Est. flood insurance / yr
- $507 – $1,088
Fire risk 3/10 · Minor
- Est. fire insurance / yr
- $963 – $1,789
Heat risk 6/10 · Moderate
- Hot days now (above 105°F)
- 7 days/yr
- Hot days in 30 yrs
- 19 days/yr
Wind risk 5/10 · Moderate
- Chance of severe wind over 30 yrs
- 26.0%
Air-quality risk 4/10 · Minor
- Unhealthy air days now
- 3 days/yr
- Unhealthy air days in 30 yrs
- 5 days/yr
Risk factors via First Street. Map © Google.
Why this score? — see what drove the D grade
The composite is a weighted blend of 9 inputs, each scored 0–100. Each bar is that input's sub-score; the figure is the points it added to the 100-point composite (weight × sub-score).
- Appreciation +10.0/10.0
- Cash flow +7.2/30.0
- ARV discount +7.1/15.0
- Schools +4.5/10.0
- Rent growth +3.1/5.0
- Livability +2.5/5.0
- Condition / age +2.5/5.0
- 1% rule +1.9/10.0
- DSCR +1.3/10.0
$399,000
🖨 Deal sheet 📄 Offer letter ✓ Due diligence
Listing remarks MLS
Welcome to this stunning 5 bedroom 3.5 bath 2 story home in sought after Oakley Township Community. Home features a host of modern upgrades blending comfort and style, that includes: LVP hardwood floors, updated modern light fixtures, an open concept family room with tile fireplace and a chef-inspired kitchen with stainless steel appliances, granite countertops, and ample white cabinetry for storage. Home also features a luxurious primary suite with tray ceiling and an ensuite with double vanities, granite countertops, jetted tub, separate shower. Upstairs boasts 4 more spacious secondary bedrooms and 3 full baths. Community amenities are a clubhouse, playground, pool and tennis courts and home is conveniently located near highways, Hartsfield Atlanta Airport, restaurants, shopping, and schools. Don't wait...call to schedule your tour today!
Key facts
- Tile fireplace
- Lvp hardwood floors
- 8,694 sq ft lot
Tags
Neighborhood map
What this means for you Summary
Snapshot
- This is a 5-bed/3.5-bath single-family listed at $399k.
Deal economics
- At list price, monthly cash flow is $-558 ($-7k/yr) — negative.
- To cash-flow at today's rent, offer at most $300k (24.7% below list).
- To meet the 1% rule (rent ≥ 1% of price), the offer needs to be $275k (31.1% below list).
- Recommended offer: $275k (31.1% below list) — sets the bar for 1% rule.
Location & tenants
- Location reads: area grade D — affects rentability + tenant quality, not the cash-flow math above.
- Fulton County (suburban): math 49% / reading 53% proficiency, ranked #12 of 174 in GA (top 7%) — acceptable for families but not a draw, mixed tenant base, ~2y average lease.
- Market conditions: Rents rising (+2.2%/yr); 167 active listings in the ZIP; 5 comparable units currently listed for rent nearby; rentals at typical pace (median 21d on market — plan ~3-4 weeks tenant-placement turnaround); 11,565 units permitted in Fulton County in 2024 (8,159 in 5+ unit buildings).
- At $2,750/mo this rent would consume 68% of the median local household income ($48k/yr) (locally 1778% of renters already pay >50% of income on rent) — very limited rent-growth headroom before tenants either downsize or default.
Forward outlook
- In year one you build about $43k of equity ($3k loan paydown + $40k appreciation (10.0% local appreciation)).
- Fulton County population projected at +38% by 2050 — long-run rental-demand tailwind backs the buy-and-hold thesis.
- By year 2, paydown + projected appreciation supports a ~$69k cash-out refi (75% LTV) — recoverable capital for the next deal without selling this one.
Negotiation context
- It's been on market 59 days — a 3% lower offer ($387k) is reasonable based on typical stale-listing flexibility.
- 6 sale attempts since 8y ago with the ask held roughly flat each time — persistent listings suggest the price (not the market) is what's stuck; bring a comps-based counter.
Risks & watch-outs
- Climate carrying-cost: moderate wind risk, 26% chance of damaging wind over 30y; extreme-heat days projected 7→19/yr by 2055 (HVAC capex compounding) — expect insurance premiums to compound above CPI over the hold.
Questions for the listing agent
- What do current leases actually rent for vs. the listed asking? Can we see a recent rent roll and the last 12 months of T-12 income?
- It's been on market 59 days. Have you received any prior offers? Is the seller open to a 31% concession, seller financing, or rate buy-down credit?
- What does the HOA fee cover, when was the last increase, and are there any pending special assessments or reserve-fund shortfalls?
- Is there a deadline driving the sale (1031 exchange, divorce, estate, relocation)? That informs how much negotiation room exists.
- The area grade is low — what's the realistic commute time and amenity access for the typical tenant pool here? Any planned neighborhood developments (good or bad) we should know about?
- What's the average days-on-market for RENTAL listings here right now (not sales)? A rising rental-DOM trend means longer vacancies and softer asking-rent achievability than the comps imply.
- What's the recent tenant-quality profile in this submarket — average credit score on applications, eviction rate, late-payment / NSF rate, and stable-employment percentage? A property-management company in the area should have these aggregated.
- How much new for-sale + rental construction is in the pipeline within 1–3 miles? Heavy new supply typically softens prices + rents 12–24 months out; constrained supply supports both.
Investment metrics
- 1% rule
- 0.69% ✗
- Cap rate
- 4.62%
- Cash-on-cash
- -5.99%
- DSCR
- 0.73
- GRM
- 12.1
CMA / ARV
- ARV (median comp)
- $395,763
- List price
- $399,000
- Delta
- 0.82%
- Verdict
- FAIR
- Comps
- 20 within 1.0 mi
Show comp detail 12 sales within ~0.75 mi
| Address | Dist | Beds/Ba | Sqft | Sold | Price | $/sf | Match |
|---|---|---|---|---|---|---|---|
| 7420 Toccoa Cir | 0.21mi | 4/2.5 (-1) | 3,046 (+1%) | 3mo | $325,000 | $107 | 77 |
| 7400 Toccoa Cir | 0.25mi | 4/2.5 (-1) | 2,907 (-4%) | 1mo | $335,000 | $115 | 72 |
| 4366 Favored Way | 0.22mi | 5/3.0 | 2,696 (-11%) | 3mo | $326,000 | $121 | 67 |
| 7695 Oakley Rd | 0.25mi | 4/3.5 (-1) | 3,212 (+6%) | 6mo | $339,000 | $106 | 67 |
| 7355 Toccoa Cir | 0.36mi | 5/3.0 | 3,138 (+4%) | 20mo | $350,000 | $112 | 58 |
| 7336 Toccoa Cir | 0.41mi | 4/2.5 (-1) | 2,983 (-1%) | 15mo | $325,000 | $109 | 57 |
| 7366 Poppy Way | 0.41mi | 4/3.5 (-1) | 3,371 (+12%) | 3mo | $350,000 | $104 | 54 |
| 2518 Quincy Loop | 0.68mi | 4/2.5 (-1) | 3,127 (+4%) | 6mo | $367,000 | $117 | 49 |
| 2518 Quincy Loop #90 | 0.68mi | 4/2.5 (-1) | 3,127 (+4%) | 6mo | $367,000 | $117 | 49 |
| 7360 Poppy Way | 0.45mi | 5/3.0 | 3,273 (+8%) | 20mo | $273,000 | $83 | 46 |
| 4422 Sonoran Way | 0.64mi | 4/2.5 (-1) | 2,991 (-1%) | 20mo | $380,000 | $127 | 43 |
| 7319 Toccoa Cir | 0.47mi | 4/2.5 (-1) | 2,788 (-8%) | 20mo | $287,500 | $103 | 39 |
Match score weights: distance 35% · size 25% · config 20% · recency 20%. Top-matched comps best support the ARV.
Projected returns pro-forma
10.0% appreciation · 2.2% rent growth · sell at horizon
- IRR
- 19.8%
- Equity multiple
- 2.61×
- Total profit
- $179,601
- Equity at exit
- $359,451
- IRR
- 18.0%
- Equity multiple
- 5.95×
- Total profit
- $552,576
- Equity at exit
- $775,169
Cash invested: $111,720 (down + closing). Projections, not guarantees.
Landlord ↔ Tenant lean methodology
- Overall (STATE)
- 90 Strongly Landlord-Friendly
- State Georgia
- 90 Strongly Landlord-Friendly · R+3
- County
- — inherits STATE
- City
- — inherits STATE
ZIP-level market 30291
- Home prices YoY
- 11.1%
- Rents YoY
- 2.2%
- Active inventory
- 167
- Price-to-rent
- 12.1×
Monthly cashflow live
- Estimated rent
- $2,750 high interval (Pro) →
- Mortgage (P&I)
- −$2,092
- Tax from tax record
- −$418 /mo · $5,011/yr
- Insurance
- −$166
- HOA
- −$54
- Vacancy / Maint / Mgmt
- −$577
- Net cashflow
- $-558
Break-even live
UW: 25.0% down · 7.5% · 30yr · 1.5% tax · 5.0% vac · 8.0% maint · 8.0% mgmt
Financing live
Cash to close
- Down payment
- $99,750
- Closing costs
- $11,970
- Reserves months
- —
- Total cash needed
- —
Loan-product check · same deal, 3 products live
Conventional
25% down · 7.5% · 30yr
- Down + closing
- —
- Monthly P&I
- —
- Monthly cashflow
- —
- DSCR
- —
- Eligible?
- —
Personal DTI + credit; lowest rate.
DSCR
20% down · 8.5% · 30yr
- Down + closing
- —
- Monthly P&I
- —
- Monthly cashflow
- —
- DSCR
- —
- Eligible?
- —
No personal income docs; deal must DSCR.
Hard money
10% down · 12.0% · 12mo
- Down + closing
- —
- Monthly P&I
- —
- Monthly cashflow
- —
- DSCR
- —
- Eligible?
- —
Short-term bridge; refi at stabilization.
Rent comps 5 comps
| Address | Beds | Baths | Sqft | Rent | $/sqft | DOM | Units | Dist |
|---|---|---|---|---|---|---|---|---|
| 370 Brannigan Ct Union City, GA | 4.0 | 2.5 | 2862 | $2,615 | $0.91 | 44d | 1 | 0.22mi |
| 7259 Madison Cir Union City, GA | 5.0 | 3.0 | 3224 | $2,899 | $0.90 | 3d | 1 | 0.66mi |
| 769 Lavender Ln Union City, GA | 4.0 | 2.5 | 2844 | $2,503 | $0.88 | 24d | 1 | 0.72mi |
| 7225 Boulder Pass Union City, GA | 4.0 | 3.5 | 2436 | $2,299 | $0.94 | 21d | 1 | 1.40mi |
| 7190 Flagstone Pl Union City, GA | 4.0 | 2.5 | 2246 | $2,255 | $1.00 | 4d | 1 | 1.44mi |
HOA detail
- Monthly dues
- $54 · $648/yr
- Likely covers
- pool
Listing history 30 events
-
2026-06-18days on market $399,000 Active 59 DOM
-
2026-06-17days on market $399,000 Active 58 DOM
-
2026-06-16days on market $399,000 Active 57 DOM
-
2026-06-15days on market $399,000 Active 56 DOM
-
2026-06-13days on market $399,000 Active 54 DOM
-
2026-06-09days on market $399,000 Active 50 DOM
-
2026-06-08days on market $399,000 Active 49 DOM
-
2026-06-07days on market $399,000 Active 48 DOM
-
2026-06-04days on market $399,000 Active 45 DOM
-
2026-06-03days on market $399,000 Active 44 DOM
-
2026-06-01days on market $399,000 Active 42 DOM
-
2026-05-31days on market $399,000 Active 41 DOM
-
2026-04-20$399,000 New 853-char remark
Show marketing remark (853 chars)
Welcome to this stunning 5 bedroom 3.5 bath 2 story home in sought after Oakley Township Community. Home features a host of modern upgrades blending comfort and style, that includes: LVP hardwood floors, updated modern light fixtures, an open concept family room with tile fireplace and a chef-inspired kitchen with stainless steel appliances, granite countertops, and ample white cabinetry for storage. Home also features a luxurious primary suite with tray ceiling and an ensuite with double vanities, granite countertops, jetted tub, separate shower. Upstairs boasts 4 more spacious secondary bedrooms and 3 full baths. Community amenities are a clubhouse, playground, pool and tennis courts and home is conveniently located near highways, Hartsfield Atlanta Airport, restaurants, shopping, and schools. Don't wait...call to schedule your tour today!
-
2026-04-20$399,000 Active 853-char remark
Show marketing remark (853 chars)
Welcome to this stunning 5 bedroom 3.5 bath 2 story home in sought after Oakley Township Community. Home features a host of modern upgrades blending comfort and style, that includes: LVP hardwood floors, updated modern light fixtures, an open concept family room with tile fireplace and a chef-inspired kitchen with stainless steel appliances, granite countertops, and ample white cabinetry for storage. Home also features a luxurious primary suite with tray ceiling and an ensuite with double vanities, granite countertops, jetted tub, separate shower. Upstairs boasts 4 more spacious secondary bedrooms and 3 full baths. Community amenities are a clubhouse, playground, pool and tennis courts and home is conveniently located near highways, Hartsfield Atlanta Airport, restaurants, shopping, and schools. Don't wait...call to schedule your tour today!
-
2025-12-11historical $1,250
-
2025-11-09$1,250
-
2024-07-31soldstatus $397,500
-
2024-07-19soldstatus $397,500 Closed
-
2024-06-13status Pending
-
2024-05-16$400,000 Active
-
2024-05-15historical $400,000
-
2018-11-19soldstatus $208,000
-
2018-10-29soldstatus $208,000 Sold
-
2018-09-22status Under Contract
-
2018-09-20price $204,900
-
2018-09-12status Back on Market
-
2018-08-22status Under Contract
-
2018-08-11price $205,000
-
2018-08-01price $210,000
-
2018-07-24$215,000 New
ⓘ Source: listings_history table (triggers on properties + properties_extension) + one-shot
backfill from property_details.listing_events for pre-trigger history.
Tax reassessment forecast GA · Resets to sale price
- Current annual tax
- $5,011 · $418/mo
- Projected year-2 tax
- $5,011 · $418/mo
- Expected delta
- $0/yr ($0/mo · 0.0%)
ⓘ Screening estimate from a state-policy table — verify with the county assessor before closing.
Climate risk First Street
- Flood 1/10 Low FEMA zone X (unshaded) · 0% chance over 30 yrs
- Wildfire 3/10 Moderate
- Heat 6/10 Major 7 d/yr ≥105°F today · 19 d/yr by 30 yrs out
- Wind 5/10 Major 26% chance of damaging wind over 30 yrs
- Air quality 4/10 Moderate 3 unhealthy d/yr today · 5 by 30 yrs out
Nearby sold comps map
Loading sold comps map…
Walkable amenities ~0.75 mi
Loading nearby amenities…
Taxation est. · year 1
- Rental income
- $32,997
- − Mortgage interest
- −$22,350
- − Property taxes
- −$5,011
- − Insurance
- −$1,995
- − Repairs & maintenance
- −$2,640
- − Management
- −$2,640
- − HOA
- −$648
- − Depreciation
- −$11,607
- Taxable loss
- −$13,894
- Est. tax savings @ 24.0%
- +$3,335
- After-tax cash flow
- $-3,360/yr
For passive investors: Depreciation is non-cash, so a rental often shows a tax loss while cash-flowing — sheltering income. Rental losses are passive: they offset passive income freely, and up to $25,000/yr can offset ordinary (W-2) income if you actively participate and your MAGI is under $100k (phasing out to $0 by $150k); unused losses carry forward. On sale, claimed depreciation is recaptured at up to 25%, and gains may owe capital-gains tax (a 1031 exchange can defer both). Figures are a year-1 estimate at your 24.0% rate — not tax advice; consult a CPA.
Schools (NCES district)
- District
- Fulton County
- NCES district ID
- 1302280
- Math proficiency
- 49% ▼ -2.00%
- Reading proficiency
- 53% ▬ 0.00%
- Median HH income
- $68,035
- Composite
- 45.33/100
- National rank
- #2640
- State rank
- #12 of 174 in GA
Livability — South Fulton
No livability data for this city. (Only ~50 U.S. cities are tracked.)
Census & demographics
- Census place
- South Fulton, GA
- County
- Fulton County · 1,094,430 people
- City population
- 127,674
- Metro
- Atlanta-Sandy Springs-Alpharetta, GA
- Population (ZIP)
- 25,130
- Household income
- $48,184
- Rent vs Own
- Severe rent burden
- 1778.0
Population outlook (Fulton County) Hauer SSP2
- Today (2025)
- 1,203,707 people
- By 2030
- 1,299,706 · +8.0%
- By 2040
- 1,488,256 · +23.6%
- By 2050
- 1,664,580 · +38.3%
- By 2075
- 2,036,072 · +69.2%
- By 2100
- 2,222,402 · +84.6%
Race, ethnicity, and origin ACS 2023
- Neighborhood character
- Predominantly Black (86%)
- Race & ethnicity
- Black 86% Hispanic / Latino 7% Two or more races 6% White 3%
- Hispanic origin (detail)
- Mexican 4%
- Common ancestry
- Italian 1%
- Foreign-born
- 5% · Canada
- Languages at home
- 92% English-only · Spanish 6%
Political lean MEDSL · Fulton
- 2024 margin
- Solid D (+44.9) · D 71.9% · R 27.0% · Other 1.1%
- 2008→2024 swing
- +9.8pp toward D · 2008: 35.0pp · 2024: 44.9pp
- All cycles
- 2024: D+44.9 2020: D+46.4 2016: D+42.1 2012: D+29.6 2008: D+35.0
Not yet ingested
- Civics
- —
Market trends
- HPI YoY
- ▲ 23.98%
- Current HPI
- 239.3471
- Rent YoY
- ▲ 2.20%
- Metro
- Atlanta-Sandy Springs-Alpharetta, GA
- State GDP YoY
- ▲ 2.66%
- F500 in state
- 28
Industry mix (Fortune 500 HQ in GA)
| Industry | F500 HQs | Revenue |
|---|---|---|
| Paper / Packaging | 2 | $29B |
|
||
| Retail | 1 | $160B |
|
||
| Transportation / Logistics | 1 | $91B |
|
||
| Airlines | 1 | $62B |
|
||
| Consumer Goods | 1 | $47B |
|
||
| Utilities | 1 | $25B |
|
||
Price history
+85.6% since first listed18 events — show timeline
- 2026-04-20 Listed $399,000 FMLS
- 2026-04-20 Listed $399,000 GAMLS
- 2025-12-11 Rental Removed $1,250 TURBOTENANT
- 2025-11-09 Listed for Rent $1,250 TURBOTENANT
- 2024-07-31 Sold (Public Records) $397,500 Public Records
- 2024-07-19 Sold (MLS) $397,500 FMLS
- 2024-06-13 Pending — FMLS
- 2024-05-16 Listed $400,000 FMLS
- 2024-05-15 Coming Soon $400,000 FMLS
- 2018-11-19 Sold (Public Records) $208,000 Public Records
- 2018-10-29 Sold (MLS) $208,000 GAMLS
- 2018-09-22 Pending — GAMLS
- 2018-09-20 Price Changed $204,900 GAMLS
- 2018-09-12 Relisted — GAMLS
- 2018-08-22 Pending — GAMLS
- 2018-08-11 Price Changed $205,000 GAMLS
- 2018-08-01 Price Changed $210,000 GAMLS
- 2018-07-24 Listed $215,000 GAMLS
Property tax history
+17.5%/yrLatest (2025): $5,011 · -11.8% YoY. Source: county tax records.
Cash-flow waterfall
monthlySold comps — $/sqft
last 12 mo · ≤1 miLoading sold comps…