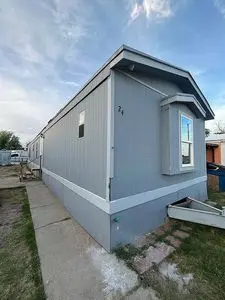
7501 Howard St · El Paso, TX
Flood risk 1/10 · Minimal
- FEMA flood zone
- X
- Chance of flooding over 30 yrs
- 0.0%
- Est. flood insurance / yr
- $507 – $1,088
Fire risk 4/10 · Minor
- Est. fire insurance / yr
- $1,222 – $2,270
Heat risk 6/10 · Moderate
- Hot days now (above 100°F)
- 8 days/yr
- Hot days in 30 yrs
- 29 days/yr
Wind risk 1/10 · Minimal
- Chance of severe wind over 30 yrs
- —
Air-quality risk 2/10 · Minimal
- Unhealthy air days now
- 1 days/yr
- Unhealthy air days in 30 yrs
- 2 days/yr
Risk factors via First Street. Map © Google.
Why this score? — see what drove the B grade
The composite is a weighted blend of 9 inputs, each scored 0–100. Each bar is that input's sub-score; the figure is the points it added to the 100-point composite (weight × sub-score).
- Cash flow +30.0/30.0
- 1% rule +10.0/10.0
- DSCR +10.0/10.0
- ARV discount +7.5/15.0
- Livability +4.0/5.0
- Condition / age +3.8/5.0
- Schools +2.7/10.0
- Rent growth +2.6/5.0
- Appreciation +0.0/10.0
$67,000
🖨 Deal sheet 📄 Offer letter ✓ Due diligence
Listing remarks
Own a 3-bedroom, 2-bath home in El Paso for about half the cost of a traditional mortgage and take the next step toward affordable homeownership today! This spacious 1,200 sq ft home is located in Northeast El Paso at 7501 Howard St inside a well-established mobile home community and offers a practical path to ownership for families, first-time buyers, and anyone tired of rising rent payments. Recent upgrades include: ? Luxury vinyl plank flooring throughout ? New water lines installed throughout the home ? New 4-ton HVAC system with all new ducting ? Fresh interior paint ? Driveway plus additional exterior parking This home is available with seller financing, making it easier to qualify
Key facts
- Fresh interior paint
- New water lines
- New hvac system
Tags
Property features AI
Exterior
- Home design: Built in 1986
- Exterior features: Property in Sunrise Acres East subdivision
Interior
- Interior features: Open living spaces (living area approximately 1,216); Located in the Sunrise Acres East subdivision
Neighborhood map
What this means for you Summary
Snapshot
- This is a 3-bed/2.0-bath other listed at $67k. Condition is rated good.
Deal economics
- At list price, monthly cash flow is $520 ($6k/yr) — positive.
- The deal already cash-flows at list — no discount required.
- Meets the 1% rule at list price ($1k rent vs $67k).
Location & tenants
- Location reads 81/100 on livability (#23 in TX, #1,375 nationally) — a professional / high-income tenant draw. Strengths: commute A+, cost of living A+, housing A+; Watch: employment D+.
- El Paso ISD (urban): math 27% / reading 37% proficiency, ranked #591 of 826 in TX (top 72%) — families likely to look elsewhere, expect single-tenant / working-renter base with shorter leases; 65% free/reduced lunch — lower-income household profile, screen leases tightly.
- Market conditions: Rents flat; 82 active listings in the ZIP; 31 comparable units currently listed for rent nearby; rentals at typical pace (median 24d on market — plan ~3-4 weeks tenant-placement turnaround); lower-income renter base — watch delinquency; 2,196 units permitted in El Paso County in 2024 (143 in 5+ unit buildings).
- This rent runs 36% of the median local income ($42k/yr) — at the standard rent-burdened threshold; future hikes will face affordability resistance.
Forward outlook
- Local home prices are declining (-3.0%/yr); year-one equity from $463 of loan paydown is wiped out by about $2k of value loss. Plan a longer hold.
- El Paso County population projected at +10% by 2050 — modest demand growth; plan on rents tracking national, not racing it.
- At projected returns (-3.0% appreciation + 0.4% rent growth), your $19k cash investment doubles in ~4 years — after that, you're playing with house money.
Negotiation context
- Only 1 days on market — expect competitive offers; lowballing is unlikely to land.
Risks & watch-outs
- Climate carrying-cost: extreme-heat days projected 8→29/yr by 2055 (HVAC capex compounding) — expect insurance premiums to compound above CPI over the hold.
Questions for the listing agent
- Is there a deadline driving the sale (1031 exchange, divorce, estate, relocation)? That informs how much negotiation room exists.
- Schools are B-rated — typically a magnet for longer-tenancy family renters. What's the average tenant stay here, and is there a school-zone premium baked into asking?
- What's the average days-on-market for RENTAL listings here right now (not sales)? A rising rental-DOM trend means longer vacancies and softer asking-rent achievability than the comps imply.
- What's the recent tenant-quality profile in this submarket — average credit score on applications, eviction rate, late-payment / NSF rate, and stable-employment percentage? A property-management company in the area should have these aggregated.
- How much new for-sale + rental construction is in the pipeline within 1–3 miles? Heavy new supply typically softens prices + rents 12–24 months out; constrained supply supports both.
Investment metrics
- 1% rule
- 1.86% ✓
- Cap rate
- 15.61%
- Cash-on-cash
- 33.29%
- DSCR
- 2.48
- GRM
- 4.5
CMA / ARV
No comps found within radius.
Projected returns pro-forma
-3.0% appreciation · 0.38% rent growth · sell at horizon
- IRR
- 25.5%
- Equity multiple
- 2.02×
- Total profit
- $19,110
- Equity at exit
- $9,990
- IRR
- 31.6%
- Equity multiple
- 3.50×
- Total profit
- $46,946
- Equity at exit
- $5,793
Cash invested: $18,760 (down + closing). Projections, not guarantees.
Landlord ↔ Tenant lean methodology
- Overall (STATE)
- 87 Strongly Landlord-Friendly
- State Texas
- 87 Strongly Landlord-Friendly · R+5
- County
- — inherits STATE
- City
- — inherits STATE
ZIP-level market 79904
- Home prices YoY
- -13.4%
- Rents YoY
- 0.4%
- Active inventory
- 82
- Price-to-rent
- 4.5×
Monthly cashflow live
- Estimated rent
- $1,245 high interval (Pro) →
- Mortgage (P&I)
- −$351
- Tax est. 1.5%
- −$84 /mo · $1,005/yr
- Insurance
- −$28
- HOA
- −$0
- Vacancy / Maint / Mgmt
- −$261
- Net cashflow
- $520
Break-even live
UW: 25.0% down · 7.5% · 30yr · 1.5% tax · 5.0% vac · 8.0% maint · 8.0% mgmt
Financing live
Cash to close
- Down payment
- $16,750
- Closing costs
- $2,010
- Reserves months
- —
- Total cash needed
- —
Loan-product check · same deal, 3 products live
Conventional
25% down · 7.5% · 30yr
- Down + closing
- —
- Monthly P&I
- —
- Monthly cashflow
- —
- DSCR
- —
- Eligible?
- —
Personal DTI + credit; lowest rate.
DSCR
20% down · 8.5% · 30yr
- Down + closing
- —
- Monthly P&I
- —
- Monthly cashflow
- —
- DSCR
- —
- Eligible?
- —
No personal income docs; deal must DSCR.
Hard money
10% down · 12.0% · 12mo
- Down + closing
- —
- Monthly P&I
- —
- Monthly cashflow
- —
- DSCR
- —
- Eligible?
- —
Short-term bridge; refi at stabilization.
Rent comps 31 comps
| Address | Beds | Baths | Sqft | Rent | $/sqft | DOM | Units | Dist |
|---|---|---|---|---|---|---|---|---|
| 7505 Golden Knight Unit A El Paso, TX | 3.0 | 2.5 | 1214 | $1,225 | $1.01 | 21d | 1 | 0.36mi |
| 7509 Golden Knight Unit A El Paso, TX | 3.0 | 2.0 | 984 | $1,295 | $1.32 | 2d | 1 | 0.37mi |
| 8308 Capitan Cir El Paso, TX | 2.0 | 1.0 | 874 | $1,250 | $1.43 | 2d | 1 | 0.55mi |
| 4117 Volcanic Ave El Paso, TX | 3.0 | 1.5 | 1425 | $1,450 | $1.02 | 43d | 1 | 0.57mi |
| 4120 Olympic Ave Unit B El Paso, TX | 3.0 | 2.0 | 984 | $1,325 | $1.35 | 43d | 1 | 0.65mi |
| 4016 Titanic Ave El Paso, TX | 3.0 | 2.0 | 1426 | $1,600 | $1.12 | 2d | 1 | 0.66mi |
| 7598 Diana Dr El Paso, TX | 3.0 | 2.0 | 1018 | $1,092 | $1.07 | 2d | 2 | 0.69mi |
| 4809 Sierra Madre Dr El Paso, TX | 2.0 | 2.0 | 844 | $1,250 | $1.48 | 2d | 1 | 0.71mi |
| 8604 Lawson St Unit 3 El Paso, TX | 2.0 | 1.0 | 762 | $745 | $0.98 | 2d | 1 | 0.74mi |
| 3913 Titanic Ave El Paso, TX | 4.0 | 2.0 | 1272 | $1,600 | $1.26 | 43d | 1 | 0.78mi |
| 8700 Norton St Unit 50-23C El Paso, TX | 2.0 | 1.0 | 830 | $749 | $0.90 | 2d | 1 | 0.86mi |
| 8700 Norton St Unit 00-27A El Paso, TX | 2.0 | 1.0 | 830 | $699 | $0.84 | 43d | 1 | 0.86mi |
| 8700 Norton St Unit 50-14C El Paso, TX | 2.0 | 1.0 | 830 | $749 | $0.90 | 23d | 1 | 0.86mi |
| 8609 Mercury St Unit B El Paso, TX | 3.0 | 1.0 | 814 | $1,450 | $1.78 | 14d | 1 | 0.91mi |
| 5021 Tetons Dr El Paso, TX | 3.0 | 1.0 | 907 | $1,350 | $1.49 | 14d | 1 | 1.01mi |
| 3615 Olympic Ave El Paso, TX | 2.0 | 2.0 | 1458 | $1,450 | $0.99 | 2d | 1 | 1.04mi |
| 8909 Herbert St Unit C El Paso, TX | 3.0 | 2.0 | 1000 | $1,025 | $1.02 | 43d | 1 | 1.10mi |
| 5216 Adolphus Ave El Paso, TX | 1.0–2.0 | 1.0 | 800 | $788 | $0.98 | 43d | 1 | 1.11mi |
| 8640 Mount Whitney Dr El Paso, TX | 3.0 | 1.0 | 925 | $1,169 | $1.26 | 43d | 1 | 1.14mi |
| 8929 Robert Dr Unit Back El Paso, TX | 2.0 | 1.0 | 800 | $1,000 | $1.25 | 23d | 1 | 1.16mi |
| 8929 Robert Dr El Paso, TX | 3.0 | 1.0 | 1024 | $1,450 | $1.42 | 43d | 1 | 1.16mi |
| 8931 Marks St Unit C El Paso, TX | 2.0 | 2.0 | 812 | $1,200 | $1.48 | 14d | 1 | 1.17mi |
| 8931 Marks St Unit C El Paso, TX | 2.0 | 2.0 | 812 | $1,200 | $1.48 | 23d | 1 | 1.17mi |
| 8933 Kenneth St Unit B El Paso, TX | 2.0 | 1.0 | 851 | $950 | $1.12 | 43d | 1 | 1.19mi |
| 8939 Marks St Unit B El Paso, TX | 2.0 | 2.0 | 839 | $1,195 | $1.42 | 43d | 1 | 1.20mi |
| 8944 Herbert St Unit B El Paso, TX | 3.0 | 2.0 | 1207 | $1,375 | $1.14 | 23d | 1 | 1.21mi |
| 8724 Polaris St El Paso, TX | 3.0 | 2.0 | 1072 | $1,495 | $1.39 | 14d | 1 | 1.24mi |
| 3809 Moonlight Ave Unit A El Paso, TX | 3.0 | 2.0 | 980 | $1,250 | $1.28 | 23d | 1 | 1.35mi |
| 4220 Broaddus Ave El Paso, TX | 2.0 | 1.0 | 986 | $1,000 | $1.01 | 14d | 1 | 1.36mi |
| 3817 Thomason Ave El Paso, TX | 3.0 | 1.0 | 1088 | $1,245 | $1.14 | 43d | 1 | 1.44mi |
| 4006 Skyline Ave Unit A El Paso, TX | 2.0 | 1.0 | 981 | $1,225 | $1.25 | 43d | 1 | 1.46mi |
Listing history 1 events
-
2026-05-26$67,000 Active
ⓘ Source: listings_history table (triggers on properties + properties_extension) + one-shot
backfill from property_details.listing_events for pre-trigger history.
Climate risk First Street
- Flood 1/10 Low FEMA zone X · 0% chance over 30 yrs
- Wildfire 4/10 Moderate
- Heat 6/10 Major 8 d/yr ≥100°F today · 29 d/yr by 30 yrs out
- Wind 1/10 Low
- Air quality 2/10 Low 1 unhealthy d/yr today · 2 by 30 yrs out
Nearby sold comps map
Loading sold comps map…
Walkable amenities ~0.75 mi
Loading nearby amenities…
Taxation est. · year 1
- Rental income
- $14,938
- − Mortgage interest
- −$3,753
- − Property taxes
- −$1,005
- − Insurance
- −$335
- − Repairs & maintenance
- −$1,195
- − Management
- −$1,195
- − Depreciation
- −$1,949
- Taxable income
- $5,506
- Est. tax owed @ 24.0%
- −$1,321
- After-tax cash flow
- $4,924/yr
For passive investors: Depreciation is non-cash, so a rental often shows a tax loss while cash-flowing — sheltering income. Rental losses are passive: they offset passive income freely, and up to $25,000/yr can offset ordinary (W-2) income if you actively participate and your MAGI is under $100k (phasing out to $0 by $150k); unused losses carry forward. On sale, claimed depreciation is recaptured at up to 25%, and gains may owe capital-gains tax (a 1031 exchange can defer both). Figures are a year-1 estimate at your 24.0% rate — not tax advice; consult a CPA.
Condition & rehab AI · 1 photo
This 3-bedroom, 2-bath home in El Paso is in good condition with recent upgrades, making it a good investment opportunity.
Value-add opportunities
- Both Landscaping and curb appeal improvements — Enhances the home's aesthetic appeal and could attract more buyers or renters.
- Both Interior updates — Fresh paint and flooring can make the home more appealing and increase its value.
- Both Exterior updates — Improving the exterior can enhance the home's curb appeal and attract more buyers or renters.
Renovation cost estimate screening
Value-add ROI direction
- Both Landscaping and curb appeal improvements — Enhances the home's aesthetic appeal and could attract more buyers or renters. ↑
- Both Interior updates — Fresh paint and flooring can make the home more appealing and increase its value. ↑
- Both Exterior updates — Improving the exterior can enhance the home's curb appeal and attract more buyers or renters. ↑
ⓘ Cost ranges are severity-bucket heuristics (US national rule-of-thumb). Get contractor quotes + a written scope before underwriting a rehab budget.
Schools (NCES district)
- District
- El Paso ISD
- NCES district ID
- 4818300
- Math proficiency
- 27% ▼ -24.00%
- Reading proficiency
- 37% ▼ -7.00%
- Median HH income
- $38,704
- Composite
- 26.75/100
- National rank
- #7138
- State rank
- #591 of 826 in TX
Livability — El Paso
- Score
- 81/100
- State rank
- #23
- US rank
- #1375
Category grades
Schools grade is shown separately in the Schools card above.
Census & demographics
- Census place
- El Paso, TX
- County
- El Paso County · 761,266 people
- City population
- 630,223
- Metro
- El Paso, TX
- Population (ZIP)
- 32,976
- Household income
- $41,841
- Rent vs Own
- Severe rent burden
- 1866.0
Population outlook (El Paso County) Hauer SSP2
- Today (2025)
- 897,899 people
- By 2030
- 922,694 · +2.8%
- By 2040
- 960,492 · +7.0%
- By 2050
- 982,919 · +9.5%
- By 2075
- 997,266 · +11.1%
- By 2100
- 900,630 · +0.3%
Race, ethnicity, and origin ACS 2023
- Neighborhood character
- Predominantly Hispanic (73%)
- Race & ethnicity
- Hispanic / Latino 73% Two or more races 40% White 17% Black 6% Asian 2%
- Hispanic origin (detail)
- Mexican 67% Puerto Rican 2%
- Common ancestry
- Italian 1% Romanian 1% Lithuanian 1%
- Foreign-born
- 22% · Canada
- Languages at home
- 40% English-only · Spanish 58% Other Asian/Pacific 1%
Political lean MEDSL · El Paso
- 2024 margin
- D (+15.1) · D 57.0% · R 41.8% · Other 1.2%
- 2008→2024 swing
- -17.4pp toward R · 2008: 32.5pp · 2024: 15.1pp
- All cycles
- 2024: D+15.1 2020: D+35.1 2016: D+43.2 2012: D+32.6 2008: D+32.5
Not yet ingested
- Civics
- —
Market trends
- HPI YoY
- ▼ -37.17%
- Current HPI
- 239.8876
- Rent YoY
- ▲ 0.38%
- Metro
- El Paso, TX
- State GDP YoY
- ▲ 3.95%
- F500 in state
- 110
Industry mix (Fortune 500 HQ in TX)
| Industry | F500 HQs | Revenue |
|---|---|---|
| Energy | 16 | $1,198B |
|
||
| Technology | 5 | $198B |
|
||
| Engineering / Construction | 4 | $72B |
|
||
| Energy Services | 3 | $60B |
|
||
| Utilities | 3 | $41B |
|
||
| Healthcare | 2 | $330B |
|
||
Price history
1 event — show timeline
- 2026-05-26 Listed $67,000 FSBO.com
Cash-flow waterfall
monthlySold comps — $/sqft
last 12 mo · ≤1 miLoading sold comps…