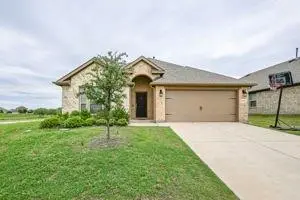
4016 Windswept Way · Forney, TX
Flood risk 1/10 · Minimal
- FEMA flood zone
- X (unshaded)
- Chance of flooding over 30 yrs
- 0.0%
- Est. flood insurance / yr
- $507 – $1,088
Fire risk 5/10 · Moderate
- Est. fire insurance / yr
- $1,222 – $2,270
Heat risk 8/10 · Major
- Hot days now (above 110°F)
- 7 days/yr
- Hot days in 30 yrs
- 25 days/yr
Wind risk 6/10 · Moderate
- Chance of severe wind over 30 yrs
- 27.0%
Air-quality risk 2/10 · Minimal
- Unhealthy air days now
- 1 days/yr
- Unhealthy air days in 30 yrs
- 1 days/yr
Risk factors via First Street. Map © Google.
Why this score? — see what drove the D grade
The composite is a weighted blend of 9 inputs, each scored 0–100. Each bar is that input's sub-score; the figure is the points it added to the 100-point composite (weight × sub-score).
- ARV discount +13.7/15.0
- Cash flow +7.1/30.0
- Schools +4.0/10.0
- Condition / age +4.0/5.0
- 1% rule +3.9/10.0
- Livability +3.8/5.0
- Rent growth +2.9/5.0
- DSCR +1.3/10.0
- Appreciation +0.0/10.0
$299,000
🖨 Deal sheet 📄 Offer letter ✓ Due diligence
Listing remarks
PRICE IMPROVEMENT Welcome to 4016 Windswept Way, a well-maintained 3-bedroom, 2-bath home located on an oversized corner lot in the Lakewood Trails community in Forney. This home offers an open floor plan that works well for both everyday living and entertaining, along with a dedicated office space for added flexibility. The main living area features a cozy fireplace and flows into the kitchen and dining areas, creating a comfortable gathering space. The primary suite provides a private retreat, while the secondary bedrooms are well-sized for family, guests, or additional use. The spacious backyard offers plenty of room for outdoor activities, pets, or future improvements. Conveniently
Key facts
- Oversized corner lot
- Spacious backyard
- Community lake
Tags
Property features AI
Finance
- Other: Listing allows conventional, cash, FHA, and VA financing; Special listing conditions: Standard
- HOA & community: Mandatory HOA; HOA semi-annual fee; includes grounds maintenance; HOA management: Neighborhood Management
Exterior
- Parking: Attached 2-car garage (approx. 19' wide x 18' long, 20' height); 2 covered parking spaces; Driveway
- Security: Smoke detectors; Carbon monoxide detectors
- Utilities: City water; City sewer; Electricity connected; Individual gas meter; Not in a municipal utility district
- Home design: Single-family residence; Residential property; One story; Preowned (built in 2021); Subdivision: Lakewood Trails Add
- Construction: Brick and rock/stone exterior; Built in 2021; Preowned
- Exterior features: Covered porch(es); Covered patio/porch; Gutters; Wood fencing; Large backyard with grass; Sprinkler system; Corner lot; Irrigation equipment; Easements for utilities
Interior
- Kitchen: Granite countertops; Kitchen island; Breakfast bar; Pantry; Water line to refrigerator; Dishwasher; Gas range; Microwave; Refrigerator; Disposal
- Bedrooms: Primary bedroom on level 1 (approx. 12 x 16); Two additional bedrooms on level 1 with walk-in closets (approx. 10 x 11 and 11 x 11)
- Bathrooms: Two full bathrooms; Primary bathroom with built-in cabinets, dual sinks, garden tub and separate shower (ensuite)
- Heating & cooling: Central heating (natural gas); Fireplace(s) for supplemental heat; Central air conditioning (electric); Ceiling fans
- Interior features: Decorative lighting; Granite counters; High-speed internet available; Kitchen island; Pantry; Walk-in closets; One living area; Two dining areas; Room count: 10; Levels: One
- Laundry & utility: Utility room with built-in cabinets (approx. 7 x 5); Tankless water heater; Gas water heater
Neighborhood map
What this means for you Summary
Snapshot
- This is a 3-bed/2.0-bath single-family listed at $299k. Condition is rated good.
Deal economics
- At list price, monthly cash flow is $-425 ($-5k/yr) — negative.
- To cash-flow at today's rent, offer at most $224k (25.1% below list).
- To meet the 1% rule (rent ≥ 1% of price), the offer needs to be $265k (11.5% below list).
- Recommended offer: $224k (25.1% below list) — sets the bar for cash-flow.
Location & tenants
- Location reads 76/100 on livability (#98 in TX, #3,339 nationally) — a middle-class / working-renter tenant base. Strengths: crime A+, employment A+, cost of living A+; Watch: amenities C-, commute F.
- Forney ISD (rural): math 41% / reading 44% proficiency, ranked #234 of 826 in TX (top 28%) — families likely to look elsewhere, expect single-tenant / working-renter base with shorter leases.
- Zoned schools: Henderson El (math 52% / reading 54%, grade C, #705 of 4,322 statewide, top 17%, 737 students, 50% FRL) — zoned schools average 50% FRL vs 26% district-wide (23 pts higher); higher-poverty schools than district average — tighter screening recommended.
- Market conditions: Rents rising (+1.4%/yr); 2179 active listings in the ZIP; 24 comparable units currently listed for rent nearby; rentals lingering (median 44d on market — plan ~5-8 weeks vacancy on turnover, expect pricing pressure); 50% of comp listings sitting > 30 days — soft ceiling on asking rent; solid renter incomes; 1,747 units permitted in Kaufman County in 2024 (180 in 5+ unit buildings).
- This rent runs 31% of the median local income ($104k/yr) — at the standard rent-burdened threshold; future hikes will face affordability resistance.
Forward outlook
- Local home prices are declining (-3.0%/yr); year-one equity from $2k of loan paydown is wiped out by about $9k of value loss. Plan a longer hold.
- Kaufman County population projected at +43% by 2050 — long-run rental-demand tailwind backs the buy-and-hold thesis.
Negotiation context
- It's been on market 46 days — a 3% lower offer ($290k) is reasonable based on typical stale-listing flexibility.
- 3 sale attempts since 2y ago; this cycle's ask has dropped $20k (6%) from the opening price — seller is motivated, your offer sets the floor, not the list.
Risks & watch-outs
- Watch-outs: property tax is 3.0% of price.
- Climate carrying-cost: major wind risk, 27% chance of damaging wind over 30y; moderate wildfire risk; extreme-heat days projected 7→25/yr by 2055 (HVAC capex compounding) — expect insurance premiums to compound above CPI over the hold.
Questions for the listing agent
- What do current leases actually rent for vs. the listed asking? Can we see a recent rent roll and the last 12 months of T-12 income?
- It's been on market 46 days. Have you received any prior offers? Is the seller open to a 25% concession, seller financing, or rate buy-down credit?
- Property tax is high relative to price — has the assessment been appealed recently, and will the sale trigger a re-assessment?
- What does the HOA fee cover, when was the last increase, and are there any pending special assessments or reserve-fund shortfalls?
- Is there a deadline driving the sale (1031 exchange, divorce, estate, relocation)? That informs how much negotiation room exists.
- Schools are B-rated — typically a magnet for longer-tenancy family renters. What's the average tenant stay here, and is there a school-zone premium baked into asking?
- The area grade is low — what's the realistic commute time and amenity access for the typical tenant pool here? Any planned neighborhood developments (good or bad) we should know about?
- What's the average days-on-market for RENTAL listings here right now (not sales)? A rising rental-DOM trend means longer vacancies and softer asking-rent achievability than the comps imply.
- What's the recent tenant-quality profile in this submarket — average credit score on applications, eviction rate, late-payment / NSF rate, and stable-employment percentage? A property-management company in the area should have these aggregated.
- How much new for-sale + rental construction is in the pipeline within 1–3 miles? Heavy new supply typically softens prices + rents 12–24 months out; constrained supply supports both.
Investment metrics
- 1% rule
- 0.89% ✗
- Cap rate
- 4.59%
- Cash-on-cash
- -6.09%
- DSCR
- 0.73
- GRM
- 9.4
CMA / ARV
- ARV (median comp)
- $346,725
- List price
- $299,000
- Delta
- -13.76%
- Verdict
- UNDERPRICED
- Comps
- 20 within 1.0 mi
Show comp detail 12 sales within ~0.75 mi
| Address | Dist | Beds/Ba | Sqft | Sold | Price | $/sf | Match |
|---|---|---|---|---|---|---|---|
| 4014 Poplar Dr | 0.18mi | 4/2.0 (+1) | 2,006 (+6%) | 0mo | $299,900 | $150 | 77 |
| 4117 Plateau Dr | 0.24mi | 4/2.0 (+1) | 1,832 (-4%) | 4mo | $329,540 | $180 | 75 |
| 4111 Beamer Dr | 0.14mi | 4/2.0 (+1) | 2,038 (+7%) | 2mo | $315,000 | $155 | 75 |
| 4174 Plateau Dr | 0.32mi | 4/2.0 (+1) | 1,935 (+2%) | 4mo | $340,490 | $176 | 74 |
| 4303 Brenton Ln | 0.28mi | 4/2.0 (+1) | 1,832 (-4%) | 5mo | $329,490 | $180 | 72 |
| 4113 Plateau Dr | 0.24mi | 4/2.0 (+1) | 2,065 (+9%) | 3mo | $354,540 | $172 | 67 |
| 4200 Plateau Dr | 0.43mi | 4/2.0 (+1) | 1,832 (-4%) | 4mo | $320,990 | $175 | 65 |
| 4180 Plateau Dr | 0.35mi | 4/2.0 (+1) | 2,035 (+7%) | 3mo | $350,490 | $172 | 64 |
| 4168 Plateau Dr | 0.30mi | 4/3.0 (+1) | 2,014 (+6%) | 4mo | $362,750 | $180 | 64 |
| 4194 Plateau Dr | 0.41mi | 4/2.0 (+1) | 2,014 (+6%) | 4mo | $359,490 | $178 | 63 |
| 4172 Plateau Dr | 0.32mi | 4/2.0 (+1) | 2,065 (+9%) | 4mo | $362,490 | $176 | 63 |
| 2465 Willard Way | 0.66mi | 4/2.0 (+1) | 1,627 (-14%) | 4mo | $289,990 | $178 | 36 |
Match score weights: distance 35% · size 25% · config 20% · recency 20%. Top-matched comps best support the ARV.
Projected returns pro-forma
-3.0% appreciation · 1.42% rent growth · sell at horizon
- IRR
- -28.9%
- Equity multiple
- 0.05×
- Total profit
- $-79,323
- Equity at exit
- $44,582
- IRR
- -38.3%
- Equity multiple
- -0.42×
- Total profit
- $-119,080
- Equity at exit
- $25,852
Cash invested: $83,720 (down + closing). Projections, not guarantees.
Landlord ↔ Tenant lean methodology
- Overall (STATE)
- 87 Strongly Landlord-Friendly
- State Texas
- 87 Strongly Landlord-Friendly · R+5
- County
- — inherits STATE
- City
- — inherits STATE
ZIP-level market 75126
- Rents YoY
- 1.4%
- Active inventory
- 2179
- Price-to-rent
- 9.4×
Monthly cashflow live
- Estimated rent
- $2,646 high interval (Pro) →
- Mortgage (P&I)
- −$1,568
- Tax from tax record
- −$758 /mo · $9,094/yr
- Insurance
- −$125
- HOA
- −$65
- Vacancy / Maint / Mgmt
- −$556
- Net cashflow
- $-425
Break-even live
UW: 25.0% down · 7.5% · 30yr · 1.5% tax · 5.0% vac · 8.0% maint · 8.0% mgmt
Financing live
Cash to close
- Down payment
- $74,750
- Closing costs
- $8,970
- Reserves months
- —
- Total cash needed
- —
Loan-product check · same deal, 3 products live
Conventional
25% down · 7.5% · 30yr
- Down + closing
- —
- Monthly P&I
- —
- Monthly cashflow
- —
- DSCR
- —
- Eligible?
- —
Personal DTI + credit; lowest rate.
DSCR
20% down · 8.5% · 30yr
- Down + closing
- —
- Monthly P&I
- —
- Monthly cashflow
- —
- DSCR
- —
- Eligible?
- —
No personal income docs; deal must DSCR.
Hard money
10% down · 12.0% · 12mo
- Down + closing
- —
- Monthly P&I
- —
- Monthly cashflow
- —
- DSCR
- —
- Eligible?
- —
Short-term bridge; refi at stabilization.
Rent comps 24 comps
| Address | Beds | Baths | Sqft | Rent | $/sqft | DOM | Units | Dist |
|---|---|---|---|---|---|---|---|---|
| 4005 Waterford Dr Forney, TX | 4.0 | 2.0 | 1852 | $2,350 | $1.27 | 43d | 1 | 0.11mi |
| 4306 Paxton Dr Forney, TX | 4.0 | 2.0 | 1837 | $2,600 | $1.42 | 43d | 1 | 0.19mi |
| 4170 Plateau Dr Forney, TX | 4.0 | 2.0 | 2100 | $3,573 | $1.70 | 43d | 1 | 0.30mi |
| 2140 Florence Dr Forney, TX | 4.0 | 2.5 | 2032 | $2,600 | $1.28 | 43d | 1 | 0.31mi |
| 4162 Rim Trl Forney, TX | 4.0 | 2.0 | 1916 | $2,500 | $1.30 | 43d | 1 | 0.33mi |
| 4178 Plateau Dr Forney, TX | 4.0 | 2.0 | 1832 | $3,573 | $1.95 | 44d | 1 | 0.33mi |
| 2302 Doe Branch Ln Forney, TX | 4.0 | 2.5 | 2457 | $2,750 | $1.12 | 22d | 1 | 0.35mi |
| 4186 Rim Trl Forney, TX | 4.0 | 2.0 | 2060 | $2,750 | $1.33 | 43d | 1 | 0.41mi |
| 2503 Blue Oasis Ct Forney, TX | 4.0 | 2.5 | 2127 | $2,499 | $1.17 | 7d | 1 | 0.41mi |
| 4198 Plateau Dr Forney, TX | 4.0 | 2.0 | 1832 | $3,573 | $1.95 | 43d | 1 | 0.41mi |
| 1308 Middlebrooks Dr Forney, TX | 4.0 | 2.5 | 2231 | $2,650 | $1.19 | 44d | 1 | 0.61mi |
| 1450 Arabella Ave Forney, TX | 4.0 | 2.0 | 1636 | $2,250 | $1.38 | 13d | 1 | 0.79mi |
| 107 Huckleberry Rd Forney, TX | 4.0 | 2.5 | 2186 | $2,900 | $1.33 | 43d | 1 | 0.80mi |
| 2850 Dusty Rd Forney, TX | 4.0 | 3.0 | 2115 | $2,450 | $1.16 | 19d | 1 | 0.82mi |
| 413 Driftwood Ct Forney, TX | 3.0 | 2.0 | 1733 | $1,999 | $1.15 | 10d | 1 | 1.23mi |
| 413 Driftwood Ct Forney, TX | 3.0 | 2.0 | 1733 | $2,000 | $1.15 | 15d | 1 | 1.23mi |
| 731 Lauren Grove Ln Forney, TX | 3.0 | 2.0 | 1832 | $2,700 | $1.47 | 24d | 1 | 1.34mi |
| 3204 Stanley St Forney, TX | 4.0 | 2.5 | 2425 | $2,400 | $0.99 | 24d | 1 | 1.36mi |
| 3137 Grimaldo Dr Forney, TX | 3.0 | 2.0 | 1585 | $2,195 | $1.38 | 24d | 1 | 1.37mi |
| 3137 Grimaldo Dr Forney, TX | 3.0 | 2.0 | 1565 | $1,995 | $1.27 | 13d | 1 | 1.37mi |
| 3001 Glazner Dr Forney, TX | 3.0 | 2.0 | 1510 | $2,350 | $1.56 | 43d | 1 | 1.42mi |
| 3012 Glazner Dr Forney, TX | 3.0 | 2.5 | 1984 | $2,195 | $1.11 | 4d | 1 | 1.46mi |
| 2035 Karsen Ln Heartland, TX | 4.0 | 2.0 | 1587 | $2,125 | $1.34 | 1d | 1 | 1.49mi |
| 315 Red Oak Ct Forney, TX | 3.0 | 2.0 | 1927 | $2,100 | $1.09 | 43d | 1 | 1.49mi |
HOA detail
- Monthly dues
- $65 · $780/yr
Listing history 19 events
-
2026-06-18days on market $299,000 Active 46 DOM
-
2026-06-17days on market $299,000 Active 45 DOM
-
2026-06-16days on market $299,000 Active 44 DOM
-
2026-06-15days on market $299,000 Active 43 DOM
-
2026-06-13days on market $299,000 Active 41 DOM
-
2026-06-13days on market $299,000 Active 40 DOM
-
2026-06-09days on market $299,000 Active 37 DOM
-
2026-06-08days on market $299,000 Active 36 DOM
-
2026-06-07days on market $299,000 Active 35 DOM
-
2026-06-04days on market $299,000 Active 32 DOM
-
2026-06-03days on market $299,000 Active 31 DOM
-
2026-06-02days on market $299,000 Active 30 DOM
-
2026-06-01pricedays on market $299,000 Active 29 DOM
-
2026-05-31days on market $319,000 Active 28 DOM
-
2026-05-02$319,000 Active 1097-char remark
-
2024-11-07historical $2,400
-
2024-10-04historical
-
2024-09-17$2,400
-
2024-09-13$360,000 Active
ⓘ Source: listings_history table (triggers on properties + properties_extension) + one-shot
backfill from property_details.listing_events for pre-trigger history.
Tax reassessment forecast TX · Resets to sale price
- Current annual tax
- $9,094 · $758/mo
- Projected year-2 tax
- $9,094 · $758/mo
- Expected delta
- $0/yr ($0/mo · 0.0%)
ⓘ Screening estimate from a state-policy table — verify with the county assessor before closing.
Climate risk First Street
- Flood 1/10 Low FEMA zone X (unshaded) · 0% chance over 30 yrs
- Wildfire 5/10 Major
- Heat 8/10 Severe 7 d/yr ≥110°F today · 25 d/yr by 30 yrs out
- Wind 6/10 Major 27% chance of damaging wind over 30 yrs
- Air quality 2/10 Low 1 unhealthy d/yr today · 1 by 30 yrs out
Nearby sold comps map
Loading sold comps map…
Walkable amenities ~0.75 mi
Loading nearby amenities…
Taxation est. · year 1
- Rental income
- $31,758
- − Mortgage interest
- −$16,749
- − Property taxes
- −$9,094
- − Insurance
- −$1,495
- − Repairs & maintenance
- −$2,541
- − Management
- −$2,541
- − HOA
- −$780
- − Depreciation
- −$8,698
- Taxable loss
- −$10,139
- Est. tax savings @ 24.0%
- +$2,433
- After-tax cash flow
- $-2,662/yr
For passive investors: Depreciation is non-cash, so a rental often shows a tax loss while cash-flowing — sheltering income. Rental losses are passive: they offset passive income freely, and up to $25,000/yr can offset ordinary (W-2) income if you actively participate and your MAGI is under $100k (phasing out to $0 by $150k); unused losses carry forward. On sale, claimed depreciation is recaptured at up to 25%, and gains may owe capital-gains tax (a 1031 exchange can defer both). Figures are a year-1 estimate at your 24.0% rate — not tax advice; consult a CPA.
Condition & rehab AI · 12 photos
This well-maintained single-family home in Forney, TX, offers a good condition with modern amenities and a good curb appeal. It is ready for a fresh coat of paint and some landscaping improvements to further enhance its value.
Value-add opportunities
- Resale Painting interior walls — Fresh paint can enhance curb appeal and interior aesthetics
- Both Landscaping improvements — Enhances curb appeal and can increase property value
- Both Add a smart home system — Improves convenience and can increase property value
Renovation cost estimate screening
Value-add ROI direction
- Resale Painting interior walls — Fresh paint can enhance curb appeal and interior aesthetics ↑
- Both Landscaping improvements — Enhances curb appeal and can increase property value ↑
- Both Add a smart home system — Improves convenience and can increase property value ↑
ⓘ Cost ranges are severity-bucket heuristics (US national rule-of-thumb). Get contractor quotes + a written scope before underwriting a rehab budget.
Schools (NCES district)
- District
- Forney ISD
- NCES district ID
- 4819560
- Math proficiency
- 41% ▼ -20.00%
- Reading proficiency
- 44% ▼ -12.00%
- Median HH income
- $86,679
- Composite
- 40.07/100
- National rank
- #3812
- State rank
- #234 of 826 in TX
Livability — Forney
- Score
- 76/100
- State rank
- #98
- US rank
- #3339
Category grades
Schools grade is shown separately in the Schools card above.
Census & demographics
- County
- Kaufman County · 122,338 people
- City population
- 84,799
- Metro
- Dallas-Fort Worth-Arlington, TX
- Population (ZIP)
- 84,799
- Household income
- $103,673
- Rent vs Own
- Severe rent burden
- 1306.0
Population outlook (Kaufman County) Hauer SSP2
- Today (2025)
- 138,716 people
- By 2030
- 150,815 · +8.7%
- By 2040
- 174,877 · +26.1%
- By 2050
- 198,020 · +42.8%
- By 2075
- 251,908 · +81.6%
- By 2100
- 285,325 · +105.7%
Race, ethnicity, and origin ACS 2023
- Neighborhood character
- Diverse neighborhood (Simpson 0.68)
- Race & ethnicity
- White 45% Black 25% Hispanic / Latino 23% Two or more races 14% Asian 3%
- Hispanic origin (detail)
- Mexican 18% Puerto Rican 1%
- Common ancestry
- Italian 2% Slovak 1% Portuguese 1%
- Foreign-born
- 12% · Canada, Vietnam
- Languages at home
- 79% English-only · Spanish 14% Arabic 1% Vietnamese 1%
Political lean MEDSL · Kaufman
- 2024 margin
- Strong R (+27.9) · D 35.6% · R 63.5%
- 2008→2024 swing
- +7.9pp toward D · 2008: -35.8pp · 2024: -27.9pp
- All cycles
- 2024: R+27.9 2020: R+33.9 2016: R+47.0 2012: R+44.4 2008: R+35.8
Not yet ingested
- Civics
- —
Market trends
- HPI YoY
- ▼ -102.93%
- Current HPI
- 148.5749
- Rent YoY
- ▲ 1.42%
- Metro
- Dallas-Fort Worth-Arlington, TX
- State GDP YoY
- ▲ 3.95%
- F500 in state
- 110
Industry mix (Fortune 500 HQ in TX)
| Industry | F500 HQs | Revenue |
|---|---|---|
| Energy | 16 | $1,198B |
|
||
| Technology | 5 | $198B |
|
||
| Engineering / Construction | 4 | $72B |
|
||
| Energy Services | 3 | $60B |
|
||
| Utilities | 3 | $41B |
|
||
| Healthcare | 2 | $330B |
|
||
Price history
-16.9% since first listed6 events — show timeline
- 2026-06-01 Price Changed $299,000 NTREIS
- 2026-05-02 Listed $319,000 NTREIS
- 2024-11-07 Rental Removed $2,400 NTREIS
- 2024-10-04 Listing Removed — NTREIS
- 2024-09-17 Listed for Rent $2,400 NTREIS
- 2024-09-13 Listed $360,000 NTREIS
Property tax history
+44.3%/yrLatest (2025): $9,094 · -5.8% YoY. Source: county tax records.
Cash-flow waterfall
monthlySold comps — $/sqft
last 12 mo · ≤1 miLoading sold comps…