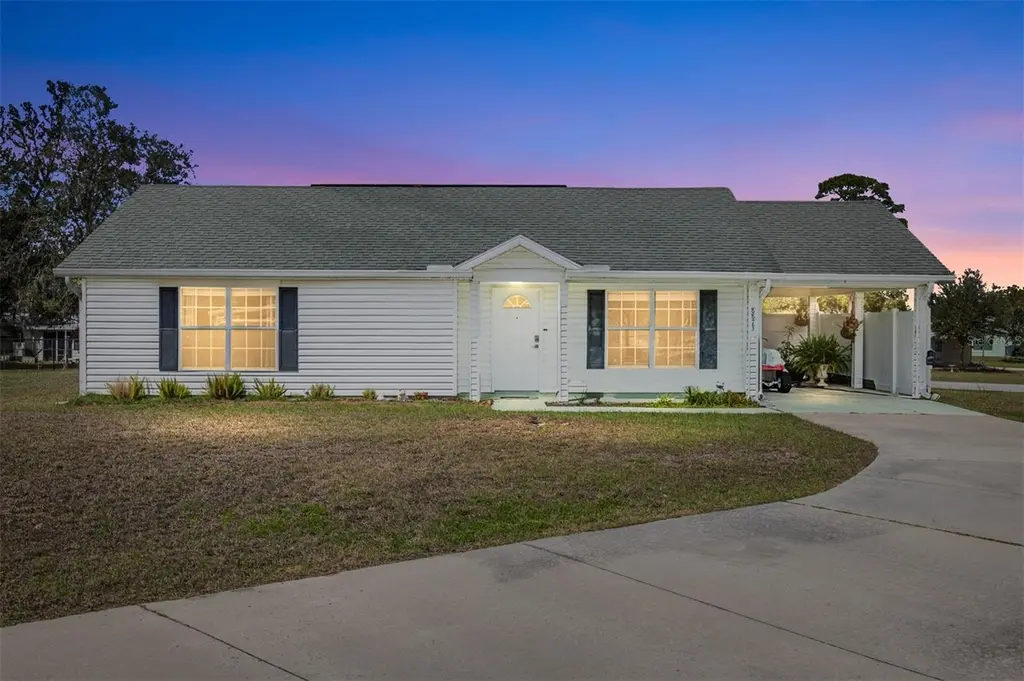
8873 SW 104th Ln · Liberty Triangle, FL
Flood risk 1/10 · Minimal
- FEMA flood zone
- X (unshaded)
- Chance of flooding over 30 yrs
- 0.0%
- Est. flood insurance / yr
- $507 – $1,088
Fire risk 4/10 · Minor
- Est. fire insurance / yr
- $947 – $1,759
Heat risk 8/10 · Major
- Hot days now (above 107°F)
- 7 days/yr
- Hot days in 30 yrs
- 22 days/yr
Wind risk 9/10 · Severe
- Chance of severe wind over 30 yrs
- 99.0%
Air-quality risk 3/10 · Minor
- Unhealthy air days now
- 3 days/yr
- Unhealthy air days in 30 yrs
- 3 days/yr
Risk factors via First Street. Map © Google.
Why this score? — see what drove the D- grade
The composite is a weighted blend of 9 inputs, each scored 0–100. Each bar is that input's sub-score; the figure is the points it added to the 100-point composite (weight × sub-score).
- ARV discount +11.4/15.0
- Cash flow +9.3/30.0
- 1% rule +4.5/10.0
- Schools +3.6/10.0
- DSCR +2.6/10.0
- Rent growth +2.5/5.0
- Livability +2.5/5.0
- Condition / age +2.5/5.0
- Appreciation +0.0/10.0
$159,000
🖨 Deal sheet 📄 Offer letter ✓ Due diligence
Listing remarks MLS
* * NEW ROOF THE END OF APRIL * * This 2 bedroom, 2 bathroom home is ready for its new owners, be that snowbirds or retiring individuals looking for a relaxing lifestyle in this 55+ community. This is one of the newest houses (2008) in the development and right across the street from Clubhouse 1, a pool, shuffle board courts, tennis/ pickleball courts and more. Recent upgrades consist of a new HVAC Unit with HV light installed in 03/2026, hot water heater 03/2022, new stainless steel stove 12/25, new stainless steel refrigerator, newly installed laminate flooring in both bedrooms and hallway, a washer and dryer and septic just pumped. Granite countertops In the kitchen with Oak cabinets. New 6' vinyl fencing around carport. The master bedroom is very ample with a large walk in closet. The owner will also be leaving a newer riding lawn mower to take care of the large lawn area. This residence is located in the perfect spot to get to restaurants, banks, grocery stores, hospitals and other medical facilities. Location, location, location.
Key facts
- Oak cabinets
- New vinyl fencing
- Hot water heater
Tags
Neighborhood map
What this means for you Summary
Snapshot
- This is a 2-bed/2.0-bath single-family listed at $159k.
Deal economics
- At list price, monthly cash flow is $-117 ($-1k/yr) — negative.
- To cash-flow at today's rent, offer at most $138k (13.0% below list).
- To meet the 1% rule (rent ≥ 1% of price), the offer needs to be $151k (4.8% below list).
- Recommended offer: $138k (13.0% below list) — sets the bar for cash-flow.
Location & tenants
- Location reads: area grade D — affects rentability + tenant quality, not the cash-flow math above.
- Marion (rural): math 42% / reading 43% proficiency, ranked #61 of 73 in FL (top 84%) — families likely to look elsewhere, expect single-tenant / working-renter base with shorter leases; 61% free/reduced lunch — lower-income household profile, screen leases tightly.
- Market conditions: 1151 active listings in the ZIP; 26 comparable units currently listed for rent nearby; rentals at typical pace (median 21d on market — plan ~3-4 weeks tenant-placement turnaround); 7,071 units permitted in Marion County in 2024 (534 in 5+ unit buildings).
- This rent runs 32% of the median local income ($57k/yr) — at the standard rent-burdened threshold; future hikes will face affordability resistance.
Forward outlook
- Local home prices are declining (-3.0%/yr); year-one equity from $1k of loan paydown is wiped out by about $5k of value loss. Plan a longer hold.
- Marion County population projected at +13% by 2050 — modest demand growth; plan on rents tracking national, not racing it.
Negotiation context
- It's been on market 86 days — a 6% lower offer ($149k) is reasonable based on typical stale-listing flexibility.
- 8 sale attempts since 19y ago with the ask held roughly flat each time — persistent listings suggest the price (not the market) is what's stuck; bring a comps-based counter.
- Current owner paid $110k; 45% above their basis — modest negotiation headroom, anchor on the comps not their cost.
Risks & watch-outs
- Climate carrying-cost: severe wind risk, 99% chance of damaging wind over 30y; extreme-heat days projected 7→22/yr by 2055 (HVAC capex compounding) — expect insurance premiums to compound above CPI over the hold.
Questions for the listing agent
- What do current leases actually rent for vs. the listed asking? Can we see a recent rent roll and the last 12 months of T-12 income?
- It's been on market 86 days. Have you received any prior offers? Is the seller open to a 13% concession, seller financing, or rate buy-down credit?
- What does the HOA fee cover, when was the last increase, and are there any pending special assessments or reserve-fund shortfalls?
- Why hasn't it sold? Are there any deal-killer items the seller is aware of (foundation, flood, title, zoning, code violations)?
- Is there a deadline driving the sale (1031 exchange, divorce, estate, relocation)? That informs how much negotiation room exists.
- The area grade is low — what's the realistic commute time and amenity access for the typical tenant pool here? Any planned neighborhood developments (good or bad) we should know about?
- What's the average days-on-market for RENTAL listings here right now (not sales)? A rising rental-DOM trend means longer vacancies and softer asking-rent achievability than the comps imply.
- What's the recent tenant-quality profile in this submarket — average credit score on applications, eviction rate, late-payment / NSF rate, and stable-employment percentage? A property-management company in the area should have these aggregated.
- How much new for-sale + rental construction is in the pipeline within 1–3 miles? Heavy new supply typically softens prices + rents 12–24 months out; constrained supply supports both.
Investment metrics
- 1% rule
- 0.95% ✗
- Cap rate
- 5.41%
- Cash-on-cash
- -3.16%
- DSCR
- 0.86
- GRM
- 8.8
CMA / ARV
- ARV (median comp)
- $174,209
- List price
- $159,000
- Delta
- -8.73%
- Verdict
- FAIR
- Comps
- 20 within 1.0 mi
Show comp detail 12 sales within ~0.75 mi
| Address | Dist | Beds/Ba | Sqft | Sold | Price | $/sf | Match |
|---|---|---|---|---|---|---|---|
| 10061 SW 88th Ter | 0.32mi | 2/2.0 | 1,144 (+10%) | 6mo | $135,500 | $118 | 62 |
| 8329 SW 105th Pl | 0.57mi | 2/2.0 | 960 (-7%) | 2mo | $185,000 | $193 | 60 |
| 9200 SW 101st Ln | 0.38mi | 2/2.0 | 1,144 (+10%) | 10mo | $169,900 | $149 | 57 |
| 8473 SW 106th St | 0.45mi | 2/2.0 | 936 (-10%) | 10mo | $133,000 | $142 | 55 |
| 8344 SW 107th Pl | 0.63mi | 2/2.0 | 960 (-7%) | 8mo | $143,200 | $149 | 52 |
| 10060 SW 93rd Ave | 0.55mi | 2/1.5 | 1,095 (+6%) | 15mo | $130,000 | $119 | 51 |
| 8244 SW 106th Pl | 0.70mi | 2/2.0 | 990 (-4%) | 12mo | $183,000 | $185 | 50 |
| 8343 SW 105th Pl | 0.55mi | 2/2.0 | 936 (-10%) | 11mo | $150,000 | $160 | 49 |
| 8357 SW 106th St | 0.55mi | 2/2.0 | 1,116 (+8%) | 17mo | $195,000 | $175 | 47 |
| 10815 SW 86th Ave | 0.63mi | 2/2.0 | 1,178 (+14%) | 6mo | $243,000 | $206 | 42 |
| 8245 SW 106th St | 0.67mi | 2/2.0 | 1,122 (+8%) | 18mo | $170,000 | $152 | 39 |
| 10892 SW 88th Ct | 0.75mi | 2/2.0 | 1,086 (+5%) | 22mo | $170,000 | $157 | 38 |
Match score weights: distance 35% · size 25% · config 20% · recency 20%. Top-matched comps best support the ARV.
Projected returns pro-forma
-3.0% appreciation · 3.0% rent growth · sell at horizon
- IRR
- -21.5%
- Equity multiple
- 0.26×
- Total profit
- $-33,088
- Equity at exit
- $23,707
- IRR
- -14.8%
- Equity multiple
- 0.15×
- Total profit
- $-37,812
- Equity at exit
- $13,747
Cash invested: $44,520 (down + closing). Projections, not guarantees.
Landlord ↔ Tenant lean methodology
- Overall (STATE)
- 87 Strongly Landlord-Friendly
- State Florida
- 87 Strongly Landlord-Friendly · R+3
- County
- — inherits STATE
- City
- — inherits STATE
ZIP-level market 34481
- Home prices YoY
- -25.2%
- Active inventory
- 1151
- Price-to-rent
- 8.8×
Monthly cashflow live
- Estimated rent
- $1,514 high interval (Pro) →
- Mortgage (P&I)
- −$834
- Tax from tax record
- −$266 /mo · $3,195/yr
- Insurance
- −$66
- HOA
- −$147
- Vacancy / Maint / Mgmt
- −$318
- Net cashflow
- $-117
Break-even live
UW: 25.0% down · 7.5% · 30yr · 1.5% tax · 5.0% vac · 8.0% maint · 8.0% mgmt
Financing live
Cash to close
- Down payment
- $39,750
- Closing costs
- $4,770
- Reserves months
- —
- Total cash needed
- —
Loan-product check · same deal, 3 products live
Conventional
25% down · 7.5% · 30yr
- Down + closing
- —
- Monthly P&I
- —
- Monthly cashflow
- —
- DSCR
- —
- Eligible?
- —
Personal DTI + credit; lowest rate.
DSCR
20% down · 8.5% · 30yr
- Down + closing
- —
- Monthly P&I
- —
- Monthly cashflow
- —
- DSCR
- —
- Eligible?
- —
No personal income docs; deal must DSCR.
Hard money
10% down · 12.0% · 12mo
- Down + closing
- —
- Monthly P&I
- —
- Monthly cashflow
- —
- DSCR
- —
- Eligible?
- —
Short-term bridge; refi at stabilization.
Rent comps 26 comps
| Address | Beds | Baths | Sqft | Rent | $/sqft | DOM | Units | Dist |
|---|---|---|---|---|---|---|---|---|
| 8935 SW 102nd Pl Ocala, FL | 2.0 | 2.0 | 1144 | $1,500 | $1.31 | 21d | 1 | 0.17mi |
| 9075 SW 102nd Pl Ocala, FL | 2.0 | 2.0 | 1008 | $1,275 | $1.26 | 21d | 1 | 0.25mi |
| 10441 SW 85th Ct Ocala, FL | 2.0 | 2.0 | 1090 | $1,495 | $1.37 | 21d | 1 | 0.29mi |
| 8757 SW 97th Lane Rd Unit C Ocala, FL | 2.0 | 2.0 | 1490 | $1,600 | $1.07 | 13d | 1 | 0.44mi |
| 10211 SW 93rd Ct Ocala, FL | 3.0 | 2.0 | 1456 | $1,495 | $1.03 | 21d | 1 | 0.47mi |
| 8947 SW 108th Pl Ocala, FL | 2.0 | 2.0 | 1096 | $1,500 | $1.37 | 21d | 1 | 0.64mi |
| 8655 SW 98th Street Rd Unit G Ocala, FL | 2.0 | 2.0 | 1424 | $1,500 | $1.05 | 21d | 1 | 0.66mi |
| 10081 SW 95th Ave Ocala, FL | 2.0 | 2.0 | 1040 | $1,395 | $1.34 | 21d | 1 | 0.66mi |
| 9201 SW 108th Pl Ocala, FL | 2.0 | 2.0 | 1170 | $1,475 | $1.26 | 21d | 15 | 0.69mi |
| 8670 SW 97th St Unit A Ocala, FL | 2.0 | 2.0 | 1341 | $1,600 | $1.19 | 21d | 1 | 0.69mi |
| 8671 SW 97th St Unit C Ocala, FL | 2.0 | 2.0 | 1341 | $1,474 | $1.10 | 13d | 1 | 0.72mi |
| 8669 SW 108th Ln Ocala, FL | 2.0 | 1.0 | 1152 | $1,250 | $1.09 | 21d | 1 | 0.74mi |
| 8942 SW 109th Ln Ocala, FL | 2.0 | 2.0 | 960 | $1,450 | $1.51 | 21d | 1 | 0.83mi |
| 10081 SW 97th Ct Ocala, FL | 2.0 | 1.0 | 992 | $1,200 | $1.21 | 13d | 1 | 0.90mi |
| 8680 SW 94th Ln Unit G Ocala, FL | 3.0 | 2.0 | 1409 | $1,550 | $1.10 | 21d | 1 | 0.90mi |
| 9760 SW 101st Ln Ocala, FL | 2.0 | 2.0 | 1360 | $1,500 | $1.10 | 21d | 1 | 0.90mi |
| 10405 SW 99th Ave Ocala, FL | 2.0 | 2.0 | 1040 | $1,450 | $1.39 | 21d | 1 | 0.98mi |
| 8130 SW 108th Street Rd Ocala, FL | 2.0 | 2.0 | 1084 | $1,975 | $1.82 | 21d | 1 | 1.00mi |
| 9748 SW 97th St Ocala, FL | 2.0 | 2.0 | 1105 | $1,500 | $1.36 | 21d | 1 | 1.07mi |
| 9758 SW 96th St Ocala, FL | 2.0 | 2.0 | 1219 | $1,400 | $1.15 | 21d | 1 | 1.10mi |
| 10155 SW 100th Ave Ocala, FL | 2.0 | 2.0 | 1040 | $1,700 | $1.63 | 21d | 1 | 1.12mi |
| 9794 SW 96th St Ocala, FL | 2.0 | 2.0 | 1201 | $1,700 | $1.42 | 21d | 1 | 1.13mi |
| 9013 SW 91st Cir Ocala, FL | 2.0 | 2.0 | 1494 | $1,900 | $1.27 | 13d | 1 | 1.27mi |
| 8430 SW 90th Ln Unit D Ocala, FL | 2.0 | 2.0 | 1454 | $1,600 | $1.10 | 21d | 1 | 1.37mi |
| 8287 SW 116th St Ocala, FL | 2.0 | 2.0 | 1181 | $1,550 | $1.31 | 21d | 1 | 1.37mi |
| 8431 SW 90th Ln Ocala, FL | 2.0 | 2.0 | 1366 | $1,395 | $1.02 | 21d | 1 | 1.40mi |
HOA detail
- Monthly dues
- $147 · $1,764/yr
- Likely covers
- waterpool
Listing history 26 events
-
2026-06-03statusdays on market $159,000 Pending 86 DOM
-
2026-06-02days on market $159,000 Active 85 DOM
-
2026-06-01days on market $159,000 Active 84 DOM
-
2026-05-31days on market $159,000 Active 83 DOM
-
2026-05-30days on market $159,000 Active 82 DOM
-
2026-05-12price $159,000 1053-char remark
Show marketing remark (1053 chars)
* * NEW ROOF THE END OF APRIL * * This 2 bedroom, 2 bathroom home is ready for its new owners, be that snowbirds or retiring individuals looking for a relaxing lifestyle in this 55+ community. This is one of the newest houses (2008) in the development and right across the street from Clubhouse 1, a pool, shuffle board courts, tennis/ pickleball courts and more. Recent upgrades consist of a new HVAC Unit with HV light installed in 03/2026, hot water heater 03/2022, new stainless steel stove 12/25, new stainless steel refrigerator, newly installed laminate flooring in both bedrooms and hallway, a washer and dryer and septic just pumped. Granite countertops In the kitchen with Oak cabinets. New 6' vinyl fencing around carport. The master bedroom is very ample with a large walk in closet. The owner will also be leaving a newer riding lawn mower to take care of the large lawn area. This residence is located in the perfect spot to get to restaurants, banks, grocery stores, hospitals and other medical facilities. Location, location, location.
-
2026-03-09$161,000 Active 1053-char remark
Show marketing remark (1053 chars)
* * NEW ROOF THE END OF APRIL * * This 2 bedroom, 2 bathroom home is ready for its new owners, be that snowbirds or retiring individuals looking for a relaxing lifestyle in this 55+ community. This is one of the newest houses (2008) in the development and right across the street from Clubhouse 1, a pool, shuffle board courts, tennis/ pickleball courts and more. Recent upgrades consist of a new HVAC Unit with HV light installed in 03/2026, hot water heater 03/2022, new stainless steel stove 12/25, new stainless steel refrigerator, newly installed laminate flooring in both bedrooms and hallway, a washer and dryer and septic just pumped. Granite countertops In the kitchen with Oak cabinets. New 6' vinyl fencing around carport. The master bedroom is very ample with a large walk in closet. The owner will also be leaving a newer riding lawn mower to take care of the large lawn area. This residence is located in the perfect spot to get to restaurants, banks, grocery stores, hospitals and other medical facilities. Location, location, location.
-
2021-05-05soldstatus $110,000
-
2021-04-30historical 262-char remark
Show marketing remark (262 chars)
THIS COZY AFFORDABLE HOME COMES WITH MANY FEATURES & UPGRADES. HARDWOOD FLOORS, GRANITE COUNTERS & WOOD CABINETS IN KITCHEN, INSIDE LAUNDRY, LARGE BEDROOMS, COVERED LANAI & MUCH MORE. ON A NICE CORNER LOT. COMMUNITY HAS 2 CLUBHOUSES WITH A POOL
-
2021-04-29soldstatus $110,000 Closed
-
2021-03-23status Pending
-
2021-01-18$115,000 Active
-
2018-10-01historical
-
2018-08-18$115,000
-
2009-04-30$95,000 262-char remark
Show marketing remark (262 chars)
THIS COZY AFFORDABLE HOME COMES WITH MANY FEATURES & UPGRADES. HARDWOOD FLOORS, GRANITE COUNTERS & WOOD CABINETS IN KITCHEN, INSIDE LAUNDRY, LARGE BEDROOMS, COVERED LANAI & MUCH MORE. ON A NICE CORNER LOT. COMMUNITY HAS 2 CLUBHOUSES WITH A POOL
-
2009-02-27historical
-
2008-09-02$94,900
-
2008-08-27historical
-
2008-04-27$99,900
-
2008-04-19historical
-
2008-04-19historical
-
2008-02-13$109,900
-
2007-04-19$128,900
-
2006-05-30soldstatus $18,000
-
2002-11-01soldstatus $825,000
-
1985-12-01soldstatus $36,267
ⓘ Source: listings_history table (triggers on properties + properties_extension) + one-shot
backfill from property_details.listing_events for pre-trigger history.
Tax reassessment forecast FL · Resets to sale price
- Current annual tax
- $3,195 · $266/mo
- Projected year-2 tax
- $3,195 · $266/mo
- Expected delta
- $0/yr ($0/mo · 0.0%)
ⓘ Screening estimate from a state-policy table — verify with the county assessor before closing.
Climate risk First Street
- Flood 1/10 Low FEMA zone X (unshaded) · 0% chance over 30 yrs
- Wildfire 4/10 Moderate
- Heat 8/10 Severe 7 d/yr ≥107°F today · 22 d/yr by 30 yrs out
- Wind 9/10 Extreme 99% chance of damaging wind over 30 yrs
- Air quality 3/10 Moderate 3 unhealthy d/yr today · 3 by 30 yrs out
Nearby sold comps map
Loading sold comps map…
Walkable amenities ~0.75 mi
Loading nearby amenities…
Taxation est. · year 1
- Rental income
- $18,165
- − Mortgage interest
- −$8,906
- − Property taxes
- −$3,195
- − Insurance
- −$795
- − Repairs & maintenance
- −$1,453
- − Management
- −$1,453
- − HOA
- −$1,764
- − Depreciation
- −$4,625
- Taxable loss
- −$4,027
- Est. tax savings @ 24.0%
- +$966
- After-tax cash flow
- $-442/yr
For passive investors: Depreciation is non-cash, so a rental often shows a tax loss while cash-flowing — sheltering income. Rental losses are passive: they offset passive income freely, and up to $25,000/yr can offset ordinary (W-2) income if you actively participate and your MAGI is under $100k (phasing out to $0 by $150k); unused losses carry forward. On sale, claimed depreciation is recaptured at up to 25%, and gains may owe capital-gains tax (a 1031 exchange can defer both). Figures are a year-1 estimate at your 24.0% rate — not tax advice; consult a CPA.
Schools (NCES district)
- District
- Marion
- NCES district ID
- 1201260
- Math proficiency
- 42% ▼ -7.00%
- Reading proficiency
- 43% ▼ -4.00%
- Median HH income
- $40,015
- Composite
- 35.61/100
- National rank
- #4890
- State rank
- #61 of 73 in FL
Livability — Liberty Triangle
No livability data for this city. (Only ~50 U.S. cities are tracked.)
Census & demographics
- County
- Marion County · 315,796 people
- City population
- 26,397
- Metro
- Ocala, FL
- Population (ZIP)
- 26,782
- Household income
- $57,324
- Rent vs Own
- Severe rent burden
- 313.0
Population outlook (Marion County) Hauer SSP2
- Today (2025)
- 365,905 people
- By 2030
- 376,768 · +3.0%
- By 2040
- 396,555 · +8.4%
- By 2050
- 412,723 · +12.8%
- By 2075
- 446,090 · +21.9%
- By 2100
- 436,193 · +19.2%
Race, ethnicity, and origin ACS 2023
- Neighborhood character
- Predominantly White (80%)
- Race & ethnicity
- White 80% Hispanic / Latino 11% Black 7% Two or more races 5%
- Hispanic origin (detail)
- Mexican 4% Puerto Rican 4% Cuban 1%
- Common ancestry
- Romanian 7% Lithuanian 3% Slovak 2%
- Foreign-born
- 8% · Canada, Jamaica
- Languages at home
- 88% English-only · Spanish 9% French/Haitian/Cajun 1% German/W. Germanic 1%
Political lean MEDSL · Marion
- 2024 margin
- Solid R (+31.6) · D 33.8% · R 65.5%
- 2008→2024 swing
- -20.0pp toward R · 2008: -11.6pp · 2024: -31.6pp
- All cycles
- 2024: R+31.6 2020: R+25.9 2016: R+26.2 2012: R+16.2 2008: R+11.6
Not yet ingested
- Civics
- —
Market trends
- HPI YoY
- ▼ -67.48%
- Current HPI
- 199.986
- Rent YoY
- —
- Metro
- Ocala, FL
- State GDP YoY
- ▲ 3.28%
- F500 in state
- 36
Industry mix (Fortune 500 HQ in FL)
| Industry | F500 HQs | Revenue |
|---|---|---|
| Industrial Technology | 2 | $29B |
|
||
| Insurance | 2 | $17B |
|
||
| Retail | 1 | $60B |
|
||
| Technology Distribution | 1 | $58B |
|
||
| Homebuilding | 1 | $35B |
|
||
| Technology Manufacturing | 1 | $35B |
|
||
Price history
+338.4% since first listed21 events — show timeline
- 2026-05-12 Price Changed $159,000 Stellar MLS as Distributed by MLS Grid
- 2026-03-09 Listed $161,000 Stellar MLS as Distributed by MLS Grid
- 2021-05-05 Sold (Public Records) $110,000 Public Records
- 2021-04-30 Listing Removed — Stellar MLS as Distributed by MLS Grid
- 2021-04-29 Sold (MLS) $110,000 Stellar MLS as Distributed by MLS Grid
- 2021-03-23 Pending — Stellar MLS as Distributed by MLS Grid
- 2021-01-18 Listed $115,000 Stellar MLS as Distributed by MLS Grid
- 2018-10-01 Listing Removed — Stellar MLS as Distributed by MLS Grid
- 2018-08-18 Listed $115,000 Stellar MLS as Distributed by MLS Grid
- 2009-04-30 Listed $95,000 Stellar MLS as Distributed by MLS Grid
- 2009-02-27 Listing Removed — Stellar MLS as Distributed by MLS Grid
- 2008-09-02 Listed $94,900 Stellar MLS as Distributed by MLS Grid
- 2008-08-27 Listing Removed — Stellar MLS as Distributed by MLS Grid
- 2008-04-27 Listed $99,900 Stellar MLS as Distributed by MLS Grid
- 2008-04-19 Listing Removed — Stellar MLS as Distributed by MLS Grid
- 2008-04-19 Listing Removed — Stellar MLS as Distributed by MLS Grid
- 2008-02-13 Listed $109,900 Stellar MLS as Distributed by MLS Grid
- 2007-04-19 Listed $128,900 Stellar MLS as Distributed by MLS Grid
- 2006-05-30 Sold (Public Records) $18,000 Public Records
- 2002-11-01 Sold (Public Records) $825,000 Public Records
- 1985-12-01 Sold (Public Records) $36,267 Public Records
Property tax history
+10.0%/yrLatest (2025): $3,195 · +6.4% YoY. Source: county tax records.
Cash-flow waterfall
monthlySold comps — $/sqft
last 12 mo · ≤1 miLoading sold comps…