 🏗️ New Construction
40 Fm 144 S · Daingerfield, TX
Flood risk 1/10 · Minimal
- FEMA flood zone
- —
- Chance of flooding over 30 yrs
- 0.0%
- Est. flood insurance / yr
- —
Fire risk 6/10 · Moderate
- Est. fire insurance / yr
- $1,222 – $2,270
Heat risk 7/10 · Major
- Hot days now (above 112°F)
- 7 days/yr
- Hot days in 30 yrs
- 21 days/yr
Wind risk 6/10 · Moderate
- Chance of severe wind over 30 yrs
- 27.0%
Air-quality risk 2/10 · Minimal
- Unhealthy air days now
- 1 days/yr
- Unhealthy air days in 30 yrs
- 1 days/yr
Risk factors via First Street. Map © Google.
Why this score? — see what drove the D- grade
The composite is a weighted blend of 9 inputs, each scored 0–100. Each bar is that input's sub-score; the figure is the points it added to the 100-point composite (weight × sub-score).
- Cash flow +8.5/30.0
- ARV discount +7.5/15.0
- Appreciation +6.6/10.0
- Livability +3.4/5.0
- 1% rule +2.6/10.0
- Rent growth +2.5/5.0
- Condition / age +2.5/5.0
- DSCR +2.3/10.0
- Schools +2.3/10.0
$174,999
🖨 Deal sheet 📄 Offer letter ✓ Due diligence
Listing remarks
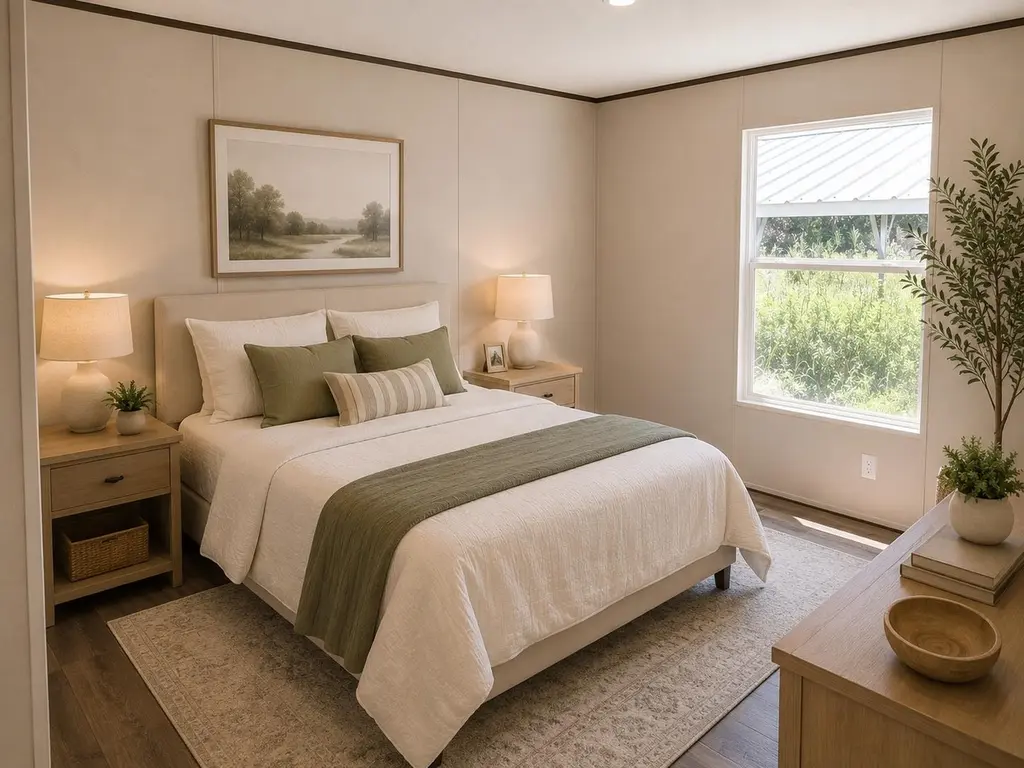
Welcome to country living in the heart of East Texas! This brand-new 4-bedroom, 2-bathroom manufactured home offers just under 1,500 square feet of comfortable living space and sits on nearly ¾ of an acre in Daingerfield, Texas. Designed with modern living in mind, the home features a spacious open-concept floor plan, a large kitchen island perfect for meal prep and entertaining, and a desirable split-bedroom layout that provides added privacy for the primary suite. With all the benefits of new construction, this move-in-ready home is waiting for its first owners. The thoughtfully designed floor plan offers plenty of room for family gatherings, entertaining guests, or simply enjoying
Key facts
- Large kitchen island
- Split-bedroom layout
- Move-in-ready home
Tags
Property features AI
Exterior
- Parking: Detached parking
- Home design: Manufactured home; Residential property; New construction
- Construction: Composition roof
- Exterior features: Corner lot
Interior
- Kitchen: Dishwasher; Refrigerator
- Flooring: Vinyl flooring
- Bathrooms: 2 full bathrooms
- Heating & cooling: Central heating (electric); Central air; Ceiling fans
- Interior features: Breakfast bar; 10 total rooms
- Laundry & utility: Electric water heater
Neighborhood map
What this means for you Summary
Snapshot
- This is a 4-bed/2.0-bath manufactured listed at $175k.
Deal economics
- At list price, monthly cash flow is $-152 ($-2k/yr) — negative.
- To cash-flow at today's rent, offer at most $153k (12.6% below list).
- To meet the 1% rule (rent ≥ 1% of price), the offer needs to be $134k (23.5% below list).
- Recommended offer: $134k (23.5% below list) — sets the bar for 1% rule.
- Cap rate 5.2% vs local median 3.5% in Daingerfield — top-decile yield for the area; either an underpriced asset or a hidden risk that comps aren't pricing in. Stress-test before assuming the spread holds.
Location & tenants
- Location reads 67/100 on livability (#536 in TX) — a middle-class / working-renter tenant base. Strengths: cost of living A+, housing A+, health & safety A+; Watch: schools F, crime F, amenities F.
- Daingerfield-Lone Star ISD (town): math 24% / reading 32% proficiency, ranked #679 of 826 in TX (top 82%) — low school quality limits family demand, transient renter base, plan for 1-2y turnover; 71% free/reduced lunch — lower-income household profile, screen leases tightly.
- Market conditions: 82 active listings in the ZIP; 3 units permitted in Morris County in 2024 (0 in 5+ unit buildings).
Forward outlook
- In year one you build about $7k of equity ($1k loan paydown + $5k appreciation (3.1% local appreciation)).
- Morris County population projected at -19% by 2050 — secular population decline; favor cash flow + early exit over multi-decade hold.
- By year 6, paydown + projected appreciation supports a ~$35k cash-out refi (75% LTV) — recoverable capital for the next deal without selling this one.
Negotiation context
- It's been on market 20 days — a 2% lower offer ($172k) is reasonable based on typical stale-listing flexibility.
Risks & watch-outs
- Climate carrying-cost: major wind risk, 27% chance of damaging wind over 30y; major wildfire risk; extreme-heat days projected 7→21/yr by 2055 (HVAC capex compounding) — expect insurance premiums to compound above CPI over the hold.
Questions for the listing agent
- What do current leases actually rent for vs. the listed asking? Can we see a recent rent roll and the last 12 months of T-12 income?
- Is there a deadline driving the sale (1031 exchange, divorce, estate, relocation)? That informs how much negotiation room exists.
- Schools are F-rated, which usually means shorter tenancies and higher turnover. Who's the typical renter profile here, and what's been the actual vacancy rate?
- Crime grade is F in this area — have there been break-ins, vandalism, or insurance claims at this property in the last 3 years? What carrier currently insures it and at what premium?
- The area grade is low — what's the realistic commute time and amenity access for the typical tenant pool here? Any planned neighborhood developments (good or bad) we should know about?
- What's the average days-on-market for RENTAL listings here right now (not sales)? A rising rental-DOM trend means longer vacancies and softer asking-rent achievability than the comps imply.
- What's the recent tenant-quality profile in this submarket — average credit score on applications, eviction rate, late-payment / NSF rate, and stable-employment percentage? A property-management company in the area should have these aggregated.
- How much new for-sale + rental construction is in the pipeline within 1–3 miles? Heavy new supply typically softens prices + rents 12–24 months out; constrained supply supports both.
Investment metrics
- 1% rule
- 0.76% ✗
- Cap rate
- 5.25%
- Cash-on-cash
- -3.73%
- DSCR
- 0.83
- GRM
- 10.9
CMA / ARV
No comps found within radius.
Projected returns pro-forma
3.11% appreciation · 3.0% rent growth · sell at horizon
- IRR
- 4.4%
- Equity multiple
- 1.25×
- Total profit
- $12,408
- Equity at exit
- $79,768
- IRR
- 7.5%
- Equity multiple
- 2.15×
- Total profit
- $56,579
- Equity at exit
- $123,779
Cash invested: $49,000 (down + closing). Projections, not guarantees.
Landlord ↔ Tenant lean methodology
- Overall (STATE)
- 87 Strongly Landlord-Friendly
- State Texas
- 87 Strongly Landlord-Friendly · R+5
- County
- — inherits STATE
- City
- — inherits STATE
ZIP-level market 75638
- Home prices YoY
- 1.7%
- Active inventory
- 82
- Price-to-rent
- 10.9×
Monthly cashflow live
- Estimated rent
- $1,338 medium interval (Pro) →
- Mortgage (P&I)
- −$918
- Tax est. 1.5%
- −$219 /mo · $2,625/yr
- Insurance
- −$73
- HOA
- −$0
- Vacancy / Maint / Mgmt
- −$281
- Net cashflow
- $-152
Break-even live
UW: 25.0% down · 7.5% · 30yr · 1.5% tax · 5.0% vac · 8.0% maint · 8.0% mgmt
Financing live
Cash to close
- Down payment
- $43,750
- Closing costs
- $5,250
- Reserves months
- —
- Total cash needed
- —
Loan-product check · same deal, 3 products live
Conventional
25% down · 7.5% · 30yr
- Down + closing
- —
- Monthly P&I
- —
- Monthly cashflow
- —
- DSCR
- —
- Eligible?
- —
Personal DTI + credit; lowest rate.
DSCR
20% down · 8.5% · 30yr
- Down + closing
- —
- Monthly P&I
- —
- Monthly cashflow
- —
- DSCR
- —
- Eligible?
- —
No personal income docs; deal must DSCR.
Hard money
10% down · 12.0% · 12mo
- Down + closing
- —
- Monthly P&I
- —
- Monthly cashflow
- —
- DSCR
- —
- Eligible?
- —
Short-term bridge; refi at stabilization.
Listing history 15 events
-
2026-06-19days on market $174,999 Active 20 DOM
-
2026-06-18days on market $174,999 Active 19 DOM
-
2026-06-17days on market $174,999 Active 18 DOM
-
2026-06-16days on market $174,999 Active 17 DOM
-
2026-06-15days on market $174,999 Active 16 DOM
-
2026-06-14days on market $174,999 Active 14 DOM
-
2026-06-12days on market $174,999 Active 13 DOM
-
2026-06-09days on market $174,999 Active 10 DOM
-
2026-06-08days on market $174,999 Active 9 DOM
-
2026-06-07days on market $174,999 Active 8 DOM
-
2026-06-07days on market $174,999 Active 7 DOM
-
2026-06-02days on market $174,999 Active 3 DOM
-
2026-06-01days on market $174,999 Active 2 DOM
-
2026-05-31remarks 692-char remark
-
2026-05-31$174,999 Active 1 DOM
ⓘ Source: listings_history table (triggers on properties + properties_extension) + one-shot
backfill from property_details.listing_events for pre-trigger history.
Climate risk First Street
- Flood 1/10 Low 0% chance over 30 yrs
- Wildfire 6/10 Major
- Heat 7/10 Severe 7 d/yr ≥112°F today · 21 d/yr by 30 yrs out
- Wind 6/10 Major 27% chance of damaging wind over 30 yrs
- Air quality 2/10 Low 1 unhealthy d/yr today · 1 by 30 yrs out
Nearby sold comps map
Loading sold comps map…
Walkable amenities ~0.75 mi
Loading nearby amenities…
Taxation est. · year 1
- Rental income
- $16,055
- − Mortgage interest
- −$9,803
- − Property taxes
- −$2,625
- − Insurance
- −$875
- − Repairs & maintenance
- −$1,284
- − Management
- −$1,284
- − Depreciation
- −$5,091
- Taxable loss
- −$4,907
- Est. tax savings @ 24.0%
- +$1,178
- After-tax cash flow
- $-651/yr
For passive investors: Depreciation is non-cash, so a rental often shows a tax loss while cash-flowing — sheltering income. Rental losses are passive: they offset passive income freely, and up to $25,000/yr can offset ordinary (W-2) income if you actively participate and your MAGI is under $100k (phasing out to $0 by $150k); unused losses carry forward. On sale, claimed depreciation is recaptured at up to 25%, and gains may owe capital-gains tax (a 1031 exchange can defer both). Figures are a year-1 estimate at your 24.0% rate — not tax advice; consult a CPA.
Schools (NCES district)
- District
- Daingerfield-Lone Star ISD
- NCES district ID
- 4816180
- Math proficiency
- 24% ▼ -11.00%
- Reading proficiency
- 32% ▼ -4.00%
- Median HH income
- $39,097
- Composite
- 23.48/100
- National rank
- #7877
- State rank
- #679 of 826 in TX
Livability — Daingerfield
- Score
- 67/100
- State rank
- #536
- US rank
- #10463
Category grades
Schools grade is shown separately in the Schools card above.
Census & demographics
- Population (ZIP)
- 5,363
Population outlook (Morris County) Hauer SSP2
- Today (2025)
- 11,628 people
- By 2030
- 11,126 · -4.3%
- By 2040
- 10,181 · -12.4%
- By 2050
- 9,408 · -19.1%
- By 2075
- 8,268 · -28.9%
- By 2100
- 7,463 · -35.8%
Race, ethnicity, and origin ACS 2023
- Neighborhood character
- Diverse neighborhood (Simpson 0.60)
- Race & ethnicity
- White 59% Black 20% Hispanic / Latino 13% Two or more races 11% Asian 2%
- Hispanic origin (detail)
- Mexican 12%
- Common ancestry
- Scottish 4% Italian 2% Lithuanian 1%
- Foreign-born
- 6% · Canada, Vietnam
- Languages at home
- 87% English-only · Spanish 10% Vietnamese 1% Russian/Polish/Slavic 1%
Political lean MEDSL · Morris
- 2024 margin
- Solid R (+51.2) · D 24.1% · R 75.3%
- 2008→2024 swing
- -30.2pp toward R · 2008: -21.0pp · 2024: -51.2pp
- All cycles
- 2024: R+51.2 2020: R+39.4 2016: R+40.6 2012: R+26.7 2008: R+21.0
Not yet ingested
- Civics
- —
Market trends
- HPI YoY
- ▲ 3.11%
- Current HPI
- 186.7313
- Rent YoY
- —
- Metro
- —
- State GDP YoY
- ▲ 3.95%
- F500 in state
- 110
Industry mix (Fortune 500 HQ in TX)
| Industry | F500 HQs | Revenue |
|---|---|---|
| Energy | 16 | $1,198B |
|
||
| Technology | 5 | $198B |
|
||
| Engineering / Construction | 4 | $72B |
|
||
| Energy Services | 3 | $60B |
|
||
| Utilities | 3 | $41B |
|
||
| Healthcare | 2 | $330B |
|
||
Price history
1 event — show timeline
- 2026-05-30 Listed $174,999 LAAR
Cash-flow waterfall
monthlySold comps — $/sqft
last 12 mo · ≤1 miLoading sold comps…