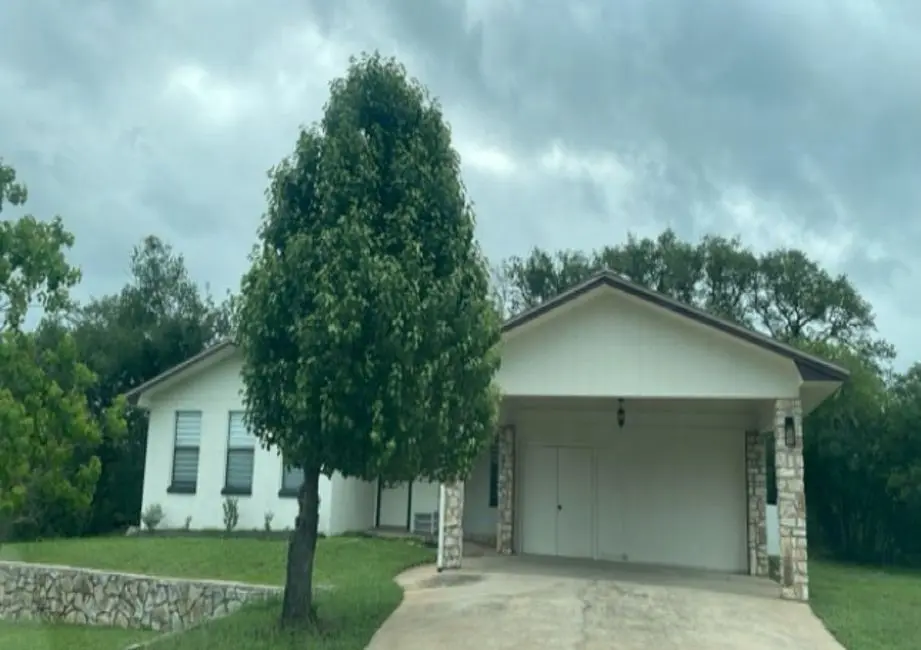
1103 Ute Rd · Horseshoe Bay, TX
Flood risk 1/10 · Minimal
- FEMA flood zone
- X (unshaded)
- Chance of flooding over 30 yrs
- 0.0%
- Est. flood insurance / yr
- $507 – $1,088
Fire risk 5/10 · Moderate
- Est. fire insurance / yr
- $1,222 – $2,270
Heat risk 8/10 · Major
- Hot days now (above 106°F)
- 6 days/yr
- Hot days in 30 yrs
- 20 days/yr
Wind risk 6/10 · Moderate
- Chance of severe wind over 30 yrs
- 55.0%
Air-quality risk 1/10 · Minimal
- Unhealthy air days now
- 0 days/yr
- Unhealthy air days in 30 yrs
- 0 days/yr
Risk factors via First Street. Map © Google.
Why this score? — see what drove the B- grade
The composite is a weighted blend of 9 inputs, each scored 0–100. Each bar is that input's sub-score; the figure is the points it added to the 100-point composite (weight × sub-score).
- Cash flow +26.0/30.0
- DSCR +8.7/10.0
- 1% rule +8.1/10.0
- ARV discount +7.5/15.0
- Appreciation +5.5/10.0
- Schools +3.5/10.0
- Livability +3.3/5.0
- Rent growth +2.5/5.0
- Condition / age +2.5/5.0
$168,740
🖨 Deal sheet 📄 Offer letter ✓ Due diligence
Listing remarks
3 Bedrooms 2 bathrooms home
Key facts
- 0.23 acre lot
- 2 garage spots
- Built 1977
Property features AI
Exterior
- Parking: Attached 2-car garage
- Utilities: Public water
- Home design: Residential property; Built in 1977; Slab foundation
- Construction: Composition roof; Construction materials: Unknown
- Exterior features: Subdivision lot
Interior
- Bedrooms: Primary bedroom on the first floor (12x12); Bedroom on the first floor (11x13); Bedroom on the first floor (10x13); Three total rooms
- Bathrooms: 2 full bathrooms
- Heating & cooling: Central heating (electric); Central air conditioning (electric)
- Interior features: Fireplace (1)
Neighborhood map
What this means for you Summary
Snapshot
- This is a 3-bed/2.0-bath single-family listed at $169k.
Deal economics
- At list price, monthly cash flow is $418 ($5k/yr) — positive.
- The deal already cash-flows at list — no discount required.
- Meets the 1% rule at list price ($2k rent vs $169k).
- Recommended offer: $166k (1.5% below list) — sets the bar for market timing.
- Cap rate 9.3% vs local median 1.0% in Horseshoe Bay — top-decile yield for the area; either an underpriced asset or a hidden risk that comps aren't pricing in. Stress-test before assuming the spread holds.
Location & tenants
- Location reads 66/100 on livability (#625 in TX) — a middle-class / working-renter tenant base. Strengths: crime A+, employment A-, housing A-; Watch: amenities F, commute F.
- Llano ISD (town): math 40% / reading 43% proficiency, ranked #359 of 826 in TX (top 44%) — families likely to look elsewhere, expect single-tenant / working-renter base with shorter leases.
- Zoned schools: Llano El (math 52% / reading 52%, grade C-, #742 of 4,322 statewide, top 19%, 366 students, 62% FRL); Llano H S (math 42% / reading 52%, grade D-, #591 of 1,632 statewide, top 38%, 552 students, 60% FRL).
- Market conditions: 1223 active listings in the ZIP; 25 comparable units currently listed for rent nearby; rentals at typical pace (median 23d on market — plan ~3-4 weeks tenant-placement turnaround); 48% of comp listings sitting > 30 days — soft ceiling on asking rent; solid renter incomes; 121 units permitted in Llano County in 2024 (0 in 5+ unit buildings).
Forward outlook
- In year one you build about $3k of equity ($1k loan paydown + $2k appreciation (0.9% local appreciation)).
- Llano County population projected at +11% by 2050 — modest demand growth; plan on rents tracking national, not racing it.
- At projected returns (0.9% appreciation + 3.0% rent growth), your $47k cash investment doubles in ~6 years — after that, you're playing with house money.
Negotiation context
- It's been on market 29 days — a 2% lower offer ($166k) is reasonable based on typical stale-listing flexibility.
- 9 sale attempts since 14y ago with the ask held roughly flat each time — persistent listings suggest the price (not the market) is what's stuck; bring a comps-based counter.
Risks & watch-outs
- Watch-outs: property tax is 2.6% of price.
- Climate carrying-cost: major wind risk, 55% chance of damaging wind over 30y; moderate wildfire risk; extreme-heat days projected 6→20/yr by 2055 (HVAC capex compounding) — expect insurance premiums to compound above CPI over the hold.
Questions for the listing agent
- Built in 1977 — when were the roof, HVAC, electrical panel, plumbing, and water heater last replaced?
- Property tax is high relative to price — has the assessment been appealed recently, and will the sale trigger a re-assessment?
- Is there a deadline driving the sale (1031 exchange, divorce, estate, relocation)? That informs how much negotiation room exists.
- What's the average days-on-market for RENTAL listings here right now (not sales)? A rising rental-DOM trend means longer vacancies and softer asking-rent achievability than the comps imply.
- What's the recent tenant-quality profile in this submarket — average credit score on applications, eviction rate, late-payment / NSF rate, and stable-employment percentage? A property-management company in the area should have these aggregated.
- How much new for-sale + rental construction is in the pipeline within 1–3 miles? Heavy new supply typically softens prices + rents 12–24 months out; constrained supply supports both.
Investment metrics
- 1% rule
- 1.31% ✓
- Cap rate
- 9.27%
- Cash-on-cash
- 10.62%
- DSCR
- 1.47
- GRM
- 6.4
CMA / ARV
- ARV (median comp)
- $490,534
- List price
- $168,740
- Delta
- -65.60%
- Verdict
- UNDERPRICED
- Comps
- 17 within 1.0 mi
Show comp detail 6 sales within ~0.75 mi
| Address | Dist | Beds/Ba | Sqft | Sold | Price | $/sf | Match |
|---|---|---|---|---|---|---|---|
| 1103 Ute Rd | 0.00mi | 3/2.0 | 1,662 (0%) | 0mo | $168,740 | $102 | 100 |
| 108 Horizon | 0.33mi | 3/2.0 | 1,820 (+10%) | 14mo | $550,000 | $302 | 57 |
| 808 Twin Sails | 0.30mi | 3/2.5 | 1,898 (+14%) | 11mo | $499,900 | $263 | 52 |
| 200 Right Ln Unit A | 0.70mi | 3/2.5 | 1,616 (-3%) | 14mo | $415,000 | $257 | 49 |
| 516 Mountain Dew St | 0.27mi | 3/2.5 | 1,848 (+11%) | 22mo | $475,000 | $257 | 49 |
| 104 Horizon | 0.34mi | 2/2.0 (-1) | 1,473 (-11%) | 19mo | $425,000 | $289 | 44 |
Match score weights: distance 35% · size 25% · config 20% · recency 20%. Top-matched comps best support the ARV.
Projected returns pro-forma
0.95% appreciation · 3.0% rent growth · sell at horizon
- IRR
- 12.3%
- Equity multiple
- 1.62×
- Total profit
- $29,475
- Equity at exit
- $57,125
- IRR
- 16.1%
- Equity multiple
- 2.94×
- Total profit
- $91,635
- Equity at exit
- $75,545
Cash invested: $47,247 (down + closing). Projections, not guarantees.
Landlord ↔ Tenant lean methodology
- Overall (STATE)
- 87 Strongly Landlord-Friendly
- State Texas
- 87 Strongly Landlord-Friendly · R+5
- County
- — inherits STATE
- City
- — inherits STATE
ZIP-level market 78657
- Home prices YoY
- 0.4%
- Active inventory
- 1223
- Price-to-rent
- 6.4×
Monthly cashflow live
- Estimated rent
- $2,208 high interval (Pro) →
- Mortgage (P&I)
- −$885
- Tax from tax record
- −$370 /mo · $4,446/yr
- Insurance
- −$70
- HOA
- −$0
- Vacancy / Maint / Mgmt
- −$464
- Net cashflow
- $418
Break-even live
UW: 25.0% down · 7.5% · 30yr · 1.5% tax · 5.0% vac · 8.0% maint · 8.0% mgmt
Financing live
Cash to close
- Down payment
- $42,185
- Closing costs
- $5,062
- Reserves months
- —
- Total cash needed
- —
Loan-product check · same deal, 3 products live
Conventional
25% down · 7.5% · 30yr
- Down + closing
- —
- Monthly P&I
- —
- Monthly cashflow
- —
- DSCR
- —
- Eligible?
- —
Personal DTI + credit; lowest rate.
DSCR
20% down · 8.5% · 30yr
- Down + closing
- —
- Monthly P&I
- —
- Monthly cashflow
- —
- DSCR
- —
- Eligible?
- —
No personal income docs; deal must DSCR.
Hard money
10% down · 12.0% · 12mo
- Down + closing
- —
- Monthly P&I
- —
- Monthly cashflow
- —
- DSCR
- —
- Eligible?
- —
Short-term bridge; refi at stabilization.
Rent comps 25 comps
| Address | Beds | Baths | Sqft | Rent | $/sqft | DOM | Units | Dist |
|---|---|---|---|---|---|---|---|---|
| 300 Out Yonder #172 Horseshoe Bay, TX | 2.0 | 2.0 | 1321 | $1,275 | $0.97 | 43d | 1 | 0.28mi |
| 306 Out Yonder #154 Horseshoe Bay, TX | 2.0 | 2.0 | 1900 | $1,550 | $0.82 | 23d | 1 | 0.30mi |
| 1314 Clayton Nolen Dr Horseshoe Bay, TX | 3.0 | 2.0 | 1885 | $2,850 | $1.51 | 23d | 1 | 0.32mi |
| 307 Poker Chip Horseshoe Bay, TX | 2.0 | 2.5 | 1160 | $1,995 | $1.72 | 23d | 1 | 0.35mi |
| 400 Green Leaf Unit 319-202 Horseshoe Bay, TX | 3.0 | 2.0 | 1141 | $1,349 | $1.18 | 23d | 1 | 0.37mi |
| 400 Green Leaf Horseshoe Bay, TX | 1.0–3.0 | 1.0–2.0 | 962 | $1,349 | $1.40 | 23d | 2 | 0.37mi |
| 400 Hi There #101 Horseshoe Bay, TX | 2.0 | 1.5 | 1160 | $1,900 | $1.64 | 43d | 1 | 0.38mi |
| 1406 Prospect Horseshoe Bay, TX | 3.0 | 2.0 | 1998 | $2,700 | $1.35 | 3d | 1 | 0.38mi |
| 402 Hi Stirrup Horseshoe Bay, TX | 3.0 | 3.0 | 2038 | $2,200 | $1.08 | 43d | 1 | 0.41mi |
| 512 Side Saddle Horseshoe Bay, TX | 4.0 | 3.0 | 1850 | $2,700 | $1.46 | 43d | 1 | 0.52mi |
| 102 Prairie Horseshoe Bay, TX | 3.0 | 2.0 | 2154 | $2,700 | $1.25 | 43d | 1 | 0.55mi |
| 200 Full Moon Horseshoe Bay, TX | 2.0 | 2.0 | 1171 | $1,800 | $1.54 | 12d | 1 | 0.60mi |
| 100 Bay Point Dr Horseshoe Bay, TX | 2.0 | 2.0 | 1243 | $1,950 | $1.57 | 12d | 1 | 0.78mi |
| 100 Bay Point Dr #7 Horseshoe Bay, TX | 2.0 | 2.0 | 1243 | $2,150 | $1.73 | 10d | 1 | 0.81mi |
| 118 Cap Rock Horseshoe Bay, TX | 3.0 | 2.5 | 2052 | $3,800 | $1.85 | 1d | 1 | 0.89mi |
| 1210 Hi Stirrup #209 Horseshoe Bay, TX | 3.0 | 2.0 | 1248 | $1,500 | $1.20 | 43d | 1 | 0.90mi |
| 1206 Hi Stirrup Horseshoe Bay, TX | 3.0 | 2.0 | 1248 | $1,200 | $0.96 | 43d | 1 | 0.91mi |
| 412 Short Circuit #3 Horseshoe Bay, TX | 2.0 | 2.0 | 1333 | $1,650 | $1.24 | 43d | 1 | 0.92mi |
| 106 Dawn #3 Horseshoe Bay, TX | 2.0 | 2.0 | 1088 | $1,600 | $1.47 | 23d | 1 | 1.00mi |
| 106 Cross Bow Horseshoe Bay, TX | 3.0 | 3.0 | 1764 | $2,900 | $1.64 | 43d | 1 | 1.07mi |
| 104 Cove E #107 Horseshoe Bay, TX | 3.0 | 2.0 | 1250 | $2,500 | $2.00 | 23d | 1 | 1.11mi |
| 101 W Bank #14 Horseshoe Bay, TX | 3.0 | 2.0 | 1344 | $3,500 | $2.60 | 43d | 1 | 1.27mi |
| 203 Hi Cir W Horseshoe Bay, TX | 3.0 | 2.0 | 1823 | $2,595 | $1.42 | 23d | 1 | 1.29mi |
| 403 Island Dr Horseshoe Bay, TX | 3.0 | 3.0 | 1875 | $4,300 | $2.29 | 43d | 1 | 1.31mi |
| 410 Hi Cir W Horseshoe Bay, TX | 2.0 | 2.0 | 1964 | $2,450 | $1.25 | 43d | 1 | 1.35mi |
Listing history 35 events
-
2026-04-27$168,740 Active 27-char remark
-
2025-11-21historical
-
2025-10-14price $329,500
-
2025-10-14price $329,500
-
2025-10-14price
-
2025-09-03price $349,000
-
2025-09-03price $349,000
-
2025-09-03price
-
2025-08-19$395,000 Active
-
2025-07-21Active
-
2025-02-04historical $1,995
-
2025-01-28price $1,995
-
2024-12-28$2,195
-
2024-12-19historical $2,195
-
2024-12-09historical
-
2024-11-27price $2,195
-
2024-10-22price $2,295
-
2024-10-21price $365,000
-
2024-10-21price
-
2024-10-10$2,395
-
2024-09-23price $375,000
-
2024-09-23price
-
2024-08-27price $385,000
-
2024-08-27price
-
2024-07-07$399,000 Active
-
2024-07-07Active
-
2022-01-12soldstatus
-
2022-01-07soldstatus Closed
-
2021-11-18historical Active Under Contract
-
2021-11-10$327,900 Active
-
2021-03-15soldstatus
-
2012-05-04soldstatus
-
2012-05-02soldstatus
-
2012-02-21$150,000
-
2005-11-01soldstatus
ⓘ Source: listings_history table (triggers on properties + properties_extension) + one-shot
backfill from property_details.listing_events for pre-trigger history.
Tax reassessment forecast TX · Resets to sale price
- Current annual tax
- $4,446 · $370/mo
- Projected year-2 tax
- $4,446 · $370/mo
- Expected delta
- $0/yr ($0/mo · 0.0%)
ⓘ Screening estimate from a state-policy table — verify with the county assessor before closing.
Climate risk First Street
- Flood 1/10 Low FEMA zone X (unshaded) · 0% chance over 30 yrs
- Wildfire 5/10 Major
- Heat 8/10 Severe 6 d/yr ≥106°F today · 20 d/yr by 30 yrs out
- Wind 6/10 Major 55% chance of damaging wind over 30 yrs
- Air quality 1/10 Low 0 unhealthy d/yr today · 0 by 30 yrs out
Nearby sold comps map
Loading sold comps map…
Walkable amenities ~0.75 mi
Loading nearby amenities…
Taxation est. · year 1
- Rental income
- $26,490
- − Mortgage interest
- −$9,452
- − Property taxes
- −$4,446
- − Insurance
- −$844
- − Repairs & maintenance
- −$2,119
- − Management
- −$2,119
- − Depreciation
- −$4,909
- Taxable income
- $2,601
- Est. tax owed @ 24.0%
- −$624
- After-tax cash flow
- $4,395/yr
For passive investors: Depreciation is non-cash, so a rental often shows a tax loss while cash-flowing — sheltering income. Rental losses are passive: they offset passive income freely, and up to $25,000/yr can offset ordinary (W-2) income if you actively participate and your MAGI is under $100k (phasing out to $0 by $150k); unused losses carry forward. On sale, claimed depreciation is recaptured at up to 25%, and gains may owe capital-gains tax (a 1031 exchange can defer both). Figures are a year-1 estimate at your 24.0% rate — not tax advice; consult a CPA.
Schools (NCES district)
- District
- Llano ISD
- NCES district ID
- 4827810
- Math proficiency
- 40% ▼ -5.00%
- Reading proficiency
- 43% ▼ -5.00%
- Median HH income
- $46,746
- Composite
- 35.42/100
- National rank
- #4940
- State rank
- #359 of 826 in TX
Livability — Horseshoe Bay
- Score
- 66/100
- State rank
- #625
- US rank
- #11913
Category grades
Schools grade is shown separately in the Schools card above.
Census & demographics
- Census place
- Horseshoe Bay, TX
- County
- Llano County · 16,310 people
- City population
- 7,591
- Metro
- nan
- Population (ZIP)
- 7,591
- Household income
- $91,452
- Rent vs Own
- Severe rent burden
- 45.0
Population outlook (Llano County) Hauer SSP2
- Today (2025)
- 20,847 people
- By 2030
- 21,350 · +2.4%
- By 2040
- 22,281 · +6.9%
- By 2050
- 23,173 · +11.2%
- By 2075
- 25,526 · +22.4%
- By 2100
- 25,866 · +24.1%
Race, ethnicity, and origin ACS 2023
- Neighborhood character
- Predominantly White (80%)
- Race & ethnicity
- White 80% Hispanic / Latino 16% Two or more races 8% Asian 1%
- Hispanic origin (detail)
- Mexican 14%
- Common ancestry
- Slovak 3% Portuguese 3% Italian 2%
- Foreign-born
- 8% · Canada
- Languages at home
- 87% English-only · Spanish 12% Other Indo-European 1%
Political lean MEDSL · Llano
- 2024 margin
- Solid R (+60.9) · D 19.2% · R 80.0%
- 2008→2024 swing
- -8.6pp toward R · 2008: -52.2pp · 2024: -60.9pp
- All cycles
- 2024: R+60.9 2020: R+60.1 2016: R+62.2 2012: R+60.4 2008: R+52.2
Not yet ingested
- Civics
- —
Market trends
- HPI YoY
- ▲ 0.95%
- Current HPI
- 229.9918
- Rent YoY
- —
- Metro
- nan
- State GDP YoY
- ▲ 3.95%
- F500 in state
- 110
Industry mix (Fortune 500 HQ in TX)
| Industry | F500 HQs | Revenue |
|---|---|---|
| Energy | 16 | $1,198B |
|
||
| Technology | 5 | $198B |
|
||
| Engineering / Construction | 4 | $72B |
|
||
| Energy Services | 3 | $60B |
|
||
| Utilities | 3 | $41B |
|
||
| Healthcare | 2 | $330B |
|
||
Price history
+12.5% since first listed37 events — show timeline
- 2026-06-16 Sold (MLS) — HARMLS
- 2026-05-26 Pending — HARMLS
- 2026-04-27 Listed $168,740 HARMLS
- 2025-11-21 Listing Removed — CTXMLS
- 2025-10-14 Price Changed $329,500 HLMLS as distributed by MLS GRID
- 2025-10-14 Price Changed $329,500 CTXMLS
- 2025-10-14 Price Changed — Unlock MLS
- 2025-09-03 Price Changed $349,000 CTXMLS
- 2025-09-03 Price Changed $349,000 HLMLS as distributed by MLS GRID
- 2025-09-03 Price Changed — Unlock MLS
- 2025-08-19 Listed $395,000 CTXMLS
- 2025-07-21 Listed — Unlock MLS
- 2025-02-04 Rental Removed $1,995 ACTRIS
- 2025-01-28 Price Changed $1,995 ACTRIS
- 2024-12-28 Listed for Rent $2,195 ACTRIS
- 2024-12-19 Rental Removed $2,195 ACTRIS
- 2024-12-09 Listing Removed — CTXMLS
- 2024-11-27 Price Changed $2,195 ACTRIS
- 2024-10-22 Price Changed $2,295 ACTRIS
- 2024-10-21 Price Changed $365,000 CTXMLS
- 2024-10-21 Price Changed — Unlock MLS
- 2024-10-10 Listed for Rent $2,395 ACTRIS
- 2024-09-23 Price Changed $375,000 CTXMLS
- 2024-09-23 Price Changed — Unlock MLS
- 2024-08-27 Price Changed $385,000 CTXMLS
- 2024-08-27 Price Changed — Unlock MLS
- 2024-07-07 Listed $399,000 CTXMLS
- 2024-07-07 Listed — Unlock MLS
- 2022-01-12 Sold (Public Records) — Public Records
- 2022-01-07 Sold (MLS) — Unlock MLS
- 2021-11-18 Contingent — Unlock MLS
- 2021-11-10 Listed $327,900 Unlock MLS
- 2021-03-15 Sold (Public Records) — Public Records
- 2012-05-04 Sold (Public Records) — Public Records
- 2012-05-02 Sold (MLS) — Unlock MLS
- 2012-02-21 Listed $150,000 Unlock MLS
- 2005-11-01 Sold (Public Records) — Public Records
Property tax history
+6.2%/yrLatest (2025): $4,446 · -14.6% YoY. Source: county tax records.
Cash-flow waterfall
monthlySold comps — $/sqft
last 12 mo · ≤1 miLoading sold comps…