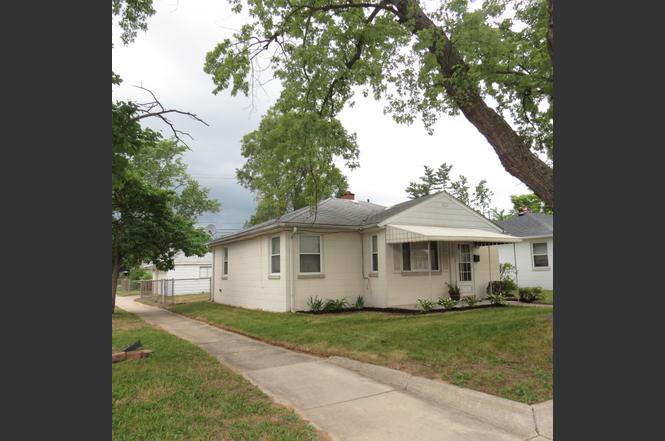
24162 Dartmouth St · Dearborn, MI
Flood risk 1/10 · Minimal
- FEMA flood zone
- X (unshaded)
- Chance of flooding over 30 yrs
- 0.0%
- Est. flood insurance / yr
- $507 – $1,088
Fire risk 1/10 · Minimal
- Est. fire insurance / yr
- $784 – $1,456
Heat risk 3/10 · Minor
- Hot days now (above 98°F)
- 7 days/yr
- Hot days in 30 yrs
- 15 days/yr
Wind risk 2/10 · Minimal
- Chance of severe wind over 30 yrs
- —
Air-quality risk 2/10 · Minimal
- Unhealthy air days now
- 1 days/yr
- Unhealthy air days in 30 yrs
- 2 days/yr
Risk factors via First Street. Map © Google.
Why this score? — see what drove the C- grade
The composite is a weighted blend of 9 inputs, each scored 0–100. Each bar is that input's sub-score; the figure is the points it added to the 100-point composite (weight × sub-score).
- Cash flow +18.8/30.0
- ARV discount +7.7/15.0
- DSCR +5.9/10.0
- 1% rule +5.0/10.0
- Livability +4.0/5.0
- Rent growth +3.4/5.0
- Schools +2.8/10.0
- Condition / age +2.5/5.0
- Appreciation +0.0/10.0
$149,900
🖨 Deal sheet (PDF) 📄 Offer letter ✓ Due diligence
Listing remarks MLS
Cute, solid ranch on a corner lot with a large, fully fenced back yard. Separate dining room with look-through window into living space. Extra storage room with shelving off kitchen. Nice curb appeal with a sprawling beautiful shade tree. Large 2-car detached garage with side entry and garage opener. Home has passed city inspection. Prime location with easy access to 94, Telegraph and amenities.
Key facts
- Separate dining room
- Sprawling shade tree
- Corner lot
Tags
Property features AI
Exterior
- Parking: Detached 2-car garage
- Utilities: Natural gas available; Electricity available; Public water
- Home design: Ranch-style single-family residence; Approximately 978 total building area; Built in 1949
- Construction: Block construction; Shingle roof; Slab foundation
- Exterior features: Corner lot with sidewalk; Paved road access; Public water
Interior
- Kitchen: Disposal
- Bedrooms: Primary bedroom (approx. 11 x 11); Second bedroom (approx. 9 x 9)
- Bathrooms: 1 full bathroom (approx. 10 x 6)
- Heating & cooling: Forced air heating
- Interior features: Garage door opener; Window treatments
- Laundry & utility: Slab foundation (no basement finish indicated)
Neighborhood map
What this means for you Summary
Snapshot
- This is a 2-bed/1.0-bath single-family listed at $150k.
Deal economics
- At list price, monthly cash flow is $150 ($2k/yr) — positive.
- The deal already cash-flows at list — no discount required.
- Meets the 1% rule at list price ($2k rent vs $150k).
- Cap rate 7.5% vs local median 4.3% in Dearborn — top-decile yield for the area; either an underpriced asset or a hidden risk that comps aren't pricing in. Stress-test before assuming the spread holds.
Location & tenants
- Location reads 80/100 on livability (#84 in MI, #1,904 nationally) — a professional / high-income tenant draw. Strengths: commute A+, cost of living A+, housing A+; Watch: amenities D.
- Dearborn City School District (urban): math 26% / reading 39% proficiency, ranked #325 of 540 in MI (top 60%) — families likely to look elsewhere, expect single-tenant / working-renter base with shorter leases; 66% free/reduced lunch — lower-income household profile, screen leases tightly.
- Zoned schools: Long Elementary School (math 22% / reading 32%, grade F, #923 of 1,397 statewide, top 69%, 230 students, 70% FRL); Smith Middle School (math 24% / reading 40%, grade F, #317 of 493 statewide, top 65%, 465 students, 62% FRL); Edsel Ford High School (math 20% / reading 43%, grade F, #425 of 713 statewide, top 60%, 1,639 students, 68% FRL) — zoned schools at 67% FRL track the district average.
- Market conditions: Rents rising (+3.6%/yr); 154 active listings in the ZIP; 27 comparable units currently listed for rent nearby; rentals at typical pace (median 17d on market — plan ~3-4 weeks tenant-placement turnaround); solid renter incomes; 2,639 units permitted in Wayne County in 2024 (1,216 in 5+ unit buildings).
Forward outlook
- Local home prices are declining (-3.0%/yr); year-one equity from $1k of loan paydown is wiped out by about $4k of value loss. Plan a longer hold.
- Wayne County population projected at -17% by 2050 — secular population decline; favor cash flow + early exit over multi-decade hold.
Negotiation context
- Only 6 days on market — expect competitive offers; lowballing is unlikely to land.
- 14 sale attempts since 26y ago with the ask held roughly flat each time — persistent listings suggest the price (not the market) is what's stuck; bring a comps-based counter.
- Current owner paid $112k; 34% above their basis — modest negotiation headroom, anchor on the comps not their cost.
Risks & watch-outs
- Watch-outs: built in 1949 — expect roof / HVAC / electrical / plumbing capex.
Questions for the listing agent
- Built in 1949 — when were the roof, HVAC, electrical panel, plumbing, and water heater last replaced?
- Is there a deadline driving the sale (1031 exchange, divorce, estate, relocation)? That informs how much negotiation room exists.
- Schools are D-rated, which usually means shorter tenancies and higher turnover. Who's the typical renter profile here, and what's been the actual vacancy rate?
- What's the average days-on-market for RENTAL listings here right now (not sales)? A rising rental-DOM trend means longer vacancies and softer asking-rent achievability than the comps imply.
- What's the recent tenant-quality profile in this submarket — average credit score on applications, eviction rate, late-payment / NSF rate, and stable-employment percentage? A property-management company in the area should have these aggregated.
- How much new for-sale + rental construction is in the pipeline within 1–3 miles? Heavy new supply typically softens prices + rents 12–24 months out; constrained supply supports both.
Investment metrics
- 1% rule
- 1.00% ✓
- Cap rate
- 7.49%
- Cash-on-cash
- 4.28%
- DSCR
- 1.19
- GRM
- 8.3
CMA / ARV
- ARV (on-the-fly)
- $150,612
- Comps found
- 12
Show comp detail 12 sales within ~0.75 mi
| Address | Dist | Beds/Ba | Sqft | Sold | Price | $/sf | Match |
|---|---|---|---|---|---|---|---|
| 24304 Carlysle St | 0.13mi | 2/1.0 | 895 (-8%) | 2mo | $137,000 | $153 | 78 |
| 25036 Colgate St | 0.42mi | 3/1.0 (+1) | 945 (-3%) | 1mo | $85,000 | $90 | 69 |
| 24360 Pennie St | 0.56mi | 3/1.0 (+1) | 988 (+1%) | 4mo | $142,000 | $144 | 64 |
| 4145 Parker St | 0.68mi | 3/1.0 (+1) | 976 (-0%) | 1mo | $195,000 | $200 | 62 |
| 25046 Andover Dr | 0.41mi | 3/1.0 (+1) | 910 (-7%) | 3mo | $140,000 | $154 | 61 |
| 4116 Syracuse St | 0.36mi | 3/1.0 (+1) | 1,068 (+9%) | 3mo | $153,000 | $143 | 61 |
| 24337 Pennie St | 0.59mi | 3/1.0 (+1) | 1,008 (+3%) | 2mo | $168,000 | $167 | 60 |
| 24409 Stanford St | 0.24mi | 3/1.0 (+1) | 1,107 (+13%) | 2mo | $129,900 | $117 | 60 |
| 4165 Westpoint St | 0.30mi | 3/1.0 (+1) | 847 (-13%) | 1mo | $170,000 | $201 | 58 |
| 4140 Syracuse St | 0.37mi | 3/1.0 (+1) | 860 (-12%) | 2mo | $150,000 | $174 | 56 |
| 25038 Annapolis St | 0.55mi | 2/1.0 | 841 (-14%) | 1mo | $125,000 | $149 | 50 |
| 23245 Annapolis St | 0.72mi | 2/1.0 | 870 (-11%) | 1mo | $150,000 | $172 | 48 |
Match score weights: distance 35% · size 25% · config 20% · recency 20%. Top-matched comps best support the ARV.
Projected returns pro-forma
-3.0% appreciation · 3.57% rent growth · sell at horizon
- IRR
- -8.9%
- Equity multiple
- 0.67×
- Total profit
- $-13,855
- Equity at exit
- $22,351
- IRR
- 1.3%
- Equity multiple
- 1.09×
- Total profit
- $3,918
- Equity at exit
- $12,961
Cash invested: $41,972 (down + closing). Projections, not guarantees.
Landlord ↔ Tenant lean methodology
- Overall (STATE)
- 62 Landlord-Friendly
- State Michigan
- 62 Landlord-Friendly · EVEN
- County
- — inherits STATE
- City
- — inherits STATE
ZIP-level market 48124
- Rents YoY
- 3.6%
- Active inventory
- 154
- Price-to-rent
- 8.3×
Monthly cashflow live
- Estimated rent
- $1,502 high interval (Pro) →
- Mortgage (P&I)
- −$786
- Tax from tax record
- −$188 /mo · $2,261/yr
- Insurance
- −$62
- HOA
- −$0
- Lot rent
- −$0
- Vacancy / Maint / Mgmt
- −$315
- Net cashflow
- $150
Break-even live
Sensitivity live
| Price | -10% $235 | -5% $192 | +0% $150 | +5% $107 | +10% $65 |
|---|---|---|---|---|---|
| Rent | -10% $31 | -5% $91 | +0% $150 | +5% $209 | +10% $269 |
| Rate | -1.0pp $225 | -0.5pp $188 | base $150 | +0.5pp $111 | +1.0pp $72 |
UW: 25.0% down · 7.5% · 30yr · 1.5% tax · 5.0% vac · 8.0% maint · 8.0% mgmt
Financing live
Cash to close
- Down payment
- $37,475
- Closing costs
- $4,497
- Reserves months
- —
- Total cash needed
- —
Loan-product check · same deal, 3 products live
Conventional
25% down · 7.5% · 30yr
- Down + closing
- —
- Monthly P&I
- —
- Monthly cashflow
- —
- DSCR
- —
- Eligible?
- —
Personal DTI + credit; lowest rate.
DSCR
20% down · 8.5% · 30yr
- Down + closing
- —
- Monthly P&I
- —
- Monthly cashflow
- —
- DSCR
- —
- Eligible?
- —
No personal income docs; deal must DSCR.
Hard money
10% down · 12.0% · 12mo
- Down + closing
- —
- Monthly P&I
- —
- Monthly cashflow
- —
- DSCR
- —
- Eligible?
- —
Short-term bridge; refi at stabilization.
Rent comps 27 comps
| Address | Beds | Baths | Sqft | Rent | $/sqft | DOM | Units | Dist |
|---|---|---|---|---|---|---|---|---|
| 24154 Dartmouth St Dearborn, MI | 2.0 | 1.0 | 950 | $1,275 | $1.34 | 17d | 1 | 0.02mi |
| 24601 Andover Dr Dearborn Heights, MI | 3.0 | 1.5 | 1092 | $1,700 | $1.56 | 4d | 1 | 0.22mi |
| 24442 Union St Dearborn, MI | 3.0 | 1.5 | 1000 | $1,900 | $1.90 | 0d | 1 | 0.23mi |
| 4481 Westpoint St Dearborn Heights, MI | 3.0 | 2.0 | 768 | $1,549 | $2.02 | 17d | 1 | 0.41mi |
| 25016 Lehigh St Dearborn Heights, MI | 2.0 | 1.0 | 1000 | $1,400 | $1.40 | 6d | 1 | 0.47mi |
| 3809 Heritage Pkwy Dearborn, MI | 2.0 | 1.5 | 1035 | $1,400 | $1.35 | 46d | 1 | 0.53mi |
| 3763 Heritage Pkwy Dearborn, MI | 2.0 | 1.5 | 1035 | $1,450 | $1.40 | 46d | 1 | 0.58mi |
| 3755 Heritage Pkwy Dearborn, MI | 2.0 | 1.0 | 830 | $1,450 | $1.75 | 46d | 1 | 0.59mi |
| 25722 Carlysle St Dearborn Heights, MI | 3.0 | 1.0 | 1040 | $1,450 | $1.39 | 19d | 1 | 0.83mi |
| 2825 Queen St Dearborn, MI | 2.0 | 1.0 | 1000 | $1,299 | $1.30 | 46d | 1 | 0.87mi |
| 25745 Princeton St Dearborn Heights, MI | 3.0 | 1.0 | 1080 | $1,500 | $1.39 | 13d | 1 | 1.02mi |
| 26089 Lehigh St Inkster, MI | 2.0 | 1.0 | 900 | $1,295 | $1.44 | 19d | 1 | 1.08mi |
| 5845 Michael St Taylor, MI | 2.0 | 1.0 | 618 | $1,325 | $2.14 | 6d | 1 | 1.10mi |
| 3620 Monroe St Dearborn, MI | 3.0 | 2.0 | 1100 | $1,800 | $1.64 | 12d | 1 | 1.12mi |
| 4934 McKinley St Dearborn Heights, MI | 3.0 | 1.0 | 1051 | $1,700 | $1.62 | 0d | 1 | 1.13mi |
| 5640 Pardee Ave Unit 7 Dearborn Heights, MI | 1.0 | 1.0 | 799 | $999 | $1.25 | 5d | 1 | 1.13mi |
| 5680 Pardee Ave Unit 3 Dearborn Heights, MI | 1.0 | 1.0 | 750 | $999 | $1.33 | 20d | 1 | 1.14mi |
| 5680 Pardee Ave Dearborn Heights, MI | 1.0 | 1.0 | 750 | $999 | $1.33 | 26d | 1 | 1.14mi |
| 24720 Michigan Ave Dearborn, MI | 2.0 | 1.0 | 900 | $1,350 | $1.50 | 46d | 1 | 1.19mi |
| 5640 Pardee Ave Dearborn Heights, MI | 1.0 | 1.0 | 799 | $999 | $1.25 | 26d | 1 | 1.20mi |
| 26382 Colgate St Inkster, MI | 2.0 | 1.0 | 850 | $935 | $1.10 | 26d | 1 | 1.29mi |
| 1441 S Telegraph Rd Dearborn, MI | 1.0 | 1.0 | 608 | $900 | $1.48 | 6d | 1 | 1.29mi |
| 4757 Dudley St Dearborn Heights, MI | 3.0 | 1.0 | 995 | $1,350 | $1.36 | 13d | 1 | 1.34mi |
| 6477 Westpoint St Taylor, MI | 1.0 | 1.0 | 650 | $900 | $1.38 | 7d | 1 | 1.43mi |
| 26707 Penn St Inkster, MI | 3.0 | 1.0 | 900 | $1,400 | $1.56 | 7d | 1 | 1.47mi |
| 4810 Campbell St Dearborn Heights, MI | 3.0 | 1.0 | 1000 | $1,700 | $1.70 | 0d | 1 | 1.49mi |
| 26742 Penn St Inkster, MI | 3.0 | 1.0 | 1000 | $1,300 | $1.30 | 19d | 1 | 1.50mi |
Listing history 5 events
-
2026-06-22days on market $149,900 Active 6 DOM
-
2026-06-21days on market $149,900 Active 5 DOM
-
2026-06-18days on market $149,900 Active 2 DOM
-
2026-06-17remarks 398-char remark
-
2026-06-17$149,900 Active 1 DOM
ⓘ Source: listings_history table (triggers on properties + properties_extension) + one-shot
backfill from property_details.listing_events for pre-trigger history.
Tax reassessment forecast MI · Partial reset (capped growth)
- Current annual tax
- $2,261 · $188/mo
- Projected year-2 tax
- $2,285 · $190/mo
- Expected delta
- +$24/yr (+$2/mo · 1.1%)
ⓘ Screening estimate from a state-policy table — verify with the county assessor before closing.
Climate risk First Street
- Flood 1/10 Low FEMA zone X (unshaded) · 0% chance over 30 yrs
- Wildfire 1/10 Low
- Heat 3/10 Moderate 7 d/yr ≥98°F today · 15 d/yr by 30 yrs out
- Wind 2/10 Low
- Air quality 2/10 Low 1 unhealthy d/yr today · 2 by 30 yrs out
Nearby sold comps map
Loading sold comps map…
Walkable amenities ~0.75 mi
Loading nearby amenities…
Taxation est. · year 1
- Rental income
- $18,027
- − Mortgage interest
- −$8,397
- − Property taxes
- −$2,261
- − Insurance
- −$750
- − Repairs & maintenance
- −$1,442
- − Management
- −$1,442
- − Depreciation
- −$4,361
- Taxable loss
- −$625
- Est. tax savings @ 24.0%
- +$150
- After-tax cash flow
- $1,948/yr
For passive investors: Depreciation is non-cash, so a rental often shows a tax loss while cash-flowing — sheltering income. Rental losses are passive: they offset passive income freely, and up to $25,000/yr can offset ordinary (W-2) income if you actively participate and your MAGI is under $100k (phasing out to $0 by $150k); unused losses carry forward. On sale, claimed depreciation is recaptured at up to 25%, and gains may owe capital-gains tax (a 1031 exchange can defer both). Figures are a year-1 estimate at your 24.0% rate — not tax advice; consult a CPA.
Schools (NCES district)
- District
- Dearborn City School District
- NCES district ID
- 2611600
- Math proficiency
- 26% ▼ -14.00%
- Reading proficiency
- 39% ▼ -8.00%
- Median HH income
- $46,884
- Composite
- 27.93/100
- National rank
- #6864
- State rank
- #325 of 540 in MI
Livability — Dearborn
- Score
- 80/100
- State rank
- #84
- US rank
- #1904
Category grades
Schools grade is shown separately in the Schools card above.
Census & demographics
- Census place
- Dearborn, MI
- County
- Wayne County · 1,562,939 people
- City population
- 86,476
- Metro
- Detroit-Warren-Dearborn, MI
- Population (ZIP)
- 34,479
- Household income
- $81,796
- Rent vs Own
- Severe rent burden
- 444.0
Population outlook (Wayne County) Hauer SSP2
- Today (2025)
- 1,675,273 people
- By 2030
- 1,620,300 · -3.3%
- By 2040
- 1,502,341 · -10.3%
- By 2050
- 1,384,039 · -17.4%
- By 2075
- 1,124,592 · -32.9%
- By 2100
- 881,193 · -47.4%
Race, ethnicity, and origin ACS 2023
- Neighborhood character
- Predominantly White (84%)
- Race & ethnicity
- White 84% Two or more races 7% Hispanic / Latino 5% Black 4%
- Hispanic origin (detail)
- Mexican 3%
- Common ancestry
- Romanian 12% Lithuanian 4% Slovak 3%
- Foreign-born
- 10% · Canada
- Languages at home
- 82% English-only · Arabic 12% Spanish 2% Other Indo-European 2%
Political lean MEDSL · Wayne
- 2024 margin
- Strong D (+29.0) · D 62.7% · R 33.7% · Other 3.6%
- 2008→2024 swing
- -20.5pp toward R · 2008: 49.5pp · 2024: 29.0pp
- All cycles
- 2024: D+29.0 2020: D+38.1 2016: D+37.3 2012: D+46.9 2008: D+49.5
Not yet ingested
- Civics
- —
Market trends
- HPI YoY
- ▼ -278.39%
- Current HPI
- 204.5229
- Rent YoY
- ▲ 3.57%
- Metro
- Detroit-Warren-Dearborn, MI
- State GDP YoY
- ▲ 1.37%
- F500 in state
- 28
Industry mix (Fortune 500 HQ in MI)
| Industry | F500 HQs | Revenue |
|---|---|---|
| Automotive Parts | 3 | $48B |
|
||
| Automotive | 2 | $372B |
|
||
| Chemicals | 1 | $45B |
|
||
| Automotive Retail | 1 | $29B |
|
||
| Healthcare / Medical Devices | 1 | $23B |
|
||
| Automotive Technology | 1 | $20B |
|
||
Price history
+66.7% since first listed25 events — show timeline
- 2026-06-16 Listed $149,900 REALCOMP
- 2026-06-16 Listed $149,900 SW Michigan MLS
- 2026-06-16 Listed $149,900 MiRealSource-MiMLS
- 2005-11-10 Sold (Public Records) $112,000 Public Records
- 2005-08-31 Sold (MLS) $113,000 REALCOMP
- 2005-07-07 Listed $109,900 REALCOMP
- 2005-07-01 Listing Removed — REALCOMP
- 2005-02-28 Listed $107,900 REALCOMP
- 2005-02-27 Listing Removed — REALCOMP
- 2004-08-27 Listed $107,900 REALCOMP
- 2003-08-28 Listing Removed — MiRealSource-MiMLS
- 2003-06-22 Listing Removed — REALCOMP
- 2003-03-03 Listed $110,000 REALCOMP
- 2003-03-03 Listed $110,000 REALCOMP
- 2003-03-03 Listed $110,000 MiRealSource-MiMLS
- 2001-05-10 Sold (MLS) $87,000 REALCOMP
- 2001-05-10 Sold (MLS) $87,000 MiRealSource-MiMLS
- 2001-03-14 Listing Removed — REALCOMP
- 2001-03-14 Listed $89,900 REALCOMP
- 2001-03-14 Listed $89,900 MiRealSource-MiMLS
- 2001-03-11 Listing Removed — REALCOMP
- 2001-03-11 Listing Removed — MiRealSource-MiMLS
- 2000-09-11 Listed $89,900 REALCOMP
- 2000-09-11 Listed $89,900 MiRealSource-MiMLS
- 2000-09-11 Listed $89,900 REALCOMP
Property tax history
+1.5%/yrLatest (2025): $2,261 · -0.3% YoY. Source: county tax records.
Cash-flow waterfall
monthlySold comps — $/sqft
last 12 mo · ≤1 miLoading sold comps…