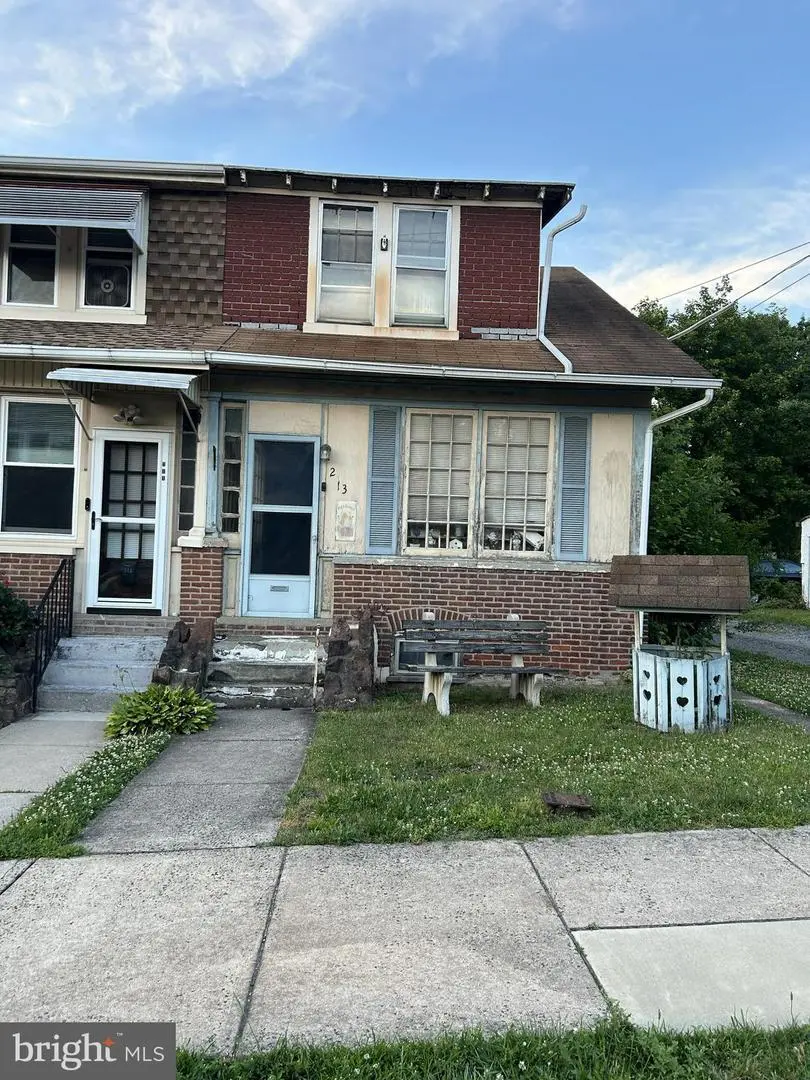
213 East St · Pottstown, PA
Flood risk 3/10 · Minor
- FEMA flood zone
- X (unshaded)
- Chance of flooding over 30 yrs
- 0.2%
- Est. flood insurance / yr
- $473 – $860
Fire risk 3/10 · Minor
- Est. fire insurance / yr
- $511 – $949
Heat risk 6/10 · Moderate
- Hot days now (above 101°F)
- 7 days/yr
- Hot days in 30 yrs
- 15 days/yr
Wind risk 4/10 · Minor
- Chance of severe wind over 30 yrs
- 20.0%
Air-quality risk 2/10 · Minimal
- Unhealthy air days now
- 1 days/yr
- Unhealthy air days in 30 yrs
- 3 days/yr
Risk factors via First Street. Map © Google.
Why this score? — see what drove the B- grade
The composite is a weighted blend of 9 inputs, each scored 0–100. Each bar is that input's sub-score; the figure is the points it added to the 100-point composite (weight × sub-score).
- Cash flow +30.0/30.0
- 1% rule +10.0/10.0
- DSCR +10.0/10.0
- ARV discount +7.5/15.0
- Rent growth +3.7/5.0
- Livability +3.6/5.0
- Condition / age +2.5/5.0
- Schools +1.5/10.0
- Appreciation +0.0/10.0
$99,900
🖨 Deal sheet 📄 Offer letter ✓ Due diligence
Listing remarks
CALLING ALL INVESTORS! This property is the one you have been waiting for! This one will not last! This Property is being sold As-Is condition. Buyer is responsible for all certifications. Seller never occupied. Neither the seller or listing agent make any representation as to the accuracy of any information contained herein. Buyer must conduct their own due diligence, verification, research and inspections and are relying solely on the results thereof. Buyer to pay all closing costs and transfer tax.
Key facts
- 2,941 sq ft lot
- Built 1920
Property features AI
Finance
- Other: Ownership: Fee simple; Year built source: Assessor
Exterior
- Parking: On-street parking
- Utilities: Public water; Public sewer
- Home design: Detached structure; Above-grade finished living area reported as 1,174 (source: assessor)
- Construction: Masonry construction; Block foundation; Above-grade and below-grade structures
- Exterior features: Lot dimensions approximately 21.00 x 0.00; No tidal water
Interior
- Bedrooms: Three bedrooms on the main level
- Bathrooms: One full bathroom on the main level
- Heating & cooling: Oil heating
- Interior features: Unfinished basement
Neighborhood map
What this means for you Summary
Snapshot
- This is a 3-bed/1.0-bath single-family listed at $100k.
Deal economics
- At list price, monthly cash flow is $456 ($5k/yr) — positive.
- The deal already cash-flows at list — no discount required.
- Meets the 1% rule at list price ($2k rent vs $100k).
- Cap rate 11.8% vs local median 5.0% in Pottstown — top-decile yield for the area; either an underpriced asset or a hidden risk that comps aren't pricing in. Stress-test before assuming the spread holds.
Location & tenants
- Location reads 72/100 on livability (#643 in PA) — a middle-class / working-renter tenant base. Strengths: cost of living A+, housing A+, health & safety A+; Watch: amenities C-, employment D+, crime F.
- Pottstown SD (suburban): math 11% / reading 23% proficiency, ranked #504 of 539 in PA (top 94%) — low school quality limits family demand, transient renter base, plan for 1-2y turnover; 62% free/reduced lunch — lower-income household profile, screen leases tightly.
- Market conditions: Rents rising fast (+4.9%/yr); 202 active listings in the ZIP; 25 comparable units currently listed for rent nearby; rentals at typical pace (median 18d on market — plan ~3-4 weeks tenant-placement turnaround); solid renter incomes; 1,936 units permitted in Montgomery County in 2024 (530 in 5+ unit buildings).
Forward outlook
- Local home prices are declining (-3.0%/yr); year-one equity from $691 of loan paydown is wiped out by about $3k of value loss. Plan a longer hold.
- Montgomery County population projected at +5% by 2050 — modest demand growth; plan on rents tracking national, not racing it.
- At projected returns (-3.0% appreciation + 4.9% rent growth), your $28k cash investment doubles in ~6 years — after that, you're playing with house money.
Negotiation context
- Only 1 days on market — expect competitive offers; lowballing is unlikely to land.
- Current owner paid $35k; list at $100k implies a 186% gain — meaningful room to come down on a strong offer.
Risks & watch-outs
- Watch-outs: property tax is 4.8% of price; built in 1920 — expect roof / HVAC / electrical / plumbing capex.
- Climate carrying-cost: extreme-heat days projected 7→15/yr by 2055 (HVAC capex compounding) — expect insurance premiums to compound above CPI over the hold.
Questions for the listing agent
- Built in 1920 — when were the roof, HVAC, electrical panel, plumbing, and water heater last replaced?
- Property tax is high relative to price — has the assessment been appealed recently, and will the sale trigger a re-assessment?
- Is there a deadline driving the sale (1031 exchange, divorce, estate, relocation)? That informs how much negotiation room exists.
- Schools are B-rated — typically a magnet for longer-tenancy family renters. What's the average tenant stay here, and is there a school-zone premium baked into asking?
- Crime grade is F in this area — have there been break-ins, vandalism, or insurance claims at this property in the last 3 years? What carrier currently insures it and at what premium?
- What's the average days-on-market for RENTAL listings here right now (not sales)? A rising rental-DOM trend means longer vacancies and softer asking-rent achievability than the comps imply.
- What's the recent tenant-quality profile in this submarket — average credit score on applications, eviction rate, late-payment / NSF rate, and stable-employment percentage? A property-management company in the area should have these aggregated.
- How much new for-sale + rental construction is in the pipeline within 1–3 miles? Heavy new supply typically softens prices + rents 12–24 months out; constrained supply supports both.
Investment metrics
- 1% rule
- 1.80% ✓
- Cap rate
- 11.77%
- Cash-on-cash
- 19.56%
- DSCR
- 1.87
- GRM
- 4.6
CMA / ARV
- ARV (on-the-fly)
- $231,278
- Comps found
- 12
Show comp detail 12 sales within ~0.75 mi
| Address | Dist | Beds/Ba | Sqft | Sold | Price | $/sf | Match |
|---|---|---|---|---|---|---|---|
| 662 Spruce St | 0.12mi | 3/1.0 | 1,082 (-8%) | 6mo | $170,000 | $157 | 76 |
| 789 Logan St | 0.27mi | 4/1.5 (+1) | 1,150 (-2%) | 1mo | $300,000 | $261 | 76 |
| 220 Wilson St | 0.29mi | 3/1.0 | 1,100 (-6%) | 2mo | $260,000 | $236 | 74 |
| 821 N Hanover St | 0.27mi | 3/1.0 | 1,061 (-10%) | 3mo | $250,000 | $236 | 69 |
| 342 Lincoln Ave | 0.43mi | 2/1.5 (-1) | 1,166 (-1%) | 3mo | $123,000 | $105 | 69 |
| 609 N Franklin St | 0.22mi | 4/2.0 (+1) | 1,254 (+7%) | 2mo | $305,000 | $243 | 68 |
| 377 N Evans St | 0.27mi | 4/1.5 (+1) | 1,282 (+9%) | 6mo | $233,000 | $182 | 59 |
| 725 Lincoln Ave | 0.68mi | 4/1.0 (+1) | 1,217 (+4%) | 2mo | $240,000 | $197 | 55 |
| 176 Manatawny St | 0.72mi | 2/1.0 (-1) | 1,232 (+5%) | 5mo | $180,000 | $146 | 49 |
| 878 Warren St | 0.73mi | 3/1.0 | 1,057 (-10%) | 6mo | $235,000 | $222 | 44 |
| 703 Walnut St | 0.74mi | 3/1.5 | 1,310 (+12%) | 4mo | $255,000 | $195 | 41 |
| 890 N Warren St | 0.75mi | 3/1.0 | 1,021 (-13%) | 6mo | $199,900 | $196 | 38 |
Match score weights: distance 35% · size 25% · config 20% · recency 20%. Top-matched comps best support the ARV.
Projected returns pro-forma
-3.0% appreciation · 4.93% rent growth · sell at horizon
- IRR
- 14.4%
- Equity multiple
- 1.59×
- Total profit
- $16,621
- Equity at exit
- $14,895
- IRR
- 25.0%
- Equity multiple
- 3.43×
- Total profit
- $67,907
- Equity at exit
- $8,638
Cash invested: $27,972 (down + closing). Projections, not guarantees.
Landlord ↔ Tenant lean methodology
- Overall (STATE)
- 62 Landlord-Friendly
- State Pennsylvania
- 62 Landlord-Friendly · EVEN
- County
- — inherits STATE
- City
- — inherits STATE
ZIP-level market 19464
- Rents YoY
- 4.9%
- Active inventory
- 202
- Price-to-rent
- 4.6×
Monthly cashflow live
- Estimated rent
- $1,803 high interval (Pro) →
- Mortgage (P&I)
- −$524
- Tax from tax record
- −$403 /mo · $4,835/yr
- Insurance
- −$42
- HOA
- −$0
- Vacancy / Maint / Mgmt
- −$379
- Net cashflow
- $456
Break-even live
UW: 25.0% down · 7.5% · 30yr · 1.5% tax · 5.0% vac · 8.0% maint · 8.0% mgmt
Financing live
Cash to close
- Down payment
- $24,975
- Closing costs
- $2,997
- Reserves months
- —
- Total cash needed
- —
Loan-product check · same deal, 3 products live
Conventional
25% down · 7.5% · 30yr
- Down + closing
- —
- Monthly P&I
- —
- Monthly cashflow
- —
- DSCR
- —
- Eligible?
- —
Personal DTI + credit; lowest rate.
DSCR
20% down · 8.5% · 30yr
- Down + closing
- —
- Monthly P&I
- —
- Monthly cashflow
- —
- DSCR
- —
- Eligible?
- —
No personal income docs; deal must DSCR.
Hard money
10% down · 12.0% · 12mo
- Down + closing
- —
- Monthly P&I
- —
- Monthly cashflow
- —
- DSCR
- —
- Eligible?
- —
Short-term bridge; refi at stabilization.
Rent comps 25 comps
| Address | Beds | Baths | Sqft | Rent | $/sqft | DOM | Units | Dist |
|---|---|---|---|---|---|---|---|---|
| 657 N Charlotte St Unit 2 Pottstown, PA | 2.0 | 1.0 | 1050 | $1,700 | $1.62 | 1d | 1 | 0.14mi |
| 24 E 5th St Pottstown, PA | 2.0 | 1.0 | 796 | $1,700 | $2.14 | 18d | 1 | 0.46mi |
| 541 Lincoln Ave Pottstown, PA | 3.0 | 1.0 | 1094 | $1,975 | $1.81 | 24d | 1 | 0.49mi |
| 220 N Penn St Unit 1 Pottstown, PA | 3.0 | 1.0 | 1184 | $1,700 | $1.44 | 24d | 1 | 0.49mi |
| 351 Union Aly Pottstown, PA | 4.0 | 1.5 | 1408 | $1,995 | $1.42 | 1d | 1 | 0.52mi |
| 262 Beech St Unit 2 Pottstown, PA | 2.0 | 1.0 | 1000 | $1,550 | $1.55 | 43d | 1 | 0.53mi |
| 122 E 3rd St Unit 3 Pottstown, PA | 2.0 | 1.0 | 1200 | $1,400 | $1.17 | 43d | 1 | 0.54mi |
| 226 Warren St Pottstown, PA | 3.0 | 1.5 | 1180 | $2,050 | $1.74 | 16d | 1 | 0.56mi |
| 457 Walnut St Pottstown, PA | 3.0 | 1.0 | 1274 | $1,600 | $1.26 | 43d | 1 | 0.58mi |
| 308 Walnut St Pottstown, PA | 3.0 | 1.0 | 888 | $1,950 | $2.20 | 4d | 1 | 0.58mi |
| 261 N York St Pottstown, PA | 2.0 | 1.0 | 800 | $1,700 | $2.12 | 18d | 1 | 0.58mi |
| 261 N York St Unit A Pottstown, PA | 3.0 | 1.0 | 800 | $1,550 | $1.94 | 43d | 1 | 0.58mi |
| 614 Beech St Pottstown, PA | 3.0 | 1.5 | 1360 | $1,900 | $1.40 | 43d | 1 | 0.60mi |
| 151 N Hanover St Unit 1 Pottstown, PA | 2.0 | 1.0 | 1000 | $1,600 | $1.60 | 18d | 1 | 0.62mi |
| 5 E 2nd St Pottstown, PA | 3.0 | 1.5 | 1085 | $2,000 | $1.84 | 2d | 1 | 0.63mi |
| 420 Chestnut St Unit 2 Pottstown, PA | 2.0 | 1.5 | 1034 | $1,795 | $1.74 | 16d | 1 | 0.65mi |
| 422 Upland St Pottstown, PA | 2.0–3.0 | 1.0–2.0 | 1082 | $1,875 | $1.73 | 1d | 5 | 0.72mi |
| 48 Chestnut St #2 Pottstown, PA | 3.0 | 1.0 | 1100 | $1,700 | $1.55 | 43d | 1 | 0.77mi |
| 207 Manatawny St Unit B Pottstown, PA | 2.0 | 1.0 | 900 | $1,350 | $1.50 | 2d | 1 | 0.77mi |
| 56 S Charlotte St Pottstown, PA | 2.0 | 1.5 | 909 | $1,520 | $1.67 | 1d | 1 | 0.86mi |
| 110 W Harmony Dr #107 Pottstown, PA | 2.0 | 2.0 | 1248 | $2,000 | $1.60 | 1d | 1 | 0.89mi |
| 450 South St Pottstown, PA | 3.0 | 1.5 | 1024 | $1,995 | $1.95 | 43d | 1 | 0.93mi |
| 113 S Washington St Unit B Pottstown, PA | 2.0 | 1.0 | 1000 | $1,700 | $1.70 | 5d | 1 | 0.94mi |
| 824 E High St Unit 3 Pottstown, PA | 2.0 | 2.0 | 900 | $1,650 | $1.83 | 43d | 1 | 0.98mi |
| 814 South St Pottstown, PA | 3.0 | 1.0 | 1008 | $1,995 | $1.98 | 24d | 1 | 1.10mi |
Listing history 2 events
-
2026-06-18remarks 506-char remark
-
2026-06-18$99,900 Active 1 DOM
ⓘ Source: listings_history table (triggers on properties + properties_extension) + one-shot
backfill from property_details.listing_events for pre-trigger history.
Tax reassessment forecast PA · Partial reset (capped growth)
- Current annual tax
- $4,835 · $403/mo
- Projected year-2 tax
- $4,835 · $403/mo
- Expected delta
- $0/yr ($0/mo · 0.0%)
ⓘ Screening estimate from a state-policy table — verify with the county assessor before closing.
Climate risk First Street
- Flood 3/10 Moderate FEMA zone X (unshaded) · 20% chance over 30 yrs
- Wildfire 3/10 Moderate
- Heat 6/10 Major 7 d/yr ≥101°F today · 15 d/yr by 30 yrs out
- Wind 4/10 Moderate 20% chance of damaging wind over 30 yrs
- Air quality 2/10 Low 1 unhealthy d/yr today · 3 by 30 yrs out
Nearby sold comps map
Loading sold comps map…
Walkable amenities ~0.75 mi
Loading nearby amenities…
Taxation est. · year 1
- Rental income
- $21,637
- − Mortgage interest
- −$5,596
- − Property taxes
- −$4,835
- − Insurance
- −$500
- − Repairs & maintenance
- −$1,731
- − Management
- −$1,731
- − Depreciation
- −$2,906
- Taxable income
- $4,338
- Est. tax owed @ 24.0%
- −$1,041
- After-tax cash flow
- $4,431/yr
For passive investors: Depreciation is non-cash, so a rental often shows a tax loss while cash-flowing — sheltering income. Rental losses are passive: they offset passive income freely, and up to $25,000/yr can offset ordinary (W-2) income if you actively participate and your MAGI is under $100k (phasing out to $0 by $150k); unused losses carry forward. On sale, claimed depreciation is recaptured at up to 25%, and gains may owe capital-gains tax (a 1031 exchange can defer both). Figures are a year-1 estimate at your 24.0% rate — not tax advice; consult a CPA.
Schools (NCES district)
- District
- Pottstown SD
- NCES district ID
- 4219680
- Math proficiency
- 11% ▼ -12.00%
- Reading proficiency
- 23% ▼ -19.00%
- Median HH income
- $43,739
- Composite
- 14.78/100
- National rank
- #9390
- State rank
- #504 of 539 in PA
Livability — Pottstown
- Score
- 72/100
- State rank
- #643
- US rank
- #6257
Category grades
Schools grade is shown separately in the Schools card above.
Census & demographics
- Census place
- Pottstown, PA
- County
- Montgomery County · 712,331 people
- City population
- 49,101
- Metro
- Philadelphia-Camden-Wilmington, PA-NJ-DE-MD
- Population (ZIP)
- 49,101
- Household income
- $79,787
- Rent vs Own
- Severe rent burden
- 1797.0
Population outlook (Montgomery County) Hauer SSP2
- Today (2025)
- 856,074 people
- By 2030
- 870,887 · +1.7%
- By 2040
- 891,195 · +4.1%
- By 2050
- 896,417 · +4.7%
- By 2075
- 903,212 · +5.5%
- By 2100
- 843,240 · -1.5%
Race, ethnicity, and origin ACS 2023
- Neighborhood character
- Predominantly White (69%)
- Race & ethnicity
- White 69% Black 15% Two or more races 9% Hispanic / Latino 9% Asian 2%
- Hispanic origin (detail)
- Mexican 2% Puerto Rican 5%
- Common ancestry
- Romanian 7% Polish 2% Iranian 2%
- Foreign-born
- 6% · Canada, China
- Languages at home
- 92% English-only · Spanish 4% Arabic 1% Other Indo-European 1%
Political lean MEDSL · Montgomery
- 2024 margin
- Strong D (+22.8) · D 60.9% · R 38.1% · Other 1.1%
- 2008→2024 swing
- +2.0pp toward D · 2008: 20.8pp · 2024: 22.8pp
- All cycles
- 2024: D+22.8 2020: D+26.3 2016: D+21.1 2012: D+14.3 2008: D+20.8
Not yet ingested
- Civics
- —
Market trends
- HPI YoY
- ▼ -253.73%
- Current HPI
- 271.9399
- Rent YoY
- ▲ 4.93%
- Metro
- Philadelphia-Camden-Wilmington, PA-NJ-DE-MD
- State GDP YoY
- ▲ 1.68%
- F500 in state
- 34
Industry mix (Fortune 500 HQ in PA)
| Industry | F500 HQs | Revenue |
|---|---|---|
| Healthcare | 2 | $309B |
|
||
| Insurance | 2 | $27B |
|
||
| Telecommunications / Media | 1 | $124B |
|
||
| Industrial Distribution | 1 | $22B |
|
||
| Financial Services | 1 | $20B |
|
||
| Chemicals / Materials | 1 | $18B |
|
||
Price history
+186.2% since first listed2 events — show timeline
- 2026-06-18 Listed $99,900 BRIGHT MLS
- 1984-01-12 Sold (Public Records) $34,900 Public Records
Property tax history
+2.1%/yrLatest (2026): $4,835 · +5.1% YoY. Source: county tax records.
Cash-flow waterfall
monthlySold comps — $/sqft
last 12 mo · ≤1 miLoading sold comps…