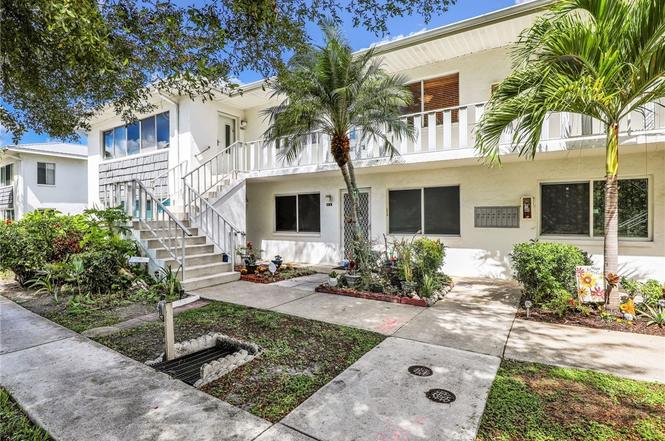
431 Van Buren St Unit C6 · Fort Myers, FL
Flood risk 3/10 · Minor
- FEMA flood zone
- X (shaded)
- Chance of flooding over 30 yrs
- 0.1%
- Est. flood insurance / yr
- $507 – $1,088
Fire risk 1/10 · Minimal
- Est. fire insurance / yr
- $947 – $1,759
Heat risk 10/10 · Severe
- Hot days now (above 107°F)
- 7 days/yr
- Hot days in 30 yrs
- 30 days/yr
Wind risk 10/10 · Severe
- Chance of severe wind over 30 yrs
- 99.0%
Air-quality risk 2/10 · Minimal
- Unhealthy air days now
- 1 days/yr
- Unhealthy air days in 30 yrs
- 1 days/yr
Risk factors via First Street. Map © Google.
Why this score? — see what drove the D grade
The composite is a weighted blend of 9 inputs, each scored 0–100. Each bar is that input's sub-score; the figure is the points it added to the 100-point composite (weight × sub-score).
- Cash flow +13.0/30.0
- ARV discount +7.5/15.0
- 1% rule +6.6/10.0
- Livability +4.3/5.0
- Schools +4.1/10.0
- DSCR +3.9/10.0
- Condition / age +2.5/5.0
- Rent growth +1.4/5.0
- Appreciation +0.0/10.0
$112,500
🖨 Deal sheet (PDF) 📄 Offer letter ✓ Due diligence
Listing remarks
Welcome home! This charming 2-bedroom, 1-bath condo offers approximately 819 sq ft of comfortable living space, ideal for year-round living or a seasonal retreat. The layout features a bright living area that flows into the dining space and kitchen, offering a functional and inviting atmosphere. The spacious bedrooms provide a relaxing retreat, while the updated bathroom is designed for easy, low-maintenance living. Residents enjoy a peaceful, well-maintained community with amenities including a pool, clubhouse, shuffleboard, and billiards, creating opportunities to relax and connect with neighbors. The low HOA fees cover many essentials and the water bill, helping to keep ownership simple
Key facts
- Clubhouse
- Billiards
- Pool
Tags
Property features AI
Finance
- Financial info: Pets allowed with conditions (maximum 2 pets, max 35 lb); contact for details
- HOA & community: Part of a homeowners association (48 units in the community); Monthly association fee covers management, insurance, irrigation water, laundry, legal/accounting, grounds maintenance, pest control, reserve fund, sewer, trash and water; Community amenities include clubhouse, fitness center, billiards, bike storage, barbecue/picnic area, playground, pool, shuffleboard court, storage, sidewalks and onsite management; Non-gated community with street lights; Senior community
Exterior
- Parking: Assigned parking; Guest parking; Paved parking; One assigned space
- Security: Smoke detector(s)
- Utilities: Public water; Public sewer; Cable available; High-speed internet available; Irrigation supplied by municipal source
- Home design: Resale property; Faces south; Entry level: 2; Exposure to the north
- Construction: Block, concrete and stucco construction; Metal roof
- Exterior features: Private courtyard; Automatic sprinklers / irrigation; Outdoor gas grill and additional grill; Storage; Community pool
Interior
- Kitchen: Electric cooktop; Range; Self-cleaning oven; Microwave; Refrigerator; Freezer; Indoor grill
- Bedrooms: Includes guest quarters
- Flooring: Tile flooring
- Bathrooms: One full bathroom
- Heating & cooling: Central heating (electric); Central air conditioning (electric); Ceiling fan(s)
- Interior features: Built-in features and closet cabinetry; Living/dining room; Separate shower (shower only); Cable TV and high-speed internet available; Window coverings / treatments; Furnishing negotiable
- Laundry & utility: Washer and dryer included; Laundry located inside and in common area
Neighborhood map
What this means for you Summary
Snapshot
- This is a 2-bed/1.0-bath condo listed at $112k.
Deal economics
- At list price, monthly cash flow is $-6 ($-74/yr) — negative.
- To cash-flow at today's rent, offer at most $111k (1.0% below list).
- Meets the 1% rule at list price ($1k rent vs $112k).
- Recommended offer: $102k (9.0% below list) — sets the bar for market timing.
- Cap rate 6.2% vs local median 3.3% in Fort Myers — top-decile yield for the area; either an underpriced asset or a hidden risk that comps aren't pricing in. Stress-test before assuming the spread holds.
Location & tenants
- Location reads 86/100 on livability (#14 in FL, #383 nationally) — a professional / high-income tenant draw. Strengths: amenities A+, commute A+, housing A+.
- Lee (suburban): math 47% / reading 50% proficiency, ranked #42 of 73 in FL (top 58%) — families likely to look elsewhere, expect single-tenant / working-renter base with shorter leases.
- Zoned schools: Sunshine Elementary School (math 38% / reading 42%, grade F, #1,491 of 2,144 statewide, top 70%, 1,301 students, 74% FRL); Oak Hammock Middle School (math 43% / reading 41%, grade D-, #340 of 571 statewide, top 61%, 1,563 students, 56% FRL); Lehigh Senior High School (math 23% / reading 45%, grade F, #394 of 667 statewide, top 60%, 2,476 students, 57% FRL).
- Market conditions: Rents falling (-4.3%/yr); 271 active listings in the ZIP; 40 comparable units currently listed for rent nearby; rentals at typical pace (median 23d on market — plan ~3-4 weeks tenant-placement turnaround); 15,411 units permitted in Lee County in 2024 (4,686 in 5+ unit buildings).
Forward outlook
- Local home prices are declining (-3.0%/yr); year-one equity from $778 of loan paydown is wiped out by about $3k of value loss. Plan a longer hold.
- Lee County population projected at +44% by 2050 — long-run rental-demand tailwind backs the buy-and-hold thesis.
Negotiation context
- It's been on market 102 days — a 9% lower offer ($102k) is reasonable based on typical stale-listing flexibility.
- 2 sale attempts since 12y ago with the ask held roughly flat each time — persistent listings suggest the price (not the market) is what's stuck; bring a comps-based counter.
- Current owner paid $34k; list at $112k implies a 231% gain — meaningful room to come down on a strong offer.
Risks & watch-outs
- Watch-outs: HOA is 29% of rent.
- Climate carrying-cost: severe wind risk, 99% chance of damaging wind over 30y; extreme-heat days projected 7→30/yr by 2055 (HVAC capex compounding) — expect insurance premiums to compound above CPI over the hold.
Questions for the listing agent
- What do current leases actually rent for vs. the listed asking? Can we see a recent rent roll and the last 12 months of T-12 income?
- It's been on market 102 days. Have you received any prior offers? Is the seller open to a 9% concession, seller financing, or rate buy-down credit?
- Built in 1975 — when were the roof, HVAC, electrical panel, plumbing, and water heater last replaced?
- What does the HOA fee cover, when was the last increase, and are there any pending special assessments or reserve-fund shortfalls?
- Any open or pending special assessments — roof, HVAC, plumbing, elevator, façade? What's the per-unit balance and payoff schedule, and is the seller paying it off at close or rolling it to the buyer?
- Why hasn't it sold? Are there any deal-killer items the seller is aware of (foundation, flood, title, zoning, code violations)?
- Is there a deadline driving the sale (1031 exchange, divorce, estate, relocation)? That informs how much negotiation room exists.
- The area grade is low — what's the realistic commute time and amenity access for the typical tenant pool here? Any planned neighborhood developments (good or bad) we should know about?
- What's the average days-on-market for RENTAL listings here right now (not sales)? A rising rental-DOM trend means longer vacancies and softer asking-rent achievability than the comps imply.
- What's the recent tenant-quality profile in this submarket — average credit score on applications, eviction rate, late-payment / NSF rate, and stable-employment percentage? A property-management company in the area should have these aggregated.
- How much new apartment / multifamily construction is in the pipeline within 1–3 miles? Heavy new supply (>2% of stock underway) typically softens rents 12–24 months out; light construction supports rent growth.
Investment metrics
- 1% rule
- 1.16% ✓
- Cap rate
- 6.23%
- Cash-on-cash
- -0.24%
- DSCR
- 0.99
- GRM
- 7.2
CMA / ARV
No comps found within radius.
Projected returns pro-forma
-3.0% appreciation · 0.0% rent growth · sell at horizon
- IRR
- -21.1%
- Equity multiple
- 0.29×
- Total profit
- $-22,279
- Equity at exit
- $16,774
- IRR
- -28.5%
- Equity multiple
- -0.08×
- Total profit
- $-33,997
- Equity at exit
- $9,727
Cash invested: $31,500 (down + closing). Projections, not guarantees.
Landlord ↔ Tenant lean methodology
- Overall (STATE)
- 87 Strongly Landlord-Friendly
- State Florida
- 87 Strongly Landlord-Friendly · R+3
- County
- — inherits STATE
- City
- — inherits STATE
ZIP-level market 33916
- Home prices YoY
- -28.2%
- Rents YoY
- -4.3%
- Active inventory
- 271
- Price-to-rent
- 7.2×
Monthly cashflow live
- Estimated rent
- $1,309 high interval (Pro) →
- Mortgage (P&I)
- −$590
- Tax from tax record
- −$26 /mo · $307/yr
- Insurance
- −$47
- HOA
- −$378
- Vacancy / Maint / Mgmt
- −$275
- Net cashflow
- $-6
Break-even live
Sensitivity live
| Price | -10% $58 | -5% $26 | +0% $-6 | +5% $-38 | +10% $-70 |
|---|---|---|---|---|---|
| Rent | -10% $-110 | -5% $-58 | +0% $-6 | +5% $46 | +10% $97 |
| Rate | -1.0pp $50 | -0.5pp $22 | base $-6 | +0.5pp $-35 | +1.0pp $-65 |
UW: 25.0% down · 7.5% · 30yr · 1.5% tax · 5.0% vac · 8.0% maint · 8.0% mgmt
Financing live
Cash to close
- Down payment
- $28,125
- Closing costs
- $3,375
- Reserves months
- —
- Total cash needed
- —
Loan-product check · same deal, 3 products live
Conventional
25% down · 7.5% · 30yr
- Down + closing
- —
- Monthly P&I
- —
- Monthly cashflow
- —
- DSCR
- —
- Eligible?
- —
Personal DTI + credit; lowest rate.
DSCR
20% down · 8.5% · 30yr
- Down + closing
- —
- Monthly P&I
- —
- Monthly cashflow
- —
- DSCR
- —
- Eligible?
- —
No personal income docs; deal must DSCR.
Hard money
10% down · 12.0% · 12mo
- Down + closing
- —
- Monthly P&I
- —
- Monthly cashflow
- —
- DSCR
- —
- Eligible?
- —
Short-term bridge; refi at stabilization.
Rent comps 40 comps
| Address | Beds | Baths | Sqft | Rent | $/sqft | DOM | Units | Dist |
|---|---|---|---|---|---|---|---|---|
| 838 Van Buren St Fort Myers, FL | 2.0 | 2.0 | 800 | $1,275 | $1.59 | 13d | 1 | 0.48mi |
| 4104 Desoto Ave Fort Myers, FL | 2.0 | 1.0 | 700 | $1,195 | $1.71 | 25d | 1 | 0.48mi |
| 3744 Estelle Ave Fort Myers, FL | 2.0 | 1.0 | 725 | $999 | $1.38 | 25d | 1 | 0.51mi |
| 9145 Flying Eagle DR Tice, FL | 1.0–3.0 | 1.0–2.5 | 1072 | $2,174 | $2.03 | 5d | 14 | 0.55mi |
| 4280 Desoto Ave #305 Fort Myers, FL | 2.0 | 2.0 | 912 | $1,550 | $1.70 | 18d | 1 | 0.55mi |
| 4280 Desoto Ave Fort Myers, FL | 2.0 | 2.0 | 948 | $1,700 | $1.79 | 25d | 1 | 0.55mi |
| 704 Karlov St Unit 704 Fort Myers, FL | 2.0 | 1.0 | 725 | $1,095 | $1.51 | 5d | 1 | 0.56mi |
| 3814 Desoto Ave Fort Myers, FL | 1.0 | 1.0 | 700 | $959 | $1.37 | 5d | 1 | 0.60mi |
| 3619 Seminole Ave Unit 3 Fort Myers, FL | 1.0 | 1.0 | 800 | $900 | $1.12 | 25d | 1 | 0.69mi |
| 3838 Madison Ave Apt 3 Fort Myers, FL | 1.0 | 1.0 | 800 | $900 | $1.12 | 25d | 1 | 0.70mi |
| 3920 Lora St Fort Myers, FL | 2.0 | 1.0 | 800 | $1,150 | $1.44 | 13d | 1 | 0.76mi |
| 3555 Seminole Ave Fort Myers, FL | 2.0 | 1.0 | 775 | $1,000 | $1.29 | 25d | 1 | 0.81mi |
| 3758 Lora St Unit 4 Fort Myers, FL | 2.0 | 1.0 | 800 | $1,025 | $1.28 | 23d | 1 | 0.83mi |
| 8 Roanoke Dr Fort Myers, FL | 3.0 | 2.0 | 1056 | $1,495 | $1.42 | 23d | 1 | 0.84mi |
| 3771 Belmont St Apt A Fort Myers, FL | 2.0 | 1.0 | 800 | $1,195 | $1.49 | 25d | 1 | 0.85mi |
| 464 Carolina Ave Fort Myers, FL | 2.0 | 1.0 | 750 | $975 | $1.30 | 21d | 1 | 0.88mi |
| 464 Carolina Ave Unit A Fort Myers, FL | 2.0 | 1.0 | 714 | $1,150 | $1.61 | 5d | 1 | 0.88mi |
| 580 Thomas Ave Fort Myers, FL | 2.0 | 1.0 | 900 | $1,200 | $1.33 | 25d | 1 | 0.89mi |
| 319 Montgomery Ave Fort Myers, FL | 3.0 | 1.0 | 978 | $1,300 | $1.33 | 16d | 1 | 0.93mi |
| 1150 Polk St Fort Myers, FL | 2.0 | 1.0 | 819 | $2,000 | $2.44 | 25d | 1 | 0.94mi |
| 4724 Tice St Fort Myers, FL | 2.0 | 1.0 | 890 | $1,100 | $1.24 | 18d | 1 | 0.95mi |
| 3666 Pearl St Fort Myers, FL | 2.0 | 1.0 | 1100 | $1,400 | $1.27 | 25d | 1 | 0.98mi |
| 3616 Pearl St Unit 4 Fort Myers, FL | 2.0 | 1.5 | 980 | $925 | $0.94 | 23d | 1 | 1.03mi |
| 326 Chattanooga Dr Fort Myers, FL | 2.0 | 1.0 | 895 | $1,475 | $1.65 | 23d | 1 | 1.16mi |
| 4900 Tice St Unit 5 Fort Myers, FL | 2.0 | 1.0 | 700 | $800 | $1.14 | 25d | 1 | 1.19mi |
| 3339 Edgewood Ave Fort Myers, FL | 2.0 | 1.0 | 860 | $1,300 | $1.51 | 18d | 1 | 1.21mi |
| 3339 Edgewood Ave Fort Myers, FL | 2.0 | 1.0 | 860 | $1,300 | $1.51 | 5d | 1 | 1.21mi |
| 328 Bellair Rd Fort Myers, FL | 2.0 | 1.0 | 900 | $1,500 | $1.67 | 25d | 1 | 1.22mi |
| 322 Louise Ave Fort Myers, FL | 2.0 | 1.0 | 765 | $1,100 | $1.44 | 5d | 1 | 1.24mi |
| 322 Louise Ave Fort Myers, FL | 2.0 | 1.0 | 765 | $1,100 | $1.44 | 21d | 1 | 1.24mi |
| 1427 Markland Ave Fort Myers, FL | 1.0 | 1.0 | 800 | $1,025 | $1.28 | 25d | 1 | 1.27mi |
| 815 Freemont St Fort Myers, FL | 2.0 | 1.0 | 850 | $1,250 | $1.47 | 25d | 1 | 1.28mi |
| 221 Maria St Unit 225 Fort Myers, FL | 2.0 | 1.0 | 720 | $1,095 | $1.52 | 25d | 1 | 1.28mi |
| 227 Maria St Fort Myers, FL | 2.0 | 1.0 | 720 | $1,095 | $1.52 | 25d | 1 | 1.28mi |
| 3233 Edgewood Ave Fort Myers, FL | 2.0 | 1.0 | 950 | $1,595 | $1.68 | 23d | 1 | 1.32mi |
| 216 Maria St Fort Myers, FL | 3.0 | 1.0 | 864 | $1,600 | $1.85 | 25d | 1 | 1.32mi |
| 3225 E Riverside Dr Fort Myers, FL | 1.0 | 1.0 | 560 | $1,800 | $3.21 | 25d | 1 | 1.35mi |
| 3165 E Riverside Dr Fort Myers, FL | 2.0 | 1.0–2.0 | 925 | $1,250 | $1.35 | 3d | 1 | 1.43mi |
| 3160 E Riverside Dr #3 Fort Myers, FL | 2.0 | 1.0 | 825 | $1,050 | $1.27 | 16d | 1 | 1.43mi |
| 3160 E Riverside Dr Unit 6 Fort Myers, FL | 2.0 | 1.0 | 825 | $1,050 | $1.27 | 25d | 1 | 1.44mi |
HOA detail condo
- Monthly dues
- $378 · $4,536/yr
- Likely covers
- waterpool
- Assessments
- None detected in remarks — confirm with the listing agent.
Listing history 19 events
-
2026-06-22days on market $112,500 Active 102 DOM
-
2026-06-17days on market $112,500 Active 98 DOM
-
2026-06-16days on market $112,500 Active 97 DOM
-
2026-06-15days on market $112,500 Active 96 DOM
-
2026-06-13days on market $112,500 Active 94 DOM
-
2026-06-10days on market $112,500 Active 91 DOM
-
2026-06-09days on market $112,500 Active 90 DOM
-
2026-06-07days on market $112,500 Active 88 DOM
-
2026-06-03days on market $112,500 Active 84 DOM
-
2026-06-02days on market $112,500 Active 83 DOM
-
2026-06-01days on market $112,500 Active 82 DOM
-
2026-06-01days on market $112,500 Active 81 DOM
-
2026-05-12price $112,500
-
2026-03-10$115,000 Active
-
2014-04-18soldstatus $34,000
-
2014-04-02historical
-
2014-03-06$37,900
-
1997-10-20soldstatus $23,900
-
1981-02-01soldstatus $38,500
ⓘ Source: listings_history table (triggers on properties + properties_extension) + one-shot
backfill from property_details.listing_events for pre-trigger history.
Tax reassessment forecast FL · Resets to sale price
- Current annual tax
- $307 · $26/mo
- Projected year-2 tax
- $934 · $78/mo
- Expected delta
- +$627/yr (+$52/mo · 204.3%)
ⓘ Screening estimate from a state-policy table — verify with the county assessor before closing.
Climate risk First Street
- Flood 3/10 Moderate FEMA zone X (shaded) · 10% chance over 30 yrs
- Wildfire 1/10 Low
- Heat 10/10 Extreme 7 d/yr ≥107°F today · 30 d/yr by 30 yrs out
- Wind 10/10 Extreme 99% chance of damaging wind over 30 yrs
- Air quality 2/10 Low 1 unhealthy d/yr today · 1 by 30 yrs out
Nearby sold comps map
Loading sold comps map…
Walkable amenities ~0.75 mi
Loading nearby amenities…
Taxation est. · year 1
- Rental income
- $15,710
- − Mortgage interest
- −$6,302
- − Property taxes
- −$307
- − Insurance
- −$562
- − Repairs & maintenance
- −$1,257
- − Management
- −$1,257
- − HOA
- −$4,536
- − Depreciation
- −$3,273
- Taxable loss
- −$1,784
- Est. tax savings @ 24.0%
- +$428
- After-tax cash flow
- $354/yr
For passive investors: Depreciation is non-cash, so a rental often shows a tax loss while cash-flowing — sheltering income. Rental losses are passive: they offset passive income freely, and up to $25,000/yr can offset ordinary (W-2) income if you actively participate and your MAGI is under $100k (phasing out to $0 by $150k); unused losses carry forward. On sale, claimed depreciation is recaptured at up to 25%, and gains may owe capital-gains tax (a 1031 exchange can defer both). Figures are a year-1 estimate at your 24.0% rate — not tax advice; consult a CPA.
Schools (NCES district)
- District
- Lee
- NCES district ID
- 1201080
- Math proficiency
- 47% ▼ -11.00%
- Reading proficiency
- 50% ▼ -4.00%
- Median HH income
- $49,518
- Composite
- 41.49/100
- National rank
- #3458
- State rank
- #42 of 73 in FL
Livability — Fort Myers
- Score
- 86/100
- State rank
- #14
- US rank
- #383
Category grades
Schools grade is shown separately in the Schools card above.
Census & demographics
- Census place
- Fort Myers, FL
- County
- Lee County · 788,662 people
- City population
- 278,598
- Metro
- Cape Coral-Fort Myers, FL
- Population (ZIP)
- 27,943
- Household income
- $52,586
- Rent vs Own
- Severe rent burden
- 2324.0
Population outlook (Lee County) Hauer SSP2
- Today (2025)
- 871,946 people
- By 2030
- 955,468 · +9.6%
- By 2040
- 1,113,587 · +27.7%
- By 2050
- 1,256,891 · +44.1%
- By 2075
- 1,560,270 · +78.9%
- By 2100
- 1,726,848 · +98.0%
Race, ethnicity, and origin ACS 2023
- Neighborhood character
- Highly diverse neighborhood (Simpson 0.71)
- Race & ethnicity
- Black 34% Hispanic / Latino 30% White 28% Two or more races 21% Asian 2%
- Hispanic origin (detail)
- Mexican 5% Puerto Rican 6% Cuban 7% Dominican 1%
- Common ancestry
- Estonian 3% Hispanic 1% Romanian 1%
- Foreign-born
- 22% · Canada, Vietnam, China
- Languages at home
- 69% English-only · Spanish 24% Other Indo-European 4% French/Haitian/Cajun 1%
Political lean MEDSL · Lee
- 2024 margin
- Strong R (+28.4) · D 35.5% · R 63.9%
- 2008→2024 swing
- -18.0pp toward R · 2008: -10.4pp · 2024: -28.4pp
- All cycles
- 2024: R+28.4 2020: R+19.2 2016: R+20.4 2012: R+16.6 2008: R+10.4
Not yet ingested
- Civics
- —
Market trends
- HPI YoY
- ▼ -95.73%
- Current HPI
- 243.2657
- Rent YoY
- ▼ -4.30%
- Metro
- Cape Coral-Fort Myers, FL
- State GDP YoY
- ▲ 3.28%
- F500 in state
- 36
Industry mix (Fortune 500 HQ in FL)
| Industry | F500 HQs | Revenue |
|---|---|---|
| Industrial Technology | 2 | $29B |
|
||
| Insurance | 2 | $17B |
|
||
| Retail | 1 | $60B |
|
||
| Technology Distribution | 1 | $58B |
|
||
| Homebuilding | 1 | $35B |
|
||
| Technology Manufacturing | 1 | $35B |
|
||
Price history
+192.2% since first listed7 events — show timeline
- 2026-05-12 Price Changed $112,500 FORTMLS
- 2026-03-10 Listed $115,000 FORTMLS
- 2014-04-18 Sold (Public Records) $34,000 Public Records
- 2014-04-02 Listing Removed — FORTMLS
- 2014-03-06 Listed $37,900 FORTMLS
- 1997-10-20 Sold (Public Records) $23,900 Public Records
- 1981-02-01 Sold (Public Records) $38,500 Public Records
Property tax history
-2.7%/yrLatest (2025): $307 · -2.1% YoY. Source: county tax records.
Cash-flow waterfall
monthlySold comps — $/sqft
last 12 mo · ≤1 miLoading sold comps…