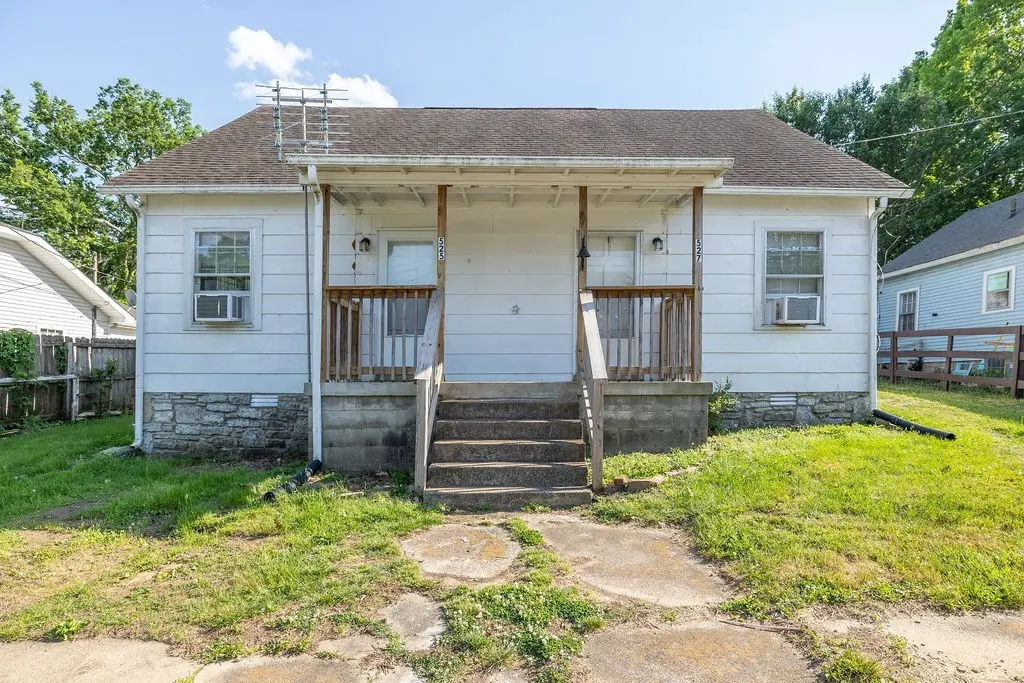
 Duplex
525 Maple St · Lewisburg, TN
Flood risk 1/10 · Minimal
- FEMA flood zone
- X (unshaded)
- Chance of flooding over 30 yrs
- 0.0%
- Est. flood insurance / yr
- $507 – $1,088
Fire risk 4/10 · Minor
- Est. fire insurance / yr
- $949 – $1,763
Heat risk 6/10 · Moderate
- Hot days now (above 105°F)
- 7 days/yr
- Hot days in 30 yrs
- 21 days/yr
Wind risk 4/10 · Minor
- Chance of severe wind over 30 yrs
- 12.0%
Air-quality risk 1/10 · Minimal
- Unhealthy air days now
- 0 days/yr
- Unhealthy air days in 30 yrs
- 0 days/yr
Risk factors via First Street. Map © Google.
Why this score? — see what drove the C grade
The composite is a weighted blend of 9 inputs, each scored 0–100. Each bar is that input's sub-score; the figure is the points it added to the 100-point composite (weight × sub-score).
- Cash flow +24.5/30.0
- ARV discount +8.3/15.0
- DSCR +7.9/10.0
- 1% rule +5.4/10.0
- Livability +3.0/5.0
- Schools +2.6/10.0
- Rent growth +2.5/5.0
- Condition / age +2.5/5.0
- Appreciation +0.0/10.0
$179,900
🖨 Deal sheet (PDF) 📄 Offer letter ✓ Due diligence
Multi-family units
County records classify this as Multi-Family (2-4 Unit). Listing-text estimate: 2 units. confirmed
Listing remarks MLS
Residence was used as a single family but is set up to be a duplex. 2 water connections. 2 natural gas hookups but only one has a meter. Tax record Sq. Ft. does not include finished upstairs which is approx. 336 sq. ft.
Key facts
- Large back yard
- 7,500 sq ft lot
- 2 parking spots
Tags
Property features AI
Finance
- Financial info: Gross annual income reported as $23,750; Net operating income reported as $20,110; Tenant pays electricity and water; Owner pays other expenses
Exterior
- Parking: Driveway with gravel surface; Two open parking spaces (two parking total)
- Utilities: Public water; Public sewer; Water available
- Home design: Duplex; Attached property; Two levels
- Construction: Built existing (year not specified); Construction materials: other
- Exterior features: Lot dimensions approximately 60 x 125; Zoned COM
Interior
- Bedrooms: One 3-bedroom unit; One 1-bedroom unit
- Flooring: Wood; Vinyl
- Bathrooms: Each unit has one bathroom
- Heating & cooling: Heating present (other type); Wall/window air conditioning units
- Interior features: Wood and vinyl flooring
- Laundry & utility: Washer hookup; Electric dryer hookup
Neighborhood map
What this means for you Summary
Snapshot
- This is a 2 × 2-bed/1.0-bath units multifamily listed at $180k.
Deal economics
- At list price, monthly cash flow is $369 ($4k/yr) — positive. Per door: $185/mo.
- The deal already cash-flows at list — no discount required.
- Meets the 1% rule at list price ($2k rent vs $180k).
- Recommended offer: $175k (3.0% below list) — sets the bar for market timing.
- Cap rate 8.8% vs local median 3.6% in Lewisburg — top-decile yield for the area; either an underpriced asset or a hidden risk that comps aren't pricing in. Stress-test before assuming the spread holds.
Location & tenants
- Location reads 59/100 on livability (#284 in TN) — a working-class tenant base; expect higher turnover. Strengths: cost of living A+, housing A+, health & safety A+; Watch: crime F, amenities F, commute F.
- Marshall County (rural): math 31% / reading 29% proficiency, ranked #58 of 139 in TN (top 42%) — families likely to look elsewhere, expect single-tenant / working-renter base with shorter leases.
- Zoned schools: Marshall Co High School (math 17% / reading 35%, grade F, #117 of 332 statewide, top 37%, 815 students, 0% FRL) — zoned schools average 0% FRL vs 48% district-wide (48 pts lower); this property's tenant base skews higher-income than the district average.
- Market conditions: 274 active listings in the ZIP; 1 comparable units currently listed for rent nearby; 400 units permitted in Marshall County in 2024 (75 in 5+ unit buildings).
Forward outlook
- Local home prices are declining (-3.0%/yr); year-one equity from $1k of loan paydown is wiped out by about $5k of value loss. Plan a longer hold.
- Marshall County population projected at +5% by 2050 — modest demand growth; plan on rents tracking national, not racing it.
Negotiation context
- It's been on market 52 days — a 3% lower offer ($175k) is reasonable based on typical stale-listing flexibility.
- 8 sale attempts since 6y ago; this cycle's ask is 15543% above the opening price — seller raised mid-cycle; expect resistance to lowballs.
Risks & watch-outs
- Watch-outs: built in 1952 — expect roof / HVAC / electrical / plumbing capex.
- Climate carrying-cost: extreme-heat days projected 7→21/yr by 2055 (HVAC capex compounding) — expect insurance premiums to compound above CPI over the hold.
Questions for the listing agent
- It's been on market 52 days. Have you received any prior offers? Is the seller open to a 3% concession, seller financing, or rate buy-down credit?
- Can we see the unit-by-unit rent roll, current vacancy, and any below-market leases? What's the average tenancy length?
- What capital expenditures (roof, boiler, parking lot, exteriors) have been made in the last 5 years, and what's planned in the next 2?
- Built in 1952 — when were the roof, HVAC, electrical panel, plumbing, and water heater last replaced?
- Is there a deadline driving the sale (1031 exchange, divorce, estate, relocation)? That informs how much negotiation room exists.
- Schools are F-rated, which usually means shorter tenancies and higher turnover. Who's the typical renter profile here, and what's been the actual vacancy rate?
- Crime grade is F in this area — have there been break-ins, vandalism, or insurance claims at this property in the last 3 years? What carrier currently insures it and at what premium?
- What's the average days-on-market for RENTAL listings here right now (not sales)? A rising rental-DOM trend means longer vacancies and softer asking-rent achievability than the comps imply.
- What's the recent tenant-quality profile in this submarket — average credit score on applications, eviction rate, late-payment / NSF rate, and stable-employment percentage? A property-management company in the area should have these aggregated.
- How much new apartment / multifamily construction is in the pipeline within 1–3 miles? Heavy new supply (>2% of stock underway) typically softens rents 12–24 months out; light construction supports rent growth.
Investment metrics
- 1% rule
- 1.04% ✓
- Cap rate
- 8.76%
- Cash-on-cash
- 8.80%
- DSCR
- 1.39
- GRM
- 8.0
CMA / ARV
- ARV (median comp)
- $183,150
- List price
- $179,900
- Delta
- -1.77%
- Verdict
- FAIR
- Comps
- 6 within 1.0 mi
Projected returns pro-forma
-3.0% appreciation · 3.0% rent growth · sell at horizon
- IRR
- -3.0%
- Equity multiple
- 0.89×
- Total profit
- $-5,675
- Equity at exit
- $26,824
- IRR
- 6.7%
- Equity multiple
- 1.50×
- Total profit
- $25,144
- Equity at exit
- $15,554
Cash invested: $50,372 (down + closing). Projections, not guarantees.
Landlord ↔ Tenant lean methodology
- Overall (STATE)
- 87 Strongly Landlord-Friendly
- State Tennessee
- 87 Strongly Landlord-Friendly · R+13
- County
- — inherits STATE
- City
- — inherits STATE
ZIP-level market 37091
- Home prices YoY
- -14.6%
- Active inventory
- 274
- Price-to-rent
- 16.0×
Monthly cashflow live
- Estimated rent
- $1,876 high interval (Pro) →
- Mortgage (P&I)
- −$943
- Tax from tax record
- −$94 /mo · $1,131/yr
- Insurance
- −$75
- HOA
- −$0
- Vacancy / Maint / Mgmt
- −$394
- Net cashflow
- $369
Break-even live
Sensitivity live
| Price | -10% $471 | -5% $420 | +0% $369 | +5% $318 | +10% $268 |
|---|---|---|---|---|---|
| Rent | -10% $221 | -5% $295 | +0% $369 | +5% $444 | +10% $518 |
| Rate | -1.0pp $460 | -0.5pp $415 | base $369 | +0.5pp $323 | +1.0pp $275 |
2-unit breakdown (identical units grouped — click to expand)
| Units | Beds | Baths | Est. rent |
|---|---|---|---|
| 2× units | 2 | 1 | $1,876 |
| #1 | 2 | 1 | $938 |
| #2 | 2 | 1 | $938 |
| Total (2 units) | $1,876 | ||
UW: 25.0% down · 7.5% · 30yr · 1.5% tax · 5.0% vac · 8.0% maint · 8.0% mgmt
Financing live
Cash to close
- Down payment
- $44,975
- Closing costs
- $5,397
- Reserves months
- —
- Total cash needed
- —
Loan-product check · same deal, 3 products live
Conventional
25% down · 7.5% · 30yr
- Down + closing
- —
- Monthly P&I
- —
- Monthly cashflow
- —
- DSCR
- —
- Eligible?
- —
Personal DTI + credit; lowest rate.
DSCR
20% down · 8.5% · 30yr
- Down + closing
- —
- Monthly P&I
- —
- Monthly cashflow
- —
- DSCR
- —
- Eligible?
- —
No personal income docs; deal must DSCR.
Hard money
10% down · 12.0% · 12mo
- Down + closing
- —
- Monthly P&I
- —
- Monthly cashflow
- —
- DSCR
- —
- Eligible?
- —
Short-term bridge; refi at stabilization.
Rent comps 1 comps
| Address | Beds | Baths | Sqft | Rent | $/sqft | DOM | Units | Dist |
|---|---|---|---|---|---|---|---|---|
| 335 E Hill Ave Lewisburg, TN | 3.0 | 2.0 | 1800 | $5,000 | $2.78 | 44d | 1 | 0.63mi |
Listing history 36 events
-
2026-06-18days on market $179,900 Active 52 DOM
-
2026-06-17price $179,900 Active 51 DOM
-
2026-06-17days on market $185,000 Active 51 DOM
-
2026-06-16days on market $185,000 Active 50 DOM
-
2026-06-15pricestatus $185,000 Active 49 DOM
-
2026-06-15days on market $189,000 Active Under Contract 49 DOM
-
2026-06-13days on market $189,000 Active Under Contract 47 DOM
-
2026-06-09days on market $189,000 Active Under Contract 43 DOM
-
2026-06-08days on market $189,000 Active Under Contract 42 DOM
-
2026-06-07statusdays on market $189,000 Active Under Contract 41 DOM
-
2026-06-03days on market $189,000 Active 37 DOM
-
2026-06-02days on market $189,000 Active 36 DOM
-
2026-06-01days on market $189,000 Active 35 DOM
-
2026-05-31days on market $189,000 Active 34 DOM
-
2026-05-07historical $1,150
-
2026-05-06price $195,000 240-char remark
-
2026-04-29$1,150
-
2026-04-27$199,000 Active 240-char remark
-
2025-12-17historical
-
2025-10-25price $235,000
-
2025-08-23price $239,000
-
2025-08-01price $239,900
-
2025-07-11price $249,000
-
2025-06-02$255,000 Active
-
2025-03-06historical $1,150
-
2025-03-03$1,150
-
2025-03-03historical $1,150
-
2025-02-01price $1,150
-
2024-11-16$1,200
-
2023-07-20soldstatus $220,000
-
2020-05-22soldstatus $68,500
-
2020-05-18soldstatus $68,500 Closed
Show marketing remark (223 chars)
Residence was used as a single family but is set up to be a duplex. 2 water connections. 2 natural gas hookups but only one has a meter. Tax record Sq. Ft. does not include finished upstairs which is approx. 336 sq. ft.
-
2020-03-19historical Contingent - Financing
Show marketing remark (223 chars)
Residence was used as a single family but is set up to be a duplex. 2 water connections. 2 natural gas hookups but only one has a meter. Tax record Sq. Ft. does not include finished upstairs which is approx. 336 sq. ft.
-
2020-02-18status Active
Show marketing remark (223 chars)
Residence was used as a single family but is set up to be a duplex. 2 water connections. 2 natural gas hookups but only one has a meter. Tax record Sq. Ft. does not include finished upstairs which is approx. 336 sq. ft.
-
2020-02-14historical Contingent - Inspection
Show marketing remark (223 chars)
Residence was used as a single family but is set up to be a duplex. 2 water connections. 2 natural gas hookups but only one has a meter. Tax record Sq. Ft. does not include finished upstairs which is approx. 336 sq. ft.
-
2020-01-27$79,900 Active
Show marketing remark (223 chars)
Residence was used as a single family but is set up to be a duplex. 2 water connections. 2 natural gas hookups but only one has a meter. Tax record Sq. Ft. does not include finished upstairs which is approx. 336 sq. ft.
ⓘ Source: listings_history table (triggers on properties + properties_extension) + one-shot
backfill from property_details.listing_events for pre-trigger history.
Tax reassessment forecast TN · Resets to sale price
- Current annual tax
- $1,131 · $94/mo
- Projected year-2 tax
- $1,277 · $106/mo
- Expected delta
- +$146/yr (+$12/mo · 12.9%)
ⓘ Screening estimate from a state-policy table — verify with the county assessor before closing.
Climate risk First Street
- Flood 1/10 Low FEMA zone X (unshaded) · 0% chance over 30 yrs
- Wildfire 4/10 Moderate
- Heat 6/10 Major 7 d/yr ≥105°F today · 21 d/yr by 30 yrs out
- Wind 4/10 Moderate 12% chance of damaging wind over 30 yrs
- Air quality 1/10 Low 0 unhealthy d/yr today · 0 by 30 yrs out
Nearby sold comps map
Loading sold comps map…
Walkable amenities ~0.75 mi
Loading nearby amenities…
Taxation est. · year 1
- Rental income
- $22,512
- − Mortgage interest
- −$10,077
- − Property taxes
- −$1,131
- − Insurance
- −$900
- − Repairs & maintenance
- −$1,801
- − Management
- −$1,801
- − Depreciation
- −$5,233
- Taxable income
- $1,569
- Est. tax owed @ 24.0%
- −$377
- After-tax cash flow
- $4,056/yr
For passive investors: Depreciation is non-cash, so a rental often shows a tax loss while cash-flowing — sheltering income. Rental losses are passive: they offset passive income freely, and up to $25,000/yr can offset ordinary (W-2) income if you actively participate and your MAGI is under $100k (phasing out to $0 by $150k); unused losses carry forward. On sale, claimed depreciation is recaptured at up to 25%, and gains may owe capital-gains tax (a 1031 exchange can defer both). Figures are a year-1 estimate at your 24.0% rate — not tax advice; consult a CPA.
Schools (NCES district)
- District
- Marshall County
- NCES district ID
- 4702670
- Math proficiency
- 31% ▼ -9.00%
- Reading proficiency
- 29% ▼ -5.00%
- Median HH income
- $43,058
- Composite
- 25.56/100
- National rank
- #7426
- State rank
- #58 of 139 in TN
Livability — Lewisburg
- Score
- 59/100
- State rank
- #284
- US rank
- #20031
Category grades
Schools grade is shown separately in the Schools card above.
Census & demographics
- Census place
- Lewisburg, TN
- Population (ZIP)
- 23,991
Population outlook (Marshall County) Hauer SSP2
- Today (2025)
- 33,222 people
- By 2030
- 33,867 · +1.9%
- By 2040
- 34,743 · +4.6%
- By 2050
- 34,954 · +5.2%
- By 2075
- 34,652 · +4.3%
- By 2100
- 31,862 · -4.1%
Race, ethnicity, and origin ACS 2023
- Neighborhood character
- Predominantly White (82%)
- Race & ethnicity
- White 82% Hispanic / Latino 8% Black 5% Two or more races 4%
- Hispanic origin (detail)
- Mexican 7%
- Common ancestry
- Serbian 4% Slovak 2% Romanian 1%
- Foreign-born
- 3% · Canada, Jamaica, Vietnam
- Languages at home
- 92% English-only · Spanish 7%
Political lean MEDSL · Marshall
- 2024 margin
- Solid R (+56.6) · D 21.2% · R 77.8%
- 2008→2024 swing
- -17.0pp toward R · 2008: -39.6pp · 2024: -56.6pp
- All cycles
- 2024: R+56.6 2020: R+50.0 2016: R+46.6 2012: R+28.9 2008: R+39.6
Not yet ingested
- Civics
- —
Market trends
- HPI YoY
- ▼ -59.86%
- Current HPI
- 350.5306
- Rent YoY
- —
- Metro
- —
- State GDP YoY
- ▲ 2.78%
- F500 in state
- 22
Industry mix (Fortune 500 HQ in TN)
| Industry | F500 HQs | Revenue |
|---|---|---|
| Healthcare | 3 | $91B |
|
||
| Retail | 3 | $72B |
|
||
| Transportation / Logistics | 1 | $88B |
|
||
| Paper / Packaging | 1 | $19B |
|
||
| Insurance | 1 | $13B |
|
||
| Energy | 1 | $12B |
|
||
Price history
+125.2% since first listed27 events — show timeline
- 2026-06-17 Price Changed $179,900 REALTRACS as Distributed by MLS Grid
- 2026-06-15 Relisted — REALTRACS as Distributed by MLS Grid
- 2026-06-15 Price Changed $185,000 REALTRACS as Distributed by MLS Grid
- 2026-06-05 Contingent — REALTRACS as Distributed by MLS Grid
- 2026-05-23 Price Changed $189,000 REALTRACS as Distributed by MLS Grid
- 2026-05-07 Rental Removed $1,150 REALTRACS
- 2026-05-06 Price Changed $195,000 REALTRACS as Distributed by MLS Grid
- 2026-04-29 Listed for Rent $1,150 REALTRACS
- 2026-04-27 Listed $199,000 REALTRACS as Distributed by MLS Grid
- 2025-12-17 Listing Removed — REALTRACS as Distributed by MLS Grid
- 2025-10-25 Price Changed $235,000 REALTRACS as Distributed by MLS Grid
- 2025-08-23 Price Changed $239,000 REALTRACS as Distributed by MLS Grid
- 2025-08-01 Price Changed $239,900 REALTRACS as Distributed by MLS Grid
- 2025-07-11 Price Changed $249,000 REALTRACS as Distributed by MLS Grid
- 2025-06-02 Listed $255,000 REALTRACS as Distributed by MLS Grid
- 2025-03-06 Rental Removed $1,150 LEASESTAR
- 2025-03-03 Listed for Rent $1,150 LEASESTAR
- 2025-03-03 Rental Removed $1,150 REALTRACS
- 2025-02-01 Price Changed $1,150 REALTRACS
- 2024-11-16 Listed for Rent $1,200 REALTRACS
- 2023-07-20 Sold (Public Records) $220,000 Public Records
- 2020-05-22 Sold (Public Records) $68,500 Public Records
- 2020-05-18 Sold (MLS) $68,500 REALTRACS as Distributed by MLS Grid
- 2020-03-19 Contingent — REALTRACS as Distributed by MLS Grid
- 2020-02-18 Relisted — REALTRACS as Distributed by MLS Grid
- 2020-02-14 Contingent — REALTRACS as Distributed by MLS Grid
- 2020-01-27 Listed $79,900 REALTRACS as Distributed by MLS Grid
Property tax history
+6.2%/yrLatest (2025): $1,131 · +7.9% YoY. Source: county tax records.
Cash-flow waterfall
monthlySold comps — $/sqft
last 12 mo · ≤1 miLoading sold comps…