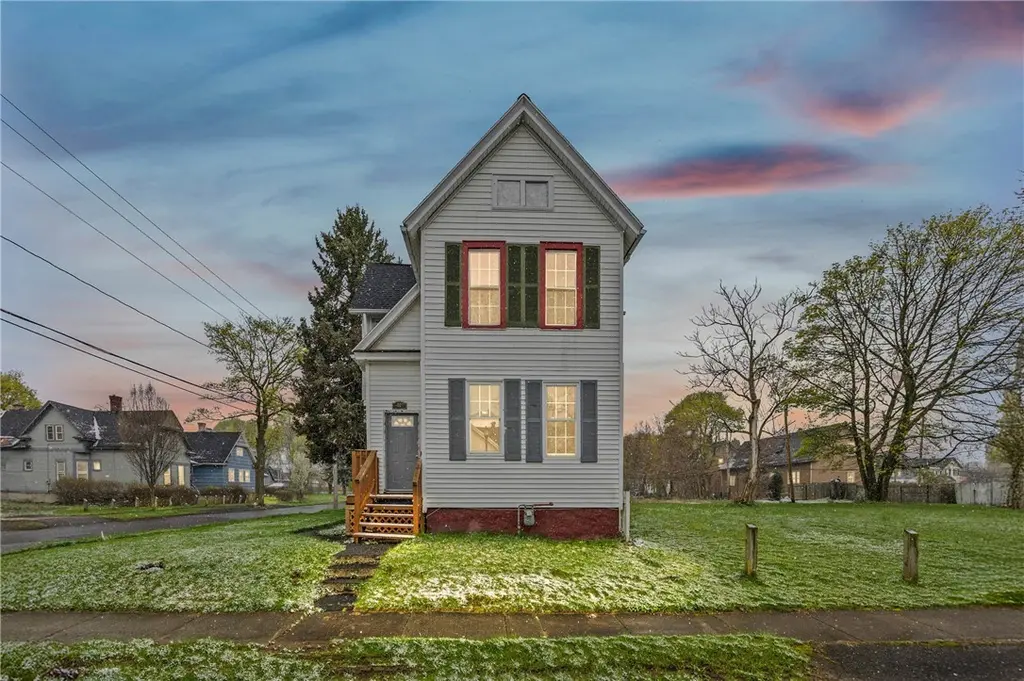
33 Laforce St · Rochester, NY
Flood risk 1/10 · Minimal
- FEMA flood zone
- X (unshaded)
- Chance of flooding over 30 yrs
- 0.0%
- Est. flood insurance / yr
- $473 – $860
Fire risk 1/10 · Minimal
- Est. fire insurance / yr
- $691 – $1,283
Heat risk 2/10 · Minimal
- Hot days now (above 95°F)
- 7 days/yr
- Hot days in 30 yrs
- 15 days/yr
Wind risk 1/10 · Minimal
- Chance of severe wind over 30 yrs
- —
Air-quality risk 2/10 · Minimal
- Unhealthy air days now
- 1 days/yr
- Unhealthy air days in 30 yrs
- 2 days/yr
Risk factors via First Street. Map © Google.
Why this score? — see what drove the B- grade
The composite is a weighted blend of 9 inputs, each scored 0–100. Each bar is that input's sub-score; the figure is the points it added to the 100-point composite (weight × sub-score).
- Cash flow +30.0/30.0
- DSCR +10.0/10.0
- 1% rule +8.8/10.0
- ARV discount +7.5/15.0
- Rent growth +4.7/5.0
- Livability +3.8/5.0
- Condition / age +2.5/5.0
- Schools +1.9/10.0
- Appreciation +0.0/10.0
$129,900
🖨 Deal sheet 📄 Offer letter ✓ Due diligence
Listing remarks MLS
Welcome to 33 Laforce St. in Rochester! This charming and move-in ready home is the perfect blend of comfort and convenience. Step inside to find brand new flooring throughout, complemented by fresh, modern paint that creates a bright and inviting atmosphere. The updated bathroom features a stylish new vanity, adding a clean and contemporary touch. Major mechanicals have already been taken care of, giving you peace of mind — the roof is approximately 1 years old, the hot water tank is 2024, and the furnace is 2010 Whether you're a first-time homebuyer or looking to add to your investment portfolio, this property offers great value and low-maintenance living. Seller reserves the right to call offers due at anytime
Key facts
- Stylish new vanity
- Brand new flooring
- Updated bathroom
Tags
Neighborhood map
What this means for you Summary
Snapshot
- This is a 4-bed/2.0-bath single-family listed at $130k.
Deal economics
- At list price, monthly cash flow is $591 ($7k/yr) — positive.
- The deal already cash-flows at list — no discount required.
- Meets the 1% rule at list price ($2k rent vs $130k).
- Recommended offer: $126k (3.0% below list) — sets the bar for market timing.
- Cap rate 11.7% vs local median 9.3% in Rochester — meaningfully above typical; check what's discounted (condition, days-on-market, listing class) to confirm the premium yield is real.
Location & tenants
- Location reads 76/100 on livability (#222 in NY, #3,482 nationally) — a middle-class / working-renter tenant base. Strengths: commute A+, cost of living A+, housing A+; Watch: schools D+, crime F, employment F.
- Rochester City School District (urban): math 21% / reading 26% proficiency, ranked #589 of 590 in NY (top 100%) — low school quality limits family demand, transient renter base, plan for 1-2y turnover; 82% free/reduced lunch — lower-income household profile, screen leases tightly.
- Market conditions: Rents rising fast (+8.9%/yr); 114 active listings in the ZIP; 10 comparable units currently listed for rent nearby; rentals at typical pace (median 21d on market — plan ~3-4 weeks tenant-placement turnaround); lower-income renter base — watch delinquency; 1,169 units permitted in Monroe County in 2024 (591 in 5+ unit buildings).
- At $1,789/mo this rent would consume 61% of the median local household income ($35k/yr) (locally 2756% of renters already pay >50% of income on rent) — very limited rent-growth headroom before tenants either downsize or default.
Forward outlook
- Local home prices are declining (-3.0%/yr); year-one equity from $898 of loan paydown is wiped out by about $4k of value loss. Plan a longer hold.
- Monroe County population projected to shrink 6% by 2050 — rents likely to lag national; underwrite the cash flow, not the appreciation.
- At projected returns (-3.0% appreciation + 8.0% rent growth), your $36k cash investment doubles in ~5 years — after that, you're playing with house money.
Negotiation context
- It's been on market 59 days — a 3% lower offer ($126k) is reasonable based on typical stale-listing flexibility.
- 6 sale attempts since 14y ago with the ask held roughly flat each time — persistent listings suggest the price (not the market) is what's stuck; bring a comps-based counter.
Risks & watch-outs
- Watch-outs: built in 1900 — expect roof / HVAC / electrical / plumbing capex.
Questions for the listing agent
- It's been on market 59 days. Have you received any prior offers? Is the seller open to a 3% concession, seller financing, or rate buy-down credit?
- Built in 1900 — when were the roof, HVAC, electrical panel, plumbing, and water heater last replaced?
- Is there a deadline driving the sale (1031 exchange, divorce, estate, relocation)? That informs how much negotiation room exists.
- Schools are D-rated, which usually means shorter tenancies and higher turnover. Who's the typical renter profile here, and what's been the actual vacancy rate?
- Crime grade is F in this area — have there been break-ins, vandalism, or insurance claims at this property in the last 3 years? What carrier currently insures it and at what premium?
- What's the average days-on-market for RENTAL listings here right now (not sales)? A rising rental-DOM trend means longer vacancies and softer asking-rent achievability than the comps imply.
- What's the recent tenant-quality profile in this submarket — average credit score on applications, eviction rate, late-payment / NSF rate, and stable-employment percentage? A property-management company in the area should have these aggregated.
- How much new for-sale + rental construction is in the pipeline within 1–3 miles? Heavy new supply typically softens prices + rents 12–24 months out; constrained supply supports both.
Investment metrics
- 1% rule
- 1.38% ✓
- Cap rate
- 11.75%
- Cash-on-cash
- 19.48%
- DSCR
- 1.87
- GRM
- 6.1
CMA / ARV
- ARV (median comp)
- $71,443
- List price
- $129,900
- Delta
- 81.82%
- Verdict
- OVERPRICED
- Comps
- 20 within 1.0 mi
Show comp detail 12 sales within ~0.75 mi
| Address | Dist | Beds/Ba | Sqft | Sold | Price | $/sf | Match |
|---|---|---|---|---|---|---|---|
| 79 Avenue B | 0.71mi | 4/2.0 | 1,922 (+1%) | 2mo | $165,000 | $86 | 63 |
| 1 Bloomingdale St | 0.29mi | 5/2.0 (+1) | 1,798 (-5%) | 13mo | $100,000 | $56 | 61 |
| 187 Bernard St | 0.52mi | 5/2.0 (+1) | 1,885 (-1%) | 13mo | $87,000 | $46 | 59 |
| 238 Weyl St | 0.71mi | 4/2.0 | 1,874 (-1%) | 7mo | $120,000 | $64 | 59 |
| 28 Fien St | 0.34mi | 3/1.5 (-1) | 1,780 (-6%) | 12mo | $80,000 | $45 | 57 |
| 77 Avenue C | 0.66mi | 4/1.5 | 1,868 (-2%) | 11mo | $60,000 | $32 | 56 |
| 232 Avenue A | 0.41mi | 4/2.0 | 1,634 (-14%) | 6mo | $130,000 | $80 | 52 |
| 206 Avenue Ave E | 0.66mi | 4/1.5 | 1,750 (-8%) | 3mo | $95,000 | $54 | 52 |
| 54 Ketchum St | 0.22mi | 3/1.0 (-1) | 1,651 (-13%) | 13mo | $75,000 | $45 | 48 |
| 60 Berlin St | 0.34mi | 4/1.0 | 1,635 (-14%) | 11mo | $55,000 | $34 | 48 |
| 15 Oakman St | 0.46mi | 4/1.0 | 1,629 (-14%) | 4mo | $82,000 | $50 | 48 |
| 140 Weyl St | 0.62mi | 5/2.0 (+1) | 2,122 (+12%) | 10mo | $127,000 | $60 | 38 |
Match score weights: distance 35% · size 25% · config 20% · recency 20%. Top-matched comps best support the ARV.
Projected returns pro-forma
-3.0% appreciation · 8.0% rent growth · sell at horizon
- IRR
- 16.7%
- Equity multiple
- 1.71×
- Total profit
- $26,000
- Equity at exit
- $19,369
- IRR
- 28.5%
- Equity multiple
- 4.14×
- Total profit
- $114,027
- Equity at exit
- $11,231
Cash invested: $36,372 (down + closing). Projections, not guarantees.
Landlord ↔ Tenant lean methodology
- Overall (STATE)
- 15 Strongly Tenant-Friendly
- State New York
- 15 Strongly Tenant-Friendly · D+10
- County
- — inherits STATE
- City
- — inherits STATE
ZIP-level market 14621
- Home prices YoY
- -4.0%
- Rents YoY
- 8.9%
- Active inventory
- 114
- Price-to-rent
- 6.1×
Monthly cashflow live
- Estimated rent
- $1,789 high interval (Pro) →
- Mortgage (P&I)
- −$681
- Tax from tax record
- −$87 /mo · $1,049/yr
- Insurance
- −$54
- HOA
- −$0
- Vacancy / Maint / Mgmt
- −$376
- Net cashflow
- $591
Break-even live
UW: 25.0% down · 7.5% · 30yr · 1.5% tax · 5.0% vac · 8.0% maint · 8.0% mgmt
Financing live
Cash to close
- Down payment
- $32,475
- Closing costs
- $3,897
- Reserves months
- —
- Total cash needed
- —
Loan-product check · same deal, 3 products live
Conventional
25% down · 7.5% · 30yr
- Down + closing
- —
- Monthly P&I
- —
- Monthly cashflow
- —
- DSCR
- —
- Eligible?
- —
Personal DTI + credit; lowest rate.
DSCR
20% down · 8.5% · 30yr
- Down + closing
- —
- Monthly P&I
- —
- Monthly cashflow
- —
- DSCR
- —
- Eligible?
- —
No personal income docs; deal must DSCR.
Hard money
10% down · 12.0% · 12mo
- Down + closing
- —
- Monthly P&I
- —
- Monthly cashflow
- —
- DSCR
- —
- Eligible?
- —
Short-term bridge; refi at stabilization.
Rent comps 10 comps
| Address | Beds | Baths | Sqft | Rent | $/sqft | DOM | Units | Dist |
|---|---|---|---|---|---|---|---|---|
| 28-30 Carthage Dr Unit 28 Rochester, NY | 3.0 | 1.0 | 1415 | $1,600 | $1.13 | 23d | 1 | 0.79mi |
| 2 Jay St Unit 2 Rochester, NY | 3.0 | 1.0 | 1252 | $1,045 | $0.83 | 43d | 1 | 1.03mi |
| 1016 Lake Ave Unit 1 Rochester, NY | 3.0 | 1.0 | 1300 | $1,600 | $1.23 | 43d | 1 | 1.15mi |
| 260 E Main St Rochester, NY | 3.0 | 1.0–2.0 | 1144 | $2,999 | $2.62 | 3d | 14 | 1.29mi |
| 1 Champeney Ter Rochester, NY | 3.0 | 1.0 | 1936 | $1,650 | $0.85 | 14d | 1 | 1.31mi |
| 98 Pierpont St Rochester, NY | 3.0 | 1.0 | 1973 | $1,295 | $0.66 | 43d | 1 | 1.35mi |
| 207 Lux St Rochester, NY | 4.0 | 1.5 | 1728 | $2,150 | $1.24 | 10d | 1 | 1.35mi |
| 327 Glenwood Ave Rochester, NY | 3.0 | 1.0 | 2012 | $1,690 | $0.84 | 3d | 1 | 1.41mi |
| 147 5th St Rochester, NY | 4.0 | 1.0 | 1289 | $1,950 | $1.51 | 21d | 1 | 1.44mi |
| 117 Northaven Ter Rochester, NY | 4.0 | 2.0 | 1460 | $1,975 | $1.35 | 10d | 1 | 1.48mi |
Listing history 26 events
-
2026-06-18days on market $129,900 Active 59 DOM
-
2026-06-17days on market $129,900 Active 58 DOM
-
2026-06-16days on market $129,900 Active 57 DOM
-
2026-06-15days on market $129,900 Active 56 DOM
-
2026-06-13days on market $129,900 Active 54 DOM
-
2026-06-13days on market $129,900 Active 53 DOM
-
2026-06-10days on market $129,900 Active 51 DOM
-
2026-06-09days on market $129,900 Active 50 DOM
-
2026-06-09days on market $129,900 Active 49 DOM
-
2026-06-07pricedays on market $129,900 Active 48 DOM
-
2026-06-05days on market $134,900 Active 45 DOM
-
2026-06-03days on market $134,900 Active 44 DOM
-
2026-06-03days on market $134,900 Active 43 DOM
-
2026-06-01days on market $134,900 Active 42 DOM
-
2026-05-31days on market $134,900 Active 41 DOM
-
2026-04-20$134,900 Active 731-char remark
Show marketing remark (731 chars)
Welcome to 33 Laforce St. in Rochester! This charming and move-in ready home is the perfect blend of comfort and convenience. Step inside to find brand new flooring throughout, complemented by fresh, modern paint that creates a bright and inviting atmosphere. The updated bathroom features a stylish new vanity, adding a clean and contemporary touch. Major mechanicals have already been taken care of, giving you peace of mind — the roof is approximately 1 years old, the hot water tank is 2024, and the furnace is 2010 Whether you're a first-time homebuyer or looking to add to your investment portfolio, this property offers great value and low-maintenance living. Seller reserves the right to call offers due at anytime
-
2018-10-22status Pending Sale
-
2018-10-17historical
-
2018-10-15$34,900 Active
-
2016-05-12historical
-
2016-04-22$49,900 Active
-
2013-09-09$34,900
-
2013-03-05historical
-
2012-07-13$55,900
-
2012-07-13historical
-
2012-07-02$62,900
ⓘ Source: listings_history table (triggers on properties + properties_extension) + one-shot
backfill from property_details.listing_events for pre-trigger history.
Tax reassessment forecast NY · Partial reset (capped growth)
- Current annual tax
- $1,049 · $87/mo
- Projected year-2 tax
- $1,622 · $135/mo
- Expected delta
- +$573/yr (+$48/mo · 54.7%)
ⓘ Screening estimate from a state-policy table — verify with the county assessor before closing.
Climate risk First Street
- Flood 1/10 Low FEMA zone X (unshaded) · 0% chance over 30 yrs
- Wildfire 1/10 Low
- Heat 2/10 Low 7 d/yr ≥95°F today · 15 d/yr by 30 yrs out
- Wind 1/10 Low
- Air quality 2/10 Low 1 unhealthy d/yr today · 2 by 30 yrs out
Nearby sold comps map
Loading sold comps map…
Walkable amenities ~0.75 mi
Loading nearby amenities…
Taxation est. · year 1
- Rental income
- $21,468
- − Mortgage interest
- −$7,276
- − Property taxes
- −$1,049
- − Insurance
- −$650
- − Repairs & maintenance
- −$1,717
- − Management
- −$1,717
- − Depreciation
- −$3,779
- Taxable income
- $5,279
- Est. tax owed @ 24.0%
- −$1,267
- After-tax cash flow
- $5,820/yr
For passive investors: Depreciation is non-cash, so a rental often shows a tax loss while cash-flowing — sheltering income. Rental losses are passive: they offset passive income freely, and up to $25,000/yr can offset ordinary (W-2) income if you actively participate and your MAGI is under $100k (phasing out to $0 by $150k); unused losses carry forward. On sale, claimed depreciation is recaptured at up to 25%, and gains may owe capital-gains tax (a 1031 exchange can defer both). Figures are a year-1 estimate at your 24.0% rate — not tax advice; consult a CPA.
Schools (NCES district)
- District
- Rochester City School District
- NCES district ID
- 3624750
- Math proficiency
- 21% ▬ 0.00%
- Reading proficiency
- 26% ▲ 4.00%
- Median HH income
- $30,923
- Composite
- 18.98/100
- National rank
- #8850
- State rank
- #589 of 590 in NY
Livability — Rochester
- Score
- 76/100
- State rank
- #222
- US rank
- #3482
Category grades
Schools grade is shown separately in the Schools card above.
Census & demographics
- Census place
- Rochester, NY
- County
- Monroe County · 674,131 people
- City population
- 432,803
- Metro
- Rochester, NY
- Population (ZIP)
- 32,381
- Household income
- $35,383
- Rent vs Own
- Severe rent burden
- 2756.0
Population outlook (Monroe County) Hauer SSP2
- Today (2025)
- 759,460 people
- By 2030
- 757,154 · -0.3%
- By 2040
- 740,644 · -2.5%
- By 2050
- 714,443 · -5.9%
- By 2075
- 645,883 · -15.0%
- By 2100
- 547,084 · -28.0%
Race, ethnicity, and origin ACS 2023
- Neighborhood character
- Diverse neighborhood (Simpson 0.66)
- Race & ethnicity
- Hispanic / Latino 40% Black 40% White 14% Two or more races 12% Asian 1%
- Hispanic origin (detail)
- Mexican 1% Puerto Rican 32% Dominican 3%
- Common ancestry
- Romanian 1% Lithuanian 1% Serbian 1%
- Foreign-born
- 8% · Canada, Jamaica
- Languages at home
- 65% English-only · Spanish 30% Other Asian/Pacific 2% French/Haitian/Cajun 1%
Political lean MEDSL · Monroe
- 2024 margin
- D (+19.1) · D 59.5% · R 40.5%
- 2008→2024 swing
- +1.4pp toward D · 2008: 17.7pp · 2024: 19.1pp
- All cycles
- 2024: D+19.1 2020: D+21.0 2016: D+14.1 2012: D+17.4 2008: D+17.7
Not yet ingested
- Civics
- —
Market trends
- HPI YoY
- ▼ -10.66%
- Current HPI
- 254.1805
- Rent YoY
- ▲ 8.88%
- Metro
- Rochester, NY
- State GDP YoY
- ▲ 2.60%
- F500 in state
- 92
Industry mix (Fortune 500 HQ in NY)
| Industry | F500 HQs | Revenue |
|---|---|---|
| Financial Services | 10 | $950B |
|
||
| Consumer Goods | 9 | $162B |
|
||
| Insurance | 4 | $225B |
|
||
| Telecommunications | 2 | $144B |
|
||
| Pharmaceuticals | 2 | $112B |
|
||
| Media / Entertainment | 2 | $69B |
|
||
Price history
+114.5% since first listed11 events — show timeline
- 2026-04-20 Listed $134,900 UNYREIS
- 2018-10-22 Pending — UNYREIS
- 2018-10-17 Listing Removed — UNYREIS
- 2018-10-15 Listed $34,900 UNYREIS
- 2016-05-12 Listing Removed — UNYREIS
- 2016-04-22 Listed $49,900 UNYREIS
- 2013-09-09 Listed $34,900 UNYREIS
- 2013-03-05 Listing Removed — UNYREIS
- 2012-07-13 Listing Removed — UNYREIS
- 2012-07-13 Listed $55,900 UNYREIS
- 2012-07-02 Listed $62,900 UNYREIS
Property tax history
+10.8%/yrLatest (2025): $1,049 · +0.0% YoY. Source: county tax records.
Cash-flow waterfall
monthlySold comps — $/sqft
last 12 mo · ≤1 miLoading sold comps…