 Duplex
1801 Read Rd · Picayune, MS
Flood risk 4/10 · Minor
- FEMA flood zone
- AE
- Chance of flooding over 30 yrs
- 0.24%
- Est. flood insurance / yr
- $1,737 – $8,500
Fire risk 5/10 · Moderate
- Est. fire insurance / yr
- $1,241 – $2,305
Heat risk 9/10 · Severe
- Hot days now (above 107°F)
- 7 days/yr
- Hot days in 30 yrs
- 21 days/yr
Wind risk 9/10 · Severe
- Chance of severe wind over 30 yrs
- 99.0%
Air-quality risk 1/10 · Minimal
- Unhealthy air days now
- 0 days/yr
- Unhealthy air days in 30 yrs
- 0 days/yr
Risk factors via First Street. Map © Google.
Why this score? — see what drove the D+ grade
The composite is a weighted blend of 9 inputs, each scored 0–100. Each bar is that input's sub-score; the figure is the points it added to the 100-point composite (weight × sub-score).
- Cash flow +18.3/30.0
- ARV discount +7.5/15.0
- DSCR +5.7/10.0
- 1% rule +5.0/10.0
- Livability +3.8/5.0
- Schools +2.7/10.0
- Rent growth +2.5/5.0
- Condition / age +2.5/5.0
- Appreciation +0.0/10.0
$225,000
🖨 Deal sheet 📄 Offer letter ✓ Due diligence
Multi-family units
County records classify this as Multi-Family (2-4 Unit). Listing-text estimate: 2 units. confirmed
Listing remarks MLS
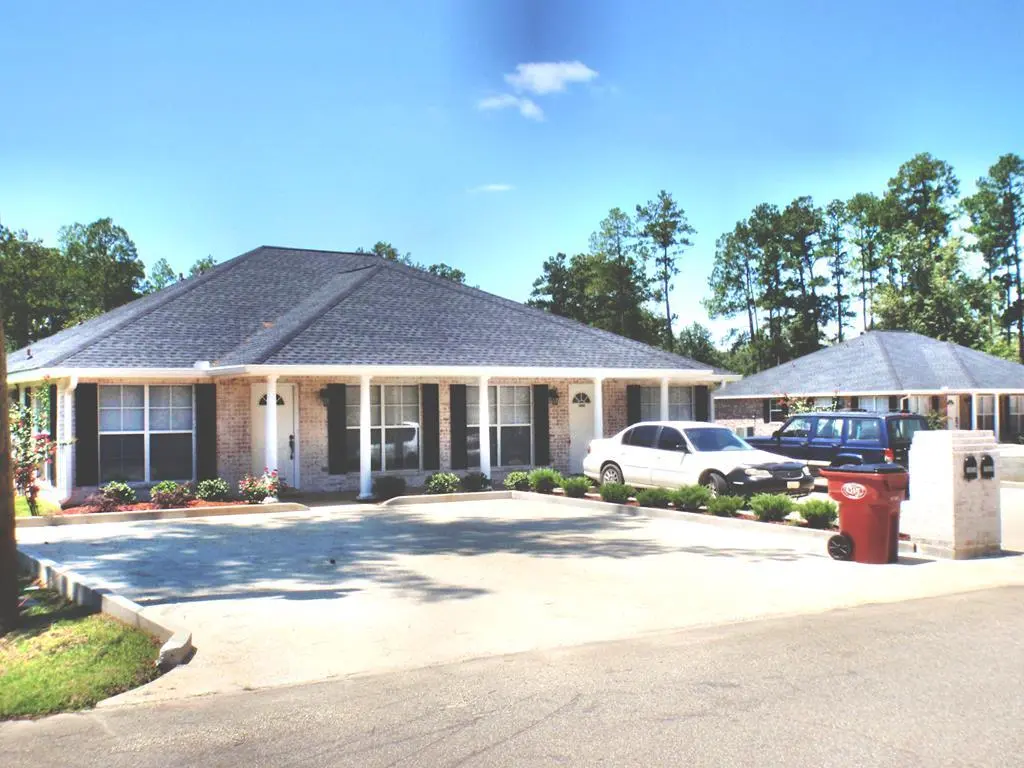
THIS PROPERTY IS BEING SOLD AS PART OF A PORTFOLIO OF MULTIFAMILY DUPLEXES (7 TOTAL) FRONTING READ AND DANIELS ROAD. ALL PROPERTIES ARE QUALITY CONSTRUCTION, BRICK ON SLAB WITH ARCHITECTURAL SHINGLE ROOFING AND CONCRETE DRIVEWAYS. THESE UNITS ENJOY A SOLID OCCUPANCY HISTORY DUE TO THEIR CONVENIENT LOCATION ON DEAD END STREETS AND PROXIMITY TO INTERSTATE. GREAT INVESTMENT FOR INVESTOR LOOKING FOR LOW MAINTENANCE MULTI-FAMILY INVESTMENT. PROPERTY CAN NOT BE PURCHASED INDIVIDUALLY AND CAN ONLY BE PURCHASED AS A GROUP OF 7. PROPERTY IS BROKER OWNED.
Key facts
- 0.27 acre lot
- 6 parking spots
- Built 2009
Neighborhood map
What this means for you Summary
Snapshot
- This is a 2 × 2-bed/1-bath units multifamily listed at $225k.
Deal economics
- At list price, monthly cash flow is $-221 ($-3k/yr) — negative. Per door: $-110/mo.
- To cash-flow at today's rent, offer at most $186k (17.3% below list).
- To meet the 1% rule (rent ≥ 1% of price), the offer needs to be $225k (0.1% below list).
- Recommended offer: $186k (17.3% below list) — sets the bar for cash-flow.
- Cap rate 7.4% vs local median 3.3% in Picayune — top-decile yield for the area; either an underpriced asset or a hidden risk that comps aren't pricing in. Stress-test before assuming the spread holds.
Location & tenants
- Location reads 76/100 on livability (#11 in MS, #3,748 nationally) — a middle-class / working-renter tenant base. Strengths: cost of living A+, health & safety A+, amenities A; Watch: schools C-, commute F, employment F.
- Picayune School District (town): math 31% / reading 34% proficiency, ranked #60 of 130 in MS (top 46%) — families likely to look elsewhere, expect single-tenant / working-renter base with shorter leases; 73% free/reduced lunch — lower-income household profile, screen leases tightly.
- Market conditions: 344 active listings in the ZIP; 326 units permitted in Pearl River County in 2024 (0 in 5+ unit buildings).
Forward outlook
- Local home prices are declining (-3.0%/yr); year-one equity from $2k of loan paydown is wiped out by about $7k of value loss. Plan a longer hold.
- Pearl River County population projected at -19% by 2050 — secular population decline; favor cash flow + early exit over multi-decade hold.
Negotiation context
- It's been on market 197 days — a 12% lower offer ($198k) is reasonable based on typical stale-listing flexibility.
- 2 sale attempts; this cycle's ask has dropped $25k (10%) from the opening price — seller is motivated, your offer sets the floor, not the list.
Risks & watch-outs
- Watch-outs: flood insurance adds $427/mo.
- Climate carrying-cost: in FEMA flood zone AE (mandatory federal flood insurance); severe wind risk, 99% chance of damaging wind over 30y; moderate wildfire risk; extreme-heat days projected 7→21/yr by 2055 (HVAC capex compounding) — expect insurance premiums to compound above CPI over the hold.
Questions for the listing agent
- What do current leases actually rent for vs. the listed asking? Can we see a recent rent roll and the last 12 months of T-12 income?
- It's been on market 197 days. Have you received any prior offers? Is the seller open to a 17% concession, seller financing, or rate buy-down credit?
- Can we see the unit-by-unit rent roll, current vacancy, and any below-market leases? What's the average tenancy length?
- What capital expenditures (roof, boiler, parking lot, exteriors) have been made in the last 5 years, and what's planned in the next 2?
- What's the actual annual flood-insurance premium (NFIP or private), and is the property in a SFHA with mandatory coverage?
- Why hasn't it sold? Are there any deal-killer items the seller is aware of (foundation, flood, title, zoning, code violations)?
- Is there a deadline driving the sale (1031 exchange, divorce, estate, relocation)? That informs how much negotiation room exists.
- The area grade is low — what's the realistic commute time and amenity access for the typical tenant pool here? Any planned neighborhood developments (good or bad) we should know about?
- What's the average days-on-market for RENTAL listings here right now (not sales)? A rising rental-DOM trend means longer vacancies and softer asking-rent achievability than the comps imply.
- What's the recent tenant-quality profile in this submarket — average credit score on applications, eviction rate, late-payment / NSF rate, and stable-employment percentage? A property-management company in the area should have these aggregated.
- How much new apartment / multifamily construction is in the pipeline within 1–3 miles? Heavy new supply (>2% of stock underway) typically softens rents 12–24 months out; light construction supports rent growth.
Investment metrics
- 1% rule
- 1.00% ✗
- Cap rate
- 7.39%
- Cash-on-cash
- 3.92%
- DSCR
- 1.17
- GRM
- 8.3
CMA / ARV
- ARV (median comp)
- $475,553
- List price
- $225,000
- Delta
- -52.69%
- Verdict
- UNDERPRICED
- Comps
- 1 within 2.0 mi
Projected returns pro-forma
-3.0% appreciation · 3.0% rent growth · sell at horizon
- IRR
- -23.2%
- Equity multiple
- 0.20×
- Total profit
- $-50,217
- Equity at exit
- $33,548
- IRR
- -17.4%
- Equity multiple
- 0.04×
- Total profit
- $-60,595
- Equity at exit
- $19,454
Cash invested: $63,000 (down + closing). Projections, not guarantees.
Landlord ↔ Tenant lean methodology
- Overall (STATE)
- 90 Strongly Landlord-Friendly
- State Mississippi
- 90 Strongly Landlord-Friendly · R+11
- County
- — inherits STATE
- City
- — inherits STATE
ZIP-level market 39466
- Home prices YoY
- -26.3%
- Active inventory
- 344
- Price-to-rent
- 16.7×
Monthly cashflow live
- Estimated rent
- $2,248 medium interval (Pro) →
- Mortgage (P&I)
- −$1,180
- Tax from tax record
- −$296 /mo · $3,558/yr
- Insurance
- −$94
- Flood insurance flood zone
- −$427 /mo · $5,118/yr
- HOA
- −$0
- Vacancy / Maint / Mgmt
- −$472
- Net cashflow
- $-221
Break-even live
2-unit breakdown (identical units grouped — click to expand)
| Units | Beds | Baths | Est. rent |
|---|---|---|---|
| 2× units | 2 | 1 | $2,248 |
| #1 | 2 | 1 | $1,124 |
| #2 | 2 | 1 | $1,124 |
| Total (2 units) | $2,248 | ||
UW: 25.0% down · 7.5% · 30yr · 1.5% tax · 5.0% vac · 8.0% maint · 8.0% mgmt
Financing live
Cash to close
- Down payment
- $56,250
- Closing costs
- $6,750
- Reserves months
- —
- Total cash needed
- —
Loan-product check · same deal, 3 products live
Conventional
25% down · 7.5% · 30yr
- Down + closing
- —
- Monthly P&I
- —
- Monthly cashflow
- —
- DSCR
- —
- Eligible?
- —
Personal DTI + credit; lowest rate.
DSCR
20% down · 8.5% · 30yr
- Down + closing
- —
- Monthly P&I
- —
- Monthly cashflow
- —
- DSCR
- —
- Eligible?
- —
No personal income docs; deal must DSCR.
Hard money
10% down · 12.0% · 12mo
- Down + closing
- —
- Monthly P&I
- —
- Monthly cashflow
- —
- DSCR
- —
- Eligible?
- —
Short-term bridge; refi at stabilization.
Listing history 17 events
-
2026-06-18days on market $225,000 Active 197 DOM
-
2026-06-17days on market $225,000 Active 196 DOM
-
2026-06-16days on market $225,000 Active 195 DOM
-
2026-06-15days on market $225,000 Active 194 DOM
-
2026-06-13days on market $225,000 Active 192 DOM
-
2026-06-12days on market $225,000 Active 191 DOM
-
2026-06-09days on market $225,000 Active 188 DOM
-
2026-06-08days on market $225,000 Active 187 DOM
-
2026-06-07days on market $225,000 Active 186 DOM
-
2026-06-07days on market $225,000 Active 185 DOM
-
2026-06-04days on market $225,000 Active 182 DOM
-
2026-06-03days on market $225,000 Active 181 DOM
-
2026-06-01days on market $225,000 Active 180 DOM
-
2026-05-31days on market $225,000 Active 179 DOM
-
2026-04-15status Active 552-char remark
Show marketing remark (552 chars)
THIS PROPERTY IS BEING SOLD AS PART OF A PORTFOLIO OF MULTIFAMILY DUPLEXES (7 TOTAL) FRONTING READ AND DANIELS ROAD. ALL PROPERTIES ARE QUALITY CONSTRUCTION, BRICK ON SLAB WITH ARCHITECTURAL SHINGLE ROOFING AND CONCRETE DRIVEWAYS. THESE UNITS ENJOY A SOLID OCCUPANCY HISTORY DUE TO THEIR CONVENIENT LOCATION ON DEAD END STREETS AND PROXIMITY TO INTERSTATE. GREAT INVESTMENT FOR INVESTOR LOOKING FOR LOW MAINTENANCE MULTI-FAMILY INVESTMENT. PROPERTY CAN NOT BE PURCHASED INDIVIDUALLY AND CAN ONLY BE PURCHASED AS A GROUP OF 7. PROPERTY IS BROKER OWNED.
-
2026-04-15price $225,000 552-char remark
Show marketing remark (552 chars)
THIS PROPERTY IS BEING SOLD AS PART OF A PORTFOLIO OF MULTIFAMILY DUPLEXES (7 TOTAL) FRONTING READ AND DANIELS ROAD. ALL PROPERTIES ARE QUALITY CONSTRUCTION, BRICK ON SLAB WITH ARCHITECTURAL SHINGLE ROOFING AND CONCRETE DRIVEWAYS. THESE UNITS ENJOY A SOLID OCCUPANCY HISTORY DUE TO THEIR CONVENIENT LOCATION ON DEAD END STREETS AND PROXIMITY TO INTERSTATE. GREAT INVESTMENT FOR INVESTOR LOOKING FOR LOW MAINTENANCE MULTI-FAMILY INVESTMENT. PROPERTY CAN NOT BE PURCHASED INDIVIDUALLY AND CAN ONLY BE PURCHASED AS A GROUP OF 7. PROPERTY IS BROKER OWNED.
-
2025-03-10$250,000 Active 552-char remark
Show marketing remark (552 chars)
THIS PROPERTY IS BEING SOLD AS PART OF A PORTFOLIO OF MULTIFAMILY DUPLEXES (7 TOTAL) FRONTING READ AND DANIELS ROAD. ALL PROPERTIES ARE QUALITY CONSTRUCTION, BRICK ON SLAB WITH ARCHITECTURAL SHINGLE ROOFING AND CONCRETE DRIVEWAYS. THESE UNITS ENJOY A SOLID OCCUPANCY HISTORY DUE TO THEIR CONVENIENT LOCATION ON DEAD END STREETS AND PROXIMITY TO INTERSTATE. GREAT INVESTMENT FOR INVESTOR LOOKING FOR LOW MAINTENANCE MULTI-FAMILY INVESTMENT. PROPERTY CAN NOT BE PURCHASED INDIVIDUALLY AND CAN ONLY BE PURCHASED AS A GROUP OF 7. PROPERTY IS BROKER OWNED.
ⓘ Source: listings_history table (triggers on properties + properties_extension) + one-shot
backfill from property_details.listing_events for pre-trigger history.
Tax reassessment forecast MS · Resets to sale price
- Current annual tax
- $3,558 · $296/mo
- Projected year-2 tax
- $3,558 · $296/mo
- Expected delta
- $0/yr ($0/mo · 0.0%)
ⓘ Screening estimate from a state-policy table — verify with the county assessor before closing.
Climate risk First Street
- Flood 4/10 Moderate FEMA zone AE · 24% chance over 30 yrs
- Wildfire 5/10 Major
- Heat 9/10 Extreme 7 d/yr ≥107°F today · 21 d/yr by 30 yrs out
- Wind 9/10 Extreme 99% chance of damaging wind over 30 yrs
- Air quality 1/10 Low 0 unhealthy d/yr today · 0 by 30 yrs out
Nearby sold comps map
Loading sold comps map…
Walkable amenities ~0.75 mi
Loading nearby amenities…
Taxation est. · year 1
- Rental income
- $26,976
- − Mortgage interest
- −$12,603
- − Property taxes
- −$3,558
- − Insurance
- −$6,244
- − Repairs & maintenance
- −$2,158
- − Management
- −$2,158
- − Depreciation
- −$6,545
- Taxable loss
- −$6,291
- Est. tax savings @ 24.0%
- +$1,510
- After-tax cash flow
- $-1,140/yr
For passive investors: Depreciation is non-cash, so a rental often shows a tax loss while cash-flowing — sheltering income. Rental losses are passive: they offset passive income freely, and up to $25,000/yr can offset ordinary (W-2) income if you actively participate and your MAGI is under $100k (phasing out to $0 by $150k); unused losses carry forward. On sale, claimed depreciation is recaptured at up to 25%, and gains may owe capital-gains tax (a 1031 exchange can defer both). Figures are a year-1 estimate at your 24.0% rate — not tax advice; consult a CPA.
Schools (NCES district)
- District
- Picayune School District
- NCES district ID
- 2803630
- Math proficiency
- 31% ▼ -12.00%
- Reading proficiency
- 34% ▼ -9.00%
- Median HH income
- $38,446
- Composite
- 27.17/100
- National rank
- #7025
- State rank
- #60 of 130 in MS
Livability — Picayune
- Score
- 76/100
- State rank
- #11
- US rank
- #3748
Category grades
Schools grade is shown separately in the Schools card above.
Census & demographics
- Census place
- Picayune, MS
- Population (ZIP)
- 28,292
Population outlook (Pearl River County) Hauer SSP2
- Today (2025)
- 53,426 people
- By 2030
- 51,663 · -3.3%
- By 2040
- 47,611 · -10.9%
- By 2050
- 43,286 · -19.0%
- By 2075
- 32,859 · -38.5%
- By 2100
- 22,476 · -57.9%
Race, ethnicity, and origin ACS 2023
- Neighborhood character
- Predominantly White (72%)
- Race & ethnicity
- White 72% Black 18% Two or more races 6% Hispanic / Latino 6%
- Hispanic origin (detail)
- Mexican 1%
- Common ancestry
- Lithuanian 9% Iranian 1% Slovak 1%
- Foreign-born
- 2% · Canada
- Languages at home
- 96% English-only · Spanish 3%
Political lean MEDSL · Pearl River
- 2024 margin
- Solid R (+66.7) · D 16.1% · R 82.8% · Other 1.0%
- 2008→2024 swing
- -6.3pp toward R · 2008: -60.4pp · 2024: -66.7pp
- All cycles
- 2024: R+66.7 2020: R+64.2 2016: R+66.8 2012: R+60.3 2008: R+60.4
Not yet ingested
- Civics
- —
Market trends
- HPI YoY
- ▼ -69.32%
- Current HPI
- 194.6541
- Rent YoY
- —
- Metro
- —
- State GDP YoY
- —
- F500 in state
- 0
Price history
-10.0% since first listed3 events — show timeline
- 2026-04-15 Relisted — PRCBOR
- 2026-04-15 Price Changed $225,000 PRCBOR
- 2025-03-10 Listed $250,000 PRCBOR
Property tax history
+4.2%/yrLatest (2025): $3,558 · +5.9% YoY. Source: county tax records.
Cash-flow waterfall
monthlySold comps — $/sqft
last 12 mo · ≤1 miLoading sold comps…