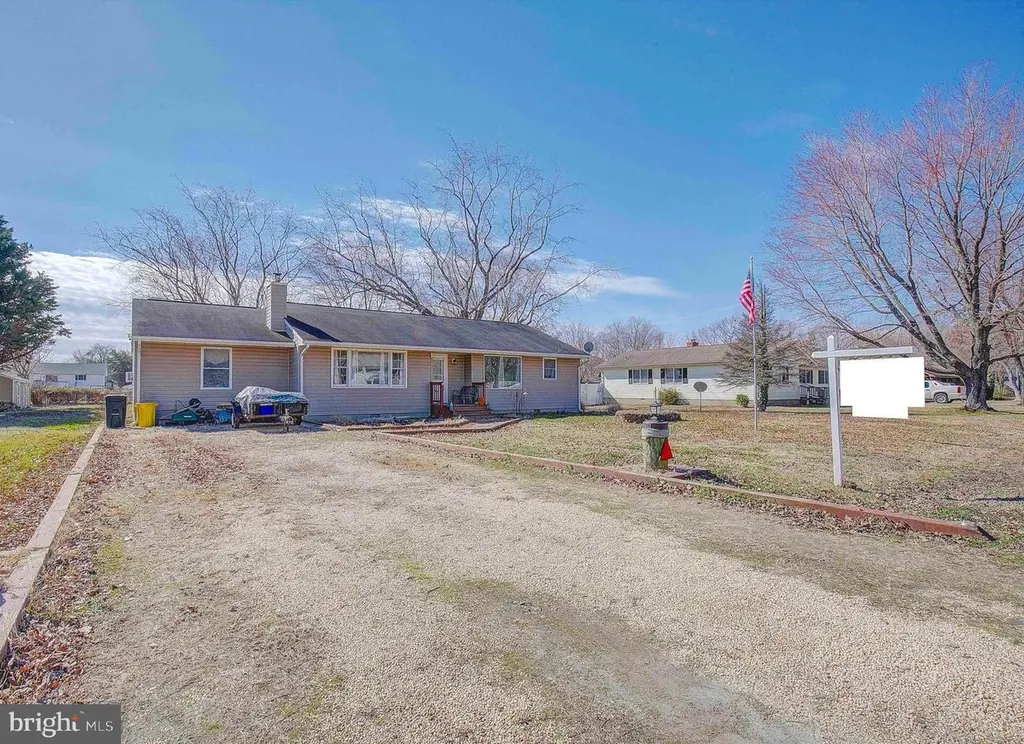
317 Virginia Rd · Romancoke, MD
Flood risk 3/10 · Minor
- FEMA flood zone
- X (unshaded)
- Chance of flooding over 30 yrs
- 0.09%
- Est. flood insurance / yr
- $507 – $1,088
Fire risk 2/10 · Minimal
- Est. fire insurance / yr
- $755 – $1,403
Heat risk 9/10 · Severe
- Hot days now (above 104°F)
- 7 days/yr
- Hot days in 30 yrs
- 15 days/yr
Wind risk 7/10 · Major
- Chance of severe wind over 30 yrs
- 77.0%
Air-quality risk 3/10 · Minor
- Unhealthy air days now
- 3 days/yr
- Unhealthy air days in 30 yrs
- 3 days/yr
Risk factors via First Street. Map © Google.
Why this score? — see what drove the C+ grade
The composite is a weighted blend of 9 inputs, each scored 0–100. Each bar is that input's sub-score; the figure is the points it added to the 100-point composite (weight × sub-score).
- Cash flow +22.4/30.0
- ARV discount +15.0/15.0
- DSCR +7.2/10.0
- 1% rule +5.2/10.0
- Schools +3.0/10.0
- Rent growth +2.5/5.0
- Livability +2.5/5.0
- Condition / age +2.5/5.0
- Appreciation +0.0/10.0
$349,000
🖨 Deal sheet 📄 Offer letter ✓ Due diligence
Listing remarks MLS
Charming 3 Bedroom/2 Full Bath Rancher in Water Privileged Community. Huge Beautiful Yard W/ Large Deck, Great for Cook Outs! Plenty of Room for Parking/Large Driveway; Beautiful Hardwood Floors; Close to Community Beach, Romancoke Pier, Kent Island Trail and Kentmoor Restaurant. Home is over 1700 Sq Ft on a Double Lot. Great for Entertaining.
Key facts
- 0.5 acre lot
- Built 1974
- Listed 12 days
Property features AI
Finance
- Other: Ownership: Fee simple
- HOA & community: HOA fee $25 annually
Exterior
- Parking: Driveway; On-street parking
- Utilities: Electric hot water; Septic system; Well water; Electric cooling fuel; Electric heating fuel
- Home design: Detached property; Estimated year built
- Construction: Vinyl siding; Crawl space foundation; Above grade and below grade structures noted
- Exterior features: Front yard; Rear yard; Not in a federal flood zone
Interior
- Kitchen: Built-in microwave; Dishwasher; Disposal; Stove; Refrigerator
- Bedrooms: 3 bedrooms on main level
- Flooring: Hardwood; Carpet; Wood floors
- Bathrooms: 2 full bathrooms on main level; 2 full bathrooms total
- Heating & cooling: Baseboard electric heat; Wood-burning stove; Ceiling fan(s); Window unit(s)
- Interior features: Dining area; Ceiling fan(s); Carpet; Wood floors; Wood stove; Has fireplace (1)
- Laundry & utility: Washer; Dryer
Neighborhood map
What this means for you Summary
Snapshot
- This is a 3-bed/2.0-bath single-family listed at $349k.
Deal economics
- At list price, monthly cash flow is $580 ($7k/yr) — positive.
- The deal already cash-flows at list — no discount required.
- Meets the 1% rule at list price ($4k rent vs $349k).
- Cap rate 8.3% vs local median 3.7% in Romancoke — top-decile yield for the area; either an underpriced asset or a hidden risk that comps aren't pricing in. Stress-test before assuming the spread holds.
Location & tenants
- Location reads: area grade C — affects rentability + tenant quality, not the cash-flow math above.
- Queen Anne'S County Public Schools (rural): math 22% / reading 39% proficiency, ranked #7 of 24 in MD (top 29%) — families likely to look elsewhere, expect single-tenant / working-renter base with shorter leases.
- Zoned schools: Kent Island High School (math 63% / reading 68%, grade B, #54 of 222 statewide, top 24%, 1,164 students, 29% FRL).
- Zoned-school proficiency averages 66% at this address vs 30% district-wide (+35 pts) — the actual schools serving this property are materially stronger than the Queen Anne'S County Public Schools average implies; a family-tenant draw the district grade alone would hide.
- Market conditions: 136 active listings in the ZIP; 3 comparable units currently listed for rent nearby; rentals at typical pace (median 16d on market — plan ~3-4 weeks tenant-placement turnaround); 320 units permitted in Queen Anne's County in 2024 (56 in 5+ unit buildings).
Forward outlook
- Local home prices are declining (-3.0%/yr); year-one equity from $2k of loan paydown is wiped out by about $10k of value loss. Plan a longer hold.
Negotiation context
- Only 12 days on market — expect competitive offers; lowballing is unlikely to land.
- 6 sale attempts since 12y ago with the ask held roughly flat each time — persistent listings suggest the price (not the market) is what's stuck; bring a comps-based counter.
- Current owner paid $285k; 22% above their basis — modest negotiation headroom, anchor on the comps not their cost.
Risks & watch-outs
- Climate carrying-cost: major wind risk, 77% chance of damaging wind over 30y; extreme-heat days projected 7→15/yr by 2055 (HVAC capex compounding) — expect insurance premiums to compound above CPI over the hold.
Questions for the listing agent
- Built in 1974 — when were the roof, HVAC, electrical panel, plumbing, and water heater last replaced?
- What does the HOA fee cover, when was the last increase, and are there any pending special assessments or reserve-fund shortfalls?
- Is there a deadline driving the sale (1031 exchange, divorce, estate, relocation)? That informs how much negotiation room exists.
- What's the average days-on-market for RENTAL listings here right now (not sales)? A rising rental-DOM trend means longer vacancies and softer asking-rent achievability than the comps imply.
- What's the recent tenant-quality profile in this submarket — average credit score on applications, eviction rate, late-payment / NSF rate, and stable-employment percentage? A property-management company in the area should have these aggregated.
- How much new for-sale + rental construction is in the pipeline within 1–3 miles? Heavy new supply typically softens prices + rents 12–24 months out; constrained supply supports both.
Investment metrics
- 1% rule
- 1.02% ✓
- Cap rate
- 8.29%
- Cash-on-cash
- 7.12%
- DSCR
- 1.32
- GRM
- 8.2
CMA / ARV
- ARV (on-the-fly)
- $542,592
- Comps found
- 10
Show comp detail 10 sales within ~0.75 mi
| Address | Dist | Beds/Ba | Sqft | Sold | Price | $/sf | Match |
|---|---|---|---|---|---|---|---|
| 713 Bay Dr | 0.17mi | 3/2.0 | 1,784 (+3%) | 9mo | $560,000 | $314 | 79 |
| 325 South Carolina Rd | 0.24mi | 3/3.0 | 1,608 (-7%) | 8mo | $477,000 | $297 | 67 |
| 116 Tennessee Rd | 0.47mi | 3/2.0 | 1,654 (-4%) | 15mo | $567,000 | $343 | 58 |
| 329 Utah Rd | 0.11mi | 4/2.5 (+1) | 1,896 (+10%) | 21mo | $535,000 | $282 | 54 |
| 118 Virginia Rd | 0.42mi | 3/2.5 | 1,592 (-8%) | 15mo | $485,000 | $305 | 53 |
| 109 South Carolina Rd | 0.52mi | 3/1.5 | 1,624 (-6%) | 18mo | $455,000 | $280 | 49 |
| 123 New Jersey Rd | 0.55mi | 3/2.0 | 1,519 (-12%) | 9mo | $480,000 | $316 | 47 |
| 127 Wicomico Rd | 0.74mi | 3/2.0 | 1,700 (-2%) | 19mo | $539,900 | $318 | 47 |
| 116 N Lake Dr | 0.68mi | 4/3.0 (+1) | 1,718 (-1%) | 19mo | $675,000 | $393 | 42 |
| 8004 Romancoke Rd | 0.64mi | 4/2.0 (+1) | 1,944 (+12%) | 17mo | $475,000 | $244 | 30 |
Match score weights: distance 35% · size 25% · config 20% · recency 20%. Top-matched comps best support the ARV.
Projected returns pro-forma
-3.0% appreciation · 3.0% rent growth · sell at horizon
- IRR
- -5.4%
- Equity multiple
- 0.80×
- Total profit
- $-19,675
- Equity at exit
- $52,037
- IRR
- 4.2%
- Equity multiple
- 1.31×
- Total profit
- $30,189
- Equity at exit
- $30,175
Cash invested: $97,720 (down + closing). Projections, not guarantees.
Landlord ↔ Tenant lean methodology
- Overall (STATE)
- 27 Tenant-Leaning
- State Maryland
- 27 Tenant-Leaning · D+14
- County
- — inherits STATE
- City
- — inherits STATE
ZIP-level market 21666
- Active inventory
- 136
- Price-to-rent
- 8.2×
Monthly cashflow live
- Estimated rent
- $3,554 medium interval (Pro) →
- Mortgage (P&I)
- −$1,830
- Tax from tax record
- −$250 /mo · $3,001/yr
- Insurance
- −$145
- HOA
- −$2
- Vacancy / Maint / Mgmt
- −$746
- Net cashflow
- $580
Break-even live
UW: 25.0% down · 7.5% · 30yr · 1.5% tax · 5.0% vac · 8.0% maint · 8.0% mgmt
Financing live
Cash to close
- Down payment
- $87,250
- Closing costs
- $10,470
- Reserves months
- —
- Total cash needed
- —
Loan-product check · same deal, 3 products live
Conventional
25% down · 7.5% · 30yr
- Down + closing
- —
- Monthly P&I
- —
- Monthly cashflow
- —
- DSCR
- —
- Eligible?
- —
Personal DTI + credit; lowest rate.
DSCR
20% down · 8.5% · 30yr
- Down + closing
- —
- Monthly P&I
- —
- Monthly cashflow
- —
- DSCR
- —
- Eligible?
- —
No personal income docs; deal must DSCR.
Hard money
10% down · 12.0% · 12mo
- Down + closing
- —
- Monthly P&I
- —
- Monthly cashflow
- —
- DSCR
- —
- Eligible?
- —
Short-term bridge; refi at stabilization.
Rent comps 3 comps
| Address | Beds | Baths | Sqft | Rent | $/sqft | DOM | Units | Dist |
|---|---|---|---|---|---|---|---|---|
| 105 King George Ct Stevensville, MD | 4.0 | 3.0 | 1996 | $4,400 | $2.20 | 16d | 1 | 0.99mi |
| 301 Wicomico Rd Stevensville, MD | 3.0 | 1.0 | 1052 | $2,400 | $2.28 | 4d | 1 | 1.00mi |
| 211 Queen Anne Rd Stevensville, MD | 3.0 | 2.5 | 1967 | $3,500 | $1.78 | 23d | 1 | 1.36mi |
HOA detail
- Monthly dues
- $2 · $24/yr
- Likely covers
- water
Listing history 8 events
-
2026-06-18status $349,000 Pending 12 DOM
-
2026-06-17days on market $349,000 Active 12 DOM
-
2026-06-16days on market $349,000 Active 11 DOM
-
2026-06-15days on market $349,000 Active 10 DOM
-
2026-06-13days on market $349,000 Active 8 DOM
-
2026-06-09days on market $349,000 Active 4 DOM
-
2026-06-08days on market $349,000 Active 3 DOM
-
2026-06-07$349,000 Active 2 DOM
ⓘ Source: listings_history table (triggers on properties + properties_extension) + one-shot
backfill from property_details.listing_events for pre-trigger history.
Tax reassessment forecast MD · Partial reset (capped growth)
- Current annual tax
- $3,001 · $250/mo
- Projected year-2 tax
- $3,403 · $284/mo
- Expected delta
- +$402/yr (+$33/mo · 13.4%)
ⓘ Screening estimate from a state-policy table — verify with the county assessor before closing.
Climate risk First Street
- Flood 3/10 Moderate FEMA zone X (unshaded) · 9% chance over 30 yrs
- Wildfire 2/10 Low
- Heat 9/10 Extreme 7 d/yr ≥104°F today · 15 d/yr by 30 yrs out
- Wind 7/10 Severe 77% chance of damaging wind over 30 yrs
- Air quality 3/10 Moderate 3 unhealthy d/yr today · 3 by 30 yrs out
Nearby sold comps map
Loading sold comps map…
Walkable amenities ~0.75 mi
Loading nearby amenities…
Taxation est. · year 1
- Rental income
- $42,648
- − Mortgage interest
- −$19,549
- − Property taxes
- −$3,001
- − Insurance
- −$1,745
- − Repairs & maintenance
- −$3,412
- − Management
- −$3,412
- − HOA
- −$24
- − Depreciation
- −$10,153
- Taxable income
- $1,352
- Est. tax owed @ 24.0%
- −$324
- After-tax cash flow
- $6,635/yr
For passive investors: Depreciation is non-cash, so a rental often shows a tax loss while cash-flowing — sheltering income. Rental losses are passive: they offset passive income freely, and up to $25,000/yr can offset ordinary (W-2) income if you actively participate and your MAGI is under $100k (phasing out to $0 by $150k); unused losses carry forward. On sale, claimed depreciation is recaptured at up to 25%, and gains may owe capital-gains tax (a 1031 exchange can defer both). Figures are a year-1 estimate at your 24.0% rate — not tax advice; consult a CPA.
Schools (NCES district)
- District
- Queen Anne'S County Public Schools
- NCES district ID
- 2400540
- Math proficiency
- 22% ▼ -30.00%
- Reading proficiency
- 39% ▼ -22.00%
- Median HH income
- $84,577
- Composite
- 29.86/100
- National rank
- #6406
- State rank
- #7 of 24 in MD
Livability — Romancoke
No livability data for this city. (Only ~50 U.S. cities are tracked.)
Census & demographics
- Census place
- Romancoke, MD
- Population (ZIP)
- 14,205
Population outlook (Queen Anne's County) Hauer SSP2
- Today (2025)
- 51,149 people
- By 2030
- 51,979 · +1.6%
- By 2040
- 52,728 · +3.1%
- By 2050
- 51,828 · +1.3%
- By 2075
- 50,169 · -1.9%
- By 2100
- 44,442 · -13.1%
Race, ethnicity, and origin ACS 2023
- Neighborhood character
- Predominantly White (88%)
- Race & ethnicity
- White 88% Two or more races 5% Black 4% Hispanic / Latino 2% Asian 2%
- Common ancestry
- Romanian 6% Slovak 2% Subsaharan African 2%
- Foreign-born
- 3% · Canada, China
- Languages at home
- 97% English-only · Spanish 1%
Political lean MEDSL · Queen Anne's
- 2024 margin
- Strong R (+27.8) · D 35.1% · R 62.9% · Other 2.1%
- 2008→2024 swing
- -0.7pp no change · 2008: -27.1pp · 2024: -27.8pp
- All cycles
- 2024: R+27.8 2020: R+26.5 2016: R+36.1 2012: R+30.1 2008: R+27.1
Not yet ingested
- Civics
- —
Market trends
- HPI YoY
- ▼ -157.11%
- Current HPI
- 239.1989
- Rent YoY
- —
- Metro
- —
- State GDP YoY
- ▲ 2.97%
- F500 in state
- 12
Industry mix (Fortune 500 HQ in MD)
| Industry | F500 HQs | Revenue |
|---|---|---|
| Aerospace / Defense | 1 | $71B |
|
||
| Utilities | 1 | $25B |
|
||
| Hotels | 1 | $24B |
|
||
| Consumer Goods | 1 | $7B |
|
||
| Real Estate | 1 | $6B |
|
||
| Chemicals | 1 | $2B |
|
||
Price history
+417.8% since first listed22 events — show timeline
- 2026-06-05 Listed $349,000 BRIGHT MLS
- 2022-04-19 Sold (Public Records) $285,000 Public Records
- 2022-04-13 Sold (MLS) $285,000 BRIGHT MLS
- 2022-03-13 Pending — BRIGHT MLS
- 2022-03-10 Price Changed $295,000 BRIGHT MLS
- 2022-03-08 Listed $325,000 BRIGHT MLS
- 2015-09-24 Sold (MLS) $234,500 BRIGHT MLS
- 2015-09-24 Sold (MLS) $234,500 MRIS
- 2015-08-27 Pending — MRIS
- 2015-07-06 Listed $234,500 MRIS
- 2015-06-02 Delisted — MRIS
- 2015-06-02 Listing Removed — BRIGHT MLS
- 2015-05-05 Price Changed — MRIS
- 2015-03-10 Price Changed — MRIS
- 2014-07-10 Price Changed — MRIS
- 2014-05-19 Relisted — MRIS
- 2014-05-10 Delisted — MRIS
- 2014-05-08 Listed — MRIS
- 2014-05-08 Listed $239,500 BRIGHT MLS
- 2000-09-27 Sold (Public Records) $122,000 Public Records
- 1993-06-22 Sold (Public Records) $106,000 Public Records
- 1984-06-29 Sold (Public Records) $67,400 Public Records
Property tax history
+3.8%/yrLatest (2025): $3,001 · +7.9% YoY. Source: county tax records.
Cash-flow waterfall
monthlySold comps — $/sqft
last 12 mo · ≤1 miLoading sold comps…