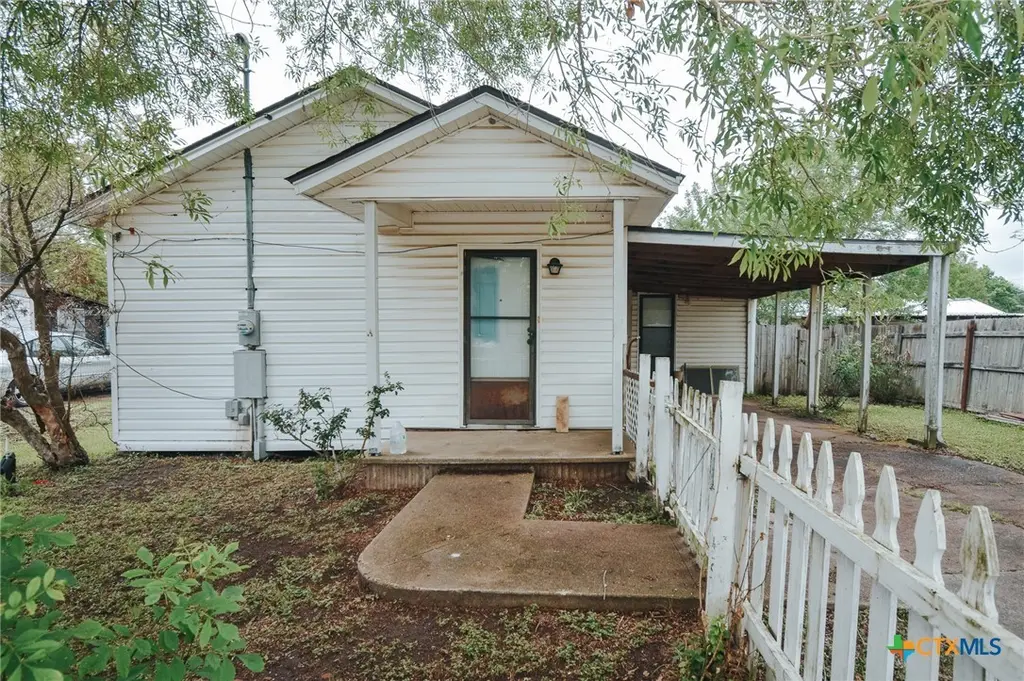
113 Barbara St · Victoria, TX
Flood risk 1/10 · Minimal
- FEMA flood zone
- X
- Chance of flooding over 30 yrs
- 0.0%
- Est. flood insurance / yr
- $507 – $1,088
Fire risk 5/10 · Moderate
- Est. fire insurance / yr
- $1,222 – $2,270
Heat risk 9/10 · Severe
- Hot days now (above 111°F)
- 7 days/yr
- Hot days in 30 yrs
- 21 days/yr
Wind risk 9/10 · Severe
- Chance of severe wind over 30 yrs
- 99.0%
Air-quality risk 1/10 · Minimal
- Unhealthy air days now
- 0 days/yr
- Unhealthy air days in 30 yrs
- 0 days/yr
Risk factors via First Street. Map © Google.
Why this score? — see what drove the B+ grade
The composite is a weighted blend of 9 inputs, each scored 0–100. Each bar is that input's sub-score; the figure is the points it added to the 100-point composite (weight × sub-score).
- Cash flow +30.0/30.0
- ARV discount +15.0/15.0
- 1% rule +10.0/10.0
- DSCR +10.0/10.0
- Livability +3.6/5.0
- Schools +2.5/10.0
- Condition / age +2.5/5.0
- Rent growth +2.3/5.0
- Appreciation +0.0/10.0
$79,500
🖨 Deal sheet 📄 Offer letter ✓ Due diligence
Listing remarks
Located on a quiet street directly across from the Victoria Sports Complex, 113 Barbara is a 2 bedroom, 1 bathroom home ideal for investors or buyers ready to add their personal touch. The property features a functional layout, a carport, and a spacious fenced-in backyard with plenty of potential. Renovations have already been started with new flooring and some initial updates, providing a solid head start. With the groundwork underway, this home is ready to be finished out and transformed into a strong investment or personal project.
Key facts
- Quiet street
- New flooring
- Carport
Tags
Property features AI
Finance
- HOA & community: Curbs
Exterior
- Parking: Has carport with 1 carport space
- Utilities: Natural gas available; Public water; Public sewer
- Home design: Single-story; Resale property
- Construction: Frame construction with wood siding; Composition/shingle roof; Pillar/post/pier foundation; Built (year source: assessor)
- Exterior features: Patio; Storage; Partial picket wood fencing; Mature trees; City lot; Less than quarter acre; City street frontage
Interior
- Kitchen: Electric range; Range; Microwave
- Bedrooms: Other (room type listed)
- Flooring: Laminate
- Bathrooms: 1 full bathroom
- Heating & cooling: Wall/window unit(s) for cooling
- Interior features: Ceiling fan(s); Separate shower; Shower only; Laminate flooring; Exhaust fan
- Laundry & utility: Washer hookup; Electric dryer hookup; Gas water heater; Water heater
Neighborhood map
What this means for you Summary
Snapshot
- This is a 3-bed/1.0-bath single-family listed at $80k.
Deal economics
- At list price, monthly cash flow is $518 ($6k/yr) — positive.
- The deal already cash-flows at list — no discount required.
- Meets the 1% rule at list price ($1k rent vs $80k).
- Cap rate 14.1% vs local median 3.7% in Victoria — top-decile yield for the area; either an underpriced asset or a hidden risk that comps aren't pricing in. Stress-test before assuming the spread holds.
Location & tenants
- Location reads 71/100 on livability (#309 in TX) — a middle-class / working-renter tenant base. Strengths: cost of living A+, housing A+, health & safety A+; Watch: crime D+, schools D, amenities F.
- Victoria ISD (urban): math 24% / reading 33% proficiency, ranked #645 of 826 in TX (top 78%) — low school quality limits family demand, transient renter base, plan for 1-2y turnover.
- Market conditions: Rents soft (-0.8%/yr); 196 active listings in the ZIP; 43 units permitted in Victoria County in 2024 (0 in 5+ unit buildings).
Forward outlook
- Local home prices are declining (-3.0%/yr); year-one equity from $550 of loan paydown is wiped out by about $2k of value loss. Plan a longer hold.
- Victoria County population projected at +34% by 2050 — long-run rental-demand tailwind backs the buy-and-hold thesis.
- At projected returns (-3.0% appreciation + 0.0% rent growth), your $22k cash investment doubles in ~5 years — after that, you're playing with house money.
Negotiation context
- Only 4 days on market — expect competitive offers; lowballing is unlikely to land.
- 2 sale attempts with the ask held roughly flat each time — persistent listings suggest the price (not the market) is what's stuck; bring a comps-based counter.
Risks & watch-outs
- Watch-outs: built in 1954 — expect roof / HVAC / electrical / plumbing capex.
- Climate carrying-cost: severe wind risk, 99% chance of damaging wind over 30y; moderate wildfire risk; extreme-heat days projected 7→21/yr by 2055 (HVAC capex compounding) — expect insurance premiums to compound above CPI over the hold.
Questions for the listing agent
- Built in 1954 — when were the roof, HVAC, electrical panel, plumbing, and water heater last replaced?
- Is there a deadline driving the sale (1031 exchange, divorce, estate, relocation)? That informs how much negotiation room exists.
- Schools are D-rated, which usually means shorter tenancies and higher turnover. Who's the typical renter profile here, and what's been the actual vacancy rate?
- Crime grade is D in this area — have there been break-ins, vandalism, or insurance claims at this property in the last 3 years? What carrier currently insures it and at what premium?
- What's the average days-on-market for RENTAL listings here right now (not sales)? A rising rental-DOM trend means longer vacancies and softer asking-rent achievability than the comps imply.
- What's the recent tenant-quality profile in this submarket — average credit score on applications, eviction rate, late-payment / NSF rate, and stable-employment percentage? A property-management company in the area should have these aggregated.
- How much new for-sale + rental construction is in the pipeline within 1–3 miles? Heavy new supply typically softens prices + rents 12–24 months out; constrained supply supports both.
Investment metrics
- 1% rule
- 1.70% ✓
- Cap rate
- 14.12%
- Cash-on-cash
- 27.94%
- DSCR
- 2.24
- GRM
- 4.9
CMA / ARV
- ARV (median comp)
- $130,148
- List price
- $79,500
- Delta
- -35.15%
- Verdict
- UNDERPRICED
- Comps
- 7 within 1.0 mi
Show comp detail 1 sale within ~0.75 mi
| Address | Dist | Beds/Ba | Sqft | Sold | Price | $/sf | Match |
|---|---|---|---|---|---|---|---|
| 3105 Gayle St | 0.43mi | 3/2.0 | 855 (-8%) | 4mo | $165,000 | $193 | 59 |
Match score weights: distance 35% · size 25% · config 20% · recency 20%. Top-matched comps best support the ARV.
Projected returns pro-forma
-3.0% appreciation · 0.0% rent growth · sell at horizon
- IRR
- 18.6%
- Equity multiple
- 1.73×
- Total profit
- $16,175
- Equity at exit
- $11,854
- IRR
- 24.8%
- Equity multiple
- 2.86×
- Total profit
- $41,331
- Equity at exit
- $6,874
Cash invested: $22,260 (down + closing). Projections, not guarantees.
Landlord ↔ Tenant lean methodology
- Overall (STATE)
- 87 Strongly Landlord-Friendly
- State Texas
- 87 Strongly Landlord-Friendly · R+5
- County
- — inherits STATE
- City
- — inherits STATE
ZIP-level market 77901
- Rents YoY
- -0.8%
- Active inventory
- 196
- Price-to-rent
- 4.9×
Monthly cashflow live
- Estimated rent
- $1,355 medium interval (Pro) →
- Mortgage (P&I)
- −$417
- Tax from tax record
- −$102 /mo · $1,225/yr
- Insurance
- −$33
- HOA
- −$0
- Vacancy / Maint / Mgmt
- −$285
- Net cashflow
- $518
Break-even live
UW: 25.0% down · 7.5% · 30yr · 1.5% tax · 5.0% vac · 8.0% maint · 8.0% mgmt
Financing live
Cash to close
- Down payment
- $19,875
- Closing costs
- $2,385
- Reserves months
- —
- Total cash needed
- —
Loan-product check · same deal, 3 products live
Conventional
25% down · 7.5% · 30yr
- Down + closing
- —
- Monthly P&I
- —
- Monthly cashflow
- —
- DSCR
- —
- Eligible?
- —
Personal DTI + credit; lowest rate.
DSCR
20% down · 8.5% · 30yr
- Down + closing
- —
- Monthly P&I
- —
- Monthly cashflow
- —
- DSCR
- —
- Eligible?
- —
No personal income docs; deal must DSCR.
Hard money
10% down · 12.0% · 12mo
- Down + closing
- —
- Monthly P&I
- —
- Monthly cashflow
- —
- DSCR
- —
- Eligible?
- —
Short-term bridge; refi at stabilization.
Listing history 21 events
-
2026-06-19days on market $79,500 Active 4 DOM
-
2026-06-18days on market $79,500 Active 3 DOM
-
2026-06-17days on market $79,500 Active 2 DOM
-
2026-06-15pricedays on market $79,500 Active 1 DOM
-
2026-06-15days on market $84,400 Active 40 DOM
-
2026-06-14days on market $84,400 Active 38 DOM
-
2026-06-13days on market $84,400 Active 37 DOM
-
2026-06-10days on market $84,400 Active 35 DOM
-
2026-06-09days on market $84,400 Active 34 DOM
-
2026-06-09price $84,400 Active 33 DOM
-
2026-06-08days on market $84,500 Active 33 DOM
-
2026-06-07days on market $84,500 Active 32 DOM
-
2026-06-03days on market $84,500 Active 28 DOM
-
2026-06-02pricedays on market $84,500 Active 27 DOM
-
2026-06-01days on market $87,500 Active 26 DOM
-
2026-05-31days on market $87,500 Active 25 DOM
-
2026-05-30days on market $87,500 Active 24 DOM
-
2026-05-18price $89,300 540-char remark
-
2026-05-12price $89,400 540-char remark
-
2026-05-06$89,500 Active 540-char remark
-
2021-09-08soldstatus
ⓘ Source: listings_history table (triggers on properties + properties_extension) + one-shot
backfill from property_details.listing_events for pre-trigger history.
Tax reassessment forecast TX · Resets to sale price
- Current annual tax
- $1,225 · $102/mo
- Projected year-2 tax
- $1,455 · $121/mo
- Expected delta
- +$230/yr (+$19/mo · 18.8%)
ⓘ Screening estimate from a state-policy table — verify with the county assessor before closing.
Climate risk First Street
- Flood 1/10 Low FEMA zone X · 0% chance over 30 yrs
- Wildfire 5/10 Major
- Heat 9/10 Extreme 7 d/yr ≥111°F today · 21 d/yr by 30 yrs out
- Wind 9/10 Extreme 99% chance of damaging wind over 30 yrs
- Air quality 1/10 Low 0 unhealthy d/yr today · 0 by 30 yrs out
Nearby sold comps map
Loading sold comps map…
Walkable amenities ~0.75 mi
Loading nearby amenities…
Taxation est. · year 1
- Rental income
- $16,259
- − Mortgage interest
- −$4,453
- − Property taxes
- −$1,225
- − Insurance
- −$398
- − Repairs & maintenance
- −$1,301
- − Management
- −$1,301
- − Depreciation
- −$2,313
- Taxable income
- $5,269
- Est. tax owed @ 24.0%
- −$1,264
- After-tax cash flow
- $4,954/yr
For passive investors: Depreciation is non-cash, so a rental often shows a tax loss while cash-flowing — sheltering income. Rental losses are passive: they offset passive income freely, and up to $25,000/yr can offset ordinary (W-2) income if you actively participate and your MAGI is under $100k (phasing out to $0 by $150k); unused losses carry forward. On sale, claimed depreciation is recaptured at up to 25%, and gains may owe capital-gains tax (a 1031 exchange can defer both). Figures are a year-1 estimate at your 24.0% rate — not tax advice; consult a CPA.
Schools (NCES district)
- District
- Victoria ISD
- NCES district ID
- 4844150
- Math proficiency
- 24% ▼ -12.00%
- Reading proficiency
- 33% ▼ -2.00%
- Median HH income
- $50,534
- Composite
- 24.98/100
- National rank
- #7562
- State rank
- #645 of 826 in TX
Livability — Victoria
- Score
- 71/100
- State rank
- #309
- US rank
- #6960
Category grades
Schools grade is shown separately in the Schools card above.
Census & demographics
- Census place
- Victoria, TX
- County
- Victoria County · 69,915 people
- City population
- 69,915
- Metro
- Victoria, TX
- Population (ZIP)
- 39,854
- Household income
- $57,923
- Rent vs Own
- Severe rent burden
- 1802.0
Population outlook (Victoria County) Hauer SSP2
- Today (2025)
- 106,119 people
- By 2030
- 113,161 · +6.6%
- By 2040
- 127,402 · +20.1%
- By 2050
- 141,953 · +33.8%
- By 2075
- 179,410 · +69.1%
- By 2100
- 200,127 · +88.6%
Race, ethnicity, and origin ACS 2023
- Neighborhood character
- Predominantly Hispanic (66%)
- Race & ethnicity
- Hispanic / Latino 66% Two or more races 30% White 24% Black 7% Asian 2%
- Hispanic origin (detail)
- Mexican 60%
- Common ancestry
- Serbian 2% Lithuanian 1% Italian 1%
- Foreign-born
- 10% · Canada, China
- Languages at home
- 64% English-only · Spanish 35% Chinese 1%
Political lean MEDSL · Victoria
- 2024 margin
- Solid R (+42.6) · D 28.4% · R 71.0%
- 2008→2024 swing
- -9.0pp toward R · 2008: -33.6pp · 2024: -42.6pp
- All cycles
- 2024: R+42.6 2020: R+38.0 2016: R+40.0 2012: R+37.8 2008: R+33.6
Not yet ingested
- Civics
- —
Market trends
- HPI YoY
- ▼ -127.62%
- Current HPI
- 138.3569
- Rent YoY
- ▼ -0.79%
- Metro
- Victoria, TX
- State GDP YoY
- ▲ 3.95%
- F500 in state
- 110
Industry mix (Fortune 500 HQ in TX)
| Industry | F500 HQs | Revenue |
|---|---|---|
| Energy | 16 | $1,198B |
|
||
| Technology | 5 | $198B |
|
||
| Engineering / Construction | 4 | $72B |
|
||
| Energy Services | 3 | $60B |
|
||
| Utilities | 3 | $41B |
|
||
| Healthcare | 2 | $330B |
|
||
Price history
-11.2% since first listed9 events — show timeline
- 2026-06-15 Listing Removed — CTXMLS
- 2026-06-15 Listed $79,500 CTXMLS
- 2026-06-08 Price Changed $84,400 CTXMLS
- 2026-06-01 Price Changed $84,500 CTXMLS
- 2026-05-26 Price Changed $87,500 CTXMLS
- 2026-05-18 Price Changed $89,300 CTXMLS
- 2026-05-12 Price Changed $89,400 CTXMLS
- 2026-05-06 Listed $89,500 CTXMLS
- 2021-09-08 Sold (Public Records) — Public Records
Property tax history
+8.2%/yrLatest (2025): $1,225 · +1.0% YoY. Source: county tax records.
Cash-flow waterfall
monthlySold comps — $/sqft
last 12 mo · ≤1 miLoading sold comps…