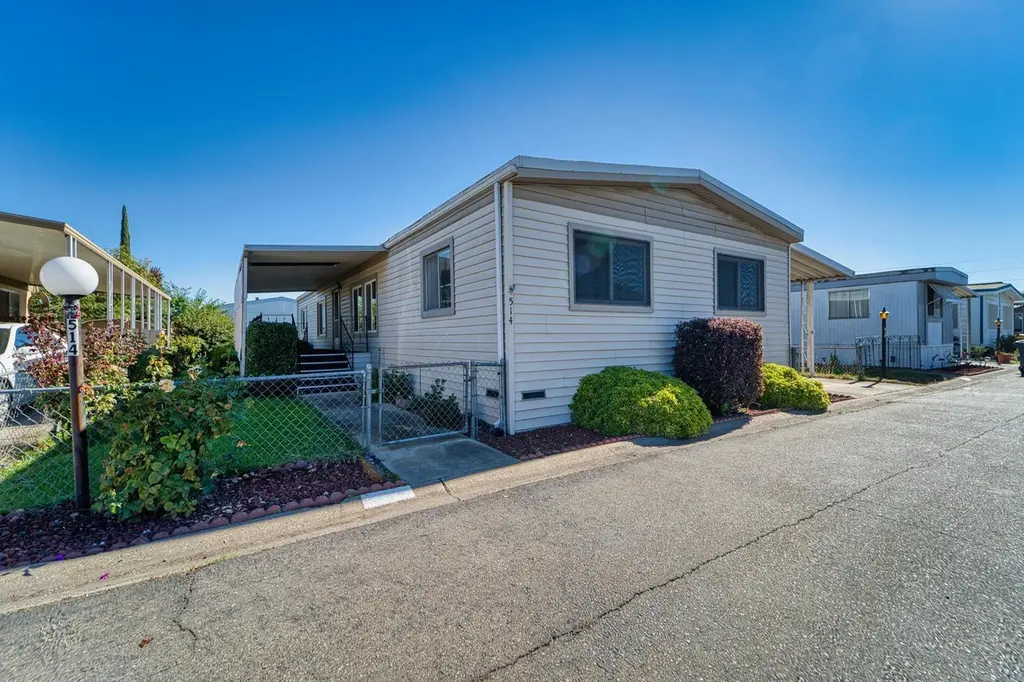
1155 Pease Rd #514 · Yuba City, CA
Flood risk 1/10 · Minimal
- FEMA flood zone
- —
- Chance of flooding over 30 yrs
- 0.0%
- Est. flood insurance / yr
- —
Fire risk 8/10 · Major
- Est. fire insurance / yr
- $659 – $1,223
Heat risk 7/10 · Major
- Hot days now (above 105°F)
- 7 days/yr
- Hot days in 30 yrs
- 16 days/yr
Wind risk 1/10 · Minimal
- Chance of severe wind over 30 yrs
- —
Air-quality risk 10/10 · Severe
- Unhealthy air days now
- 28 days/yr
- Unhealthy air days in 30 yrs
- 32 days/yr
Risk factors via First Street. Map © Google.
Why this score? — see what drove the B grade
The composite is a weighted blend of 9 inputs, each scored 0–100. Each bar is that input's sub-score; the figure is the points it added to the 100-point composite (weight × sub-score).
- Cash flow +30.0/30.0
- 1% rule +10.0/10.0
- DSCR +10.0/10.0
- ARV discount +9.9/15.0
- Livability +3.8/5.0
- Schools +3.2/10.0
- Rent growth +2.9/5.0
- Condition / age +2.2/5.0
- Appreciation +0.0/10.0
$119,500
🖨 Deal sheet 📄 Offer letter ✓ Due diligence
Listing remarks
Beautiful 3-Bedroom Home in Village Green Mobile Home Park, a well-maintained 55+ community offering comfort and convenience. This spacious double-wide home features 3 bedrooms, 2 bathrooms, a large living room, dining area, and bright kitchen with plenty of cabinet space. Enjoy the convenience of indoor laundry and a functional, open floor plan that feels inviting and comfortable. Recent updates include newer carpet, blinds, and refrigerator. The exterior offers covered parking for two cars, a covered patio-perfect for relaxing outdoors-and a fully landscaped/fenced lot with automatic sprinklers. Space rent includes water, sewer, cable, and access to the community clubhouse and swimming po
Key facts
- Fully landscaped lot
- Open floor plan
- Covered parking
Tags
Neighborhood map
What this means for you Summary
Snapshot
- This is a 3-bed/2.0-bath manufactured listed at $120k. Condition is rated fair.
Deal economics
- At list price, monthly cash flow is $1k ($12k/yr) — positive.
- The deal already cash-flows at list — no discount required.
- Meets the 1% rule at list price ($2k rent vs $120k).
- Recommended offer: $105k (12.0% below list) — sets the bar for market timing.
- Cap rate 16.7% vs local median 3.6% in Yuba City — top-decile yield for the area; either an underpriced asset or a hidden risk that comps aren't pricing in. Stress-test before assuming the spread holds.
Location & tenants
- Location reads 75/100 on livability (#111 in CA, #3,863 nationally) — a middle-class / working-renter tenant base. Strengths: commute A+, housing A+, health & safety A+; Watch: crime D+, schools D, cost of living F.
- Yuba City Unified (urban): math 20% / reading 53% proficiency, ranked #263 of 517 in CA (top 51%) — families likely to look elsewhere, expect single-tenant / working-renter base with shorter leases.
- Market conditions: Rents rising (+1.8%/yr); 149 active listings in the ZIP; 3 comparable units currently listed for rent nearby; rentals lingering (median 44d on market — plan ~5-8 weeks vacancy on turnover, expect pricing pressure); 67% of comp listings sitting > 30 days — soft ceiling on asking rent; 73 units permitted in Sutter County in 2024 (0 in 5+ unit buildings).
- This rent runs 40% of the median local income ($71k/yr) — at the standard rent-burdened threshold; future hikes will face affordability resistance.
Forward outlook
- Local home prices are declining (-3.0%/yr); year-one equity from $826 of loan paydown is wiped out by about $4k of value loss. Plan a longer hold.
- Sutter County population projected to shrink 4% by 2050 — rents likely to lag national; underwrite the cash flow, not the appreciation.
- At projected returns (-3.0% appreciation + 1.8% rent growth), your $33k cash investment doubles in ~4 years — after that, you're playing with house money.
Negotiation context
- It's been on market 211 days — a 12% lower offer ($105k) is reasonable based on typical stale-listing flexibility.
Risks & watch-outs
- Climate carrying-cost: severe wildfire risk; extreme-heat days projected 7→16/yr by 2055 (HVAC capex compounding) — expect insurance premiums to compound above CPI over the hold.
Questions for the listing agent
- It's been on market 211 days. Have you received any prior offers? Is the seller open to a 12% concession, seller financing, or rate buy-down credit?
- Have any recent inspections been done? Can we get a copy of the seller's disclosures and any deferred-maintenance estimates?
- Built in 1978 — when were the roof, HVAC, electrical panel, plumbing, and water heater last replaced?
- Why hasn't it sold? Are there any deal-killer items the seller is aware of (foundation, flood, title, zoning, code violations)?
- Is there a deadline driving the sale (1031 exchange, divorce, estate, relocation)? That informs how much negotiation room exists.
- Schools are D-rated, which usually means shorter tenancies and higher turnover. Who's the typical renter profile here, and what's been the actual vacancy rate?
- Crime grade is D in this area — have there been break-ins, vandalism, or insurance claims at this property in the last 3 years? What carrier currently insures it and at what premium?
- What's the average days-on-market for RENTAL listings here right now (not sales)? A rising rental-DOM trend means longer vacancies and softer asking-rent achievability than the comps imply.
- What's the recent tenant-quality profile in this submarket — average credit score on applications, eviction rate, late-payment / NSF rate, and stable-employment percentage? A property-management company in the area should have these aggregated.
- How much new for-sale + rental construction is in the pipeline within 1–3 miles? Heavy new supply typically softens prices + rents 12–24 months out; constrained supply supports both.
Investment metrics
- 1% rule
- 1.98% ✓
- Cap rate
- 16.74%
- Cash-on-cash
- 37.32%
- DSCR
- 2.66
- GRM
- 4.2
CMA / ARV
- ARV (median comp)
- $126,181
- List price
- $119,500
- Delta
- -5.29%
- Verdict
- FAIR
- Comps
- 14 within 1.0 mi
Show comp detail 12 sales within ~0.75 mi
| Address | Dist | Beds/Ba | Sqft | Sold | Price | $/sf | Match |
|---|---|---|---|---|---|---|---|
| 1155 Pease Rd #517 | 0.16mi | 3/2.0 | 1,536 (0%) | 5mo | $95,000 | $62 | 88 |
| 1155 Pease Rd #12 | 0.16mi | 3/2.0 | 1,536 (0%) | 16mo | $115,000 | $75 | 79 |
| 3120 Live Oak Blvd #150 | 0.36mi | 4/2.0 (+1) | 1,560 (+2%) | 6mo | $177,777 | $114 | 70 |
| 3120 Live Oak Blvd #162 | 0.29mi | 4/2.0 (+1) | 1,560 (+2%) | 14mo | $205,000 | $131 | 68 |
| 3120 Live Oak Blvd #111 | 0.36mi | 3/2.0 | 1,664 (+8%) | 2mo | $175,000 | $105 | 68 |
| 3120 Live Oak #44 | 0.25mi | 3/2.0 | 1,440 (-6%) | 13mo | $177,500 | $123 | 67 |
| 3120 Live Oak Blvd #102 | 0.28mi | 3/2.0 | 1,680 (+9%) | 6mo | $165,000 | $98 | 66 |
| 1155 Pease Rd #224 | 0.05mi | 2/2.0 (-1) | 1,320 (-14%) | 4mo | $100,000 | $76 | 66 |
| 3120 Live Oak Blvd #23 | 0.37mi | 2/2.0 (-1) | 1,536 (0%) | 15mo | $160,000 | $104 | 65 |
| 3120 Live Oak Blvd #167 | 0.24mi | 3/2.0 | 1,338 (-13%) | 8mo | $140,000 | $105 | 61 |
| 3120 Live Oak Blvd #126 | 0.37mi | 2/2.0 (-1) | 1,508 (-2%) | 16mo | $199,000 | $132 | 61 |
| 3120 Live Oak Blvd #20 | 0.41mi | 2/2.0 (-1) | 1,440 (-6%) | 11mo | $202,000 | $140 | 57 |
Match score weights: distance 35% · size 25% · config 20% · recency 20%. Top-matched comps best support the ARV.
Projected returns pro-forma
-3.0% appreciation · 1.79% rent growth · sell at horizon
- IRR
- 31.9%
- Equity multiple
- 2.32×
- Total profit
- $44,114
- Equity at exit
- $17,818
- IRR
- 38.3%
- Equity multiple
- 4.36×
- Total profit
- $112,528
- Equity at exit
- $10,332
Cash invested: $33,460 (down + closing). Projections, not guarantees.
Landlord ↔ Tenant lean methodology
- Overall (STATE)
- 18 Strongly Tenant-Friendly
- State California
- 18 Strongly Tenant-Friendly · D+13
- County
- — inherits STATE
- City
- — inherits STATE
ZIP-level market 95991
- Rents YoY
- 1.8%
- Active inventory
- 149
- Price-to-rent
- 4.2×
Monthly cashflow live
- Estimated rent
- $2,363 medium interval (Pro) →
- Mortgage (P&I)
- −$627
- Tax est. 1.5%
- −$149 /mo · $1,792/yr
- Insurance
- −$50
- HOA
- −$0
- Vacancy / Maint / Mgmt
- −$496
- Net cashflow
- $1,041
Break-even live
UW: 25.0% down · 7.5% · 30yr · 1.5% tax · 5.0% vac · 8.0% maint · 8.0% mgmt
Financing live
Cash to close
- Down payment
- $29,875
- Closing costs
- $3,585
- Reserves months
- —
- Total cash needed
- —
Loan-product check · same deal, 3 products live
Conventional
25% down · 7.5% · 30yr
- Down + closing
- —
- Monthly P&I
- —
- Monthly cashflow
- —
- DSCR
- —
- Eligible?
- —
Personal DTI + credit; lowest rate.
DSCR
20% down · 8.5% · 30yr
- Down + closing
- —
- Monthly P&I
- —
- Monthly cashflow
- —
- DSCR
- —
- Eligible?
- —
No personal income docs; deal must DSCR.
Hard money
10% down · 12.0% · 12mo
- Down + closing
- —
- Monthly P&I
- —
- Monthly cashflow
- —
- DSCR
- —
- Eligible?
- —
Short-term bridge; refi at stabilization.
Rent comps 3 comps
| Address | Beds | Baths | Sqft | Rent | $/sqft | DOM | Units | Dist |
|---|---|---|---|---|---|---|---|---|
| 1335 Meadowlark Way Yuba City, CA | 3.0 | 2.0 | 1710 | $2,500 | $1.46 | 43d | 1 | 0.94mi |
| 1101 Northgate Dr Yuba City, CA | 3.0 | 2.0 | 1817 | $2,300 | $1.27 | 43d | 1 | 0.97mi |
| 1722 Clark Ave Yuba City, CA | 3.0 | 2.0 | 1479 | $2,500 | $1.69 | 21d | 1 | 1.18mi |
Listing history 5 events
-
2026-06-03status $119,500 Pending 211 DOM
-
2026-06-02days on market $119,500 Active 211 DOM
-
2026-06-01days on market $119,500 Active 210 DOM
-
2026-05-31days on market $119,500 Active 209 DOM
-
2026-05-30days on market $119,500 Active 208 DOM
ⓘ Source: listings_history table (triggers on properties + properties_extension) + one-shot
backfill from property_details.listing_events for pre-trigger history.
Climate risk First Street
- Flood 1/10 Low 0% chance over 30 yrs
- Wildfire 8/10 Severe
- Heat 7/10 Severe 7 d/yr ≥105°F today · 16 d/yr by 30 yrs out
- Wind 1/10 Low
- Air quality 10/10 Extreme 28 unhealthy d/yr today · 32 by 30 yrs out
Nearby sold comps map
Loading sold comps map…
Walkable amenities ~0.75 mi
Loading nearby amenities…
Taxation est. · year 1
- Rental income
- $28,353
- − Mortgage interest
- −$6,694
- − Property taxes
- −$1,792
- − Insurance
- −$598
- − Repairs & maintenance
- −$2,268
- − Management
- −$2,268
- − Depreciation
- −$3,476
- Taxable income
- $11,256
- Est. tax owed @ 24.0%
- −$2,702
- After-tax cash flow
- $9,787/yr
For passive investors: Depreciation is non-cash, so a rental often shows a tax loss while cash-flowing — sheltering income. Rental losses are passive: they offset passive income freely, and up to $25,000/yr can offset ordinary (W-2) income if you actively participate and your MAGI is under $100k (phasing out to $0 by $150k); unused losses carry forward. On sale, claimed depreciation is recaptured at up to 25%, and gains may owe capital-gains tax (a 1031 exchange can defer both). Figures are a year-1 estimate at your 24.0% rate — not tax advice; consult a CPA.
Condition & rehab AI · 12 photos
This mobile home requires moderate repairs and updates to its kitchen and bathrooms, as well as some exterior work. These improvements would significantly increase its resale and rental value.
Repairs flagged
- Moderate kitchen cabinets — dated and in need of replacement
- Moderate bathroom fixtures — dated and in need of replacement
- Minor exterior siding — moderate wear
Value-add opportunities
- Both update kitchen cabinets and countertops — modernizing the kitchen would appeal to buyers and renters
- Both replace bathroom fixtures and tile — modernizing the bathrooms would appeal to buyers and renters
- Both repair/replace exterior siding — improving the exterior would enhance curb appeal and value
- Both paint interior walls — fresh paint would improve the home's appearance and value
Renovation cost estimate screening
| Repair item | Severity | Est. cost |
|---|---|---|
| kitchen cabinets · dated and in need of replacement | Moderate | $3,000–15,000 |
| bathroom fixtures · dated and in need of replacement | Moderate | $3,000–15,000 |
| exterior siding · moderate wear | Minor | $500–3,000 |
| Total estimated repair cost · 3 items | $6,500–33,000 |
Value-add ROI direction
- Both update kitchen cabinets and countertops — modernizing the kitchen would appeal to buyers and renters ↑
- Both replace bathroom fixtures and tile — modernizing the bathrooms would appeal to buyers and renters ↑
- Both repair/replace exterior siding — improving the exterior would enhance curb appeal and value ↑
- Both paint interior walls — fresh paint would improve the home's appearance and value ↑
ⓘ Cost ranges are severity-bucket heuristics (US national rule-of-thumb). Get contractor quotes + a written scope before underwriting a rehab budget.
Schools (NCES district)
- District
- Yuba City Unified
- NCES district ID
- 0643470
- Math proficiency
- 20% ▼ -10.00%
- Reading proficiency
- 53% ▲ 5.00%
- Median HH income
- $50,923
- Composite
- 31.55/100
- National rank
- #5956
- State rank
- #263 of 517 in CA
Livability — Yuba City
- Score
- 75/100
- State rank
- #111
- US rank
- #3863
Category grades
Schools grade is shown separately in the Schools card above.
Census & demographics
- Census place
- Yuba City, CA
- County
- Sutter County · 81,625 people
- City population
- 81,625
- Metro
- Yuba City, CA
- Population (ZIP)
- 42,579
- Household income
- $70,590
- Rent vs Own
- Severe rent burden
- 1674.0
Population outlook (Sutter County) Hauer SSP2
- Today (2025)
- 97,244 people
- By 2030
- 97,170 · -0.1%
- By 2040
- 96,137 · -1.1%
- By 2050
- 93,604 · -3.7%
- By 2075
- 85,008 · -12.6%
- By 2100
- 71,584 · -26.4%
Race, ethnicity, and origin ACS 2023
- Neighborhood character
- Diverse neighborhood (Simpson 0.68)
- Race & ethnicity
- Hispanic / Latino 41% White 37% Two or more races 19% Asian 12% Black 2% Native American 2%
- Hispanic origin (detail)
- Mexican 36% Puerto Rican 2%
- Common ancestry
- Slovak 2% Russian 1% Portuguese 1%
- Foreign-born
- 24% · Canada, Jamaica
- Languages at home
- 60% English-only · Spanish 28% Other Indo-European 10% Other Asian/Pacific 1%
Political lean MEDSL · Sutter
- 2024 margin
- Solid R (+31.4) · D 33.1% · R 64.5% · Other 2.4%
- 2008→2024 swing
- -14.7pp toward R · 2008: -16.7pp · 2024: -31.4pp
- All cycles
- 2024: R+31.4 2020: R+16.4 2016: R+16.3 2012: R+21.8 2008: R+16.7
Not yet ingested
- Civics
- —
Market trends
- HPI YoY
- ▼ -343.11%
- Current HPI
- 240.3835
- Rent YoY
- ▲ 1.79%
- Metro
- Yuba City, CA
- State GDP YoY
- ▲ 3.21%
- F500 in state
- 116
Industry mix (Fortune 500 HQ in CA)
| Industry | F500 HQs | Revenue |
|---|---|---|
| Technology | 27 | $1,492B |
|
||
| Financial Services | 3 | $174B |
|
||
| Retail | 3 | $44B |
|
||
| Insurance | 3 | $26B |
|
||
| Media / Entertainment | 2 | $115B |
|
||
| Pharmaceuticals / Biotech | 2 | $62B |
|
||
Cash-flow waterfall
monthlySold comps — $/sqft
last 12 mo · ≤1 miLoading sold comps…