4317 Meridith St · Birmingham, AL
Flood risk 1/10 · Minimal
- FEMA flood zone
- X (unshaded)
- Chance of flooding over 30 yrs
- 0.0%
- Est. flood insurance / yr
- $507 – $1,088
Fire risk 3/10 · Minor
- Est. fire insurance / yr
- $916 – $1,700
Heat risk 6/10 · Moderate
- Hot days now (above 107°F)
- 7 days/yr
- Hot days in 30 yrs
- 19 days/yr
Wind risk 6/10 · Moderate
- Chance of severe wind over 30 yrs
- 27.0%
Air-quality risk 5/10 · Moderate
- Unhealthy air days now
- 9 days/yr
- Unhealthy air days in 30 yrs
- 10 days/yr
Risk factors via First Street. Map © Google.
Why this score? — see what drove the B+ grade
The composite is a weighted blend of 9 inputs, each scored 0–100. Each bar is that input's sub-score; the figure is the points it added to the 100-point composite (weight × sub-score).
- Cash flow +30.0/30.0
- 1% rule +10.0/10.0
- DSCR +10.0/10.0
- Appreciation +10.0/10.0
- ARV discount +7.5/15.0
- Livability +3.4/5.0
- Rent growth +2.5/5.0
- Condition / age +2.5/5.0
- Schools +1.8/10.0
$44,900
🖨 Deal sheet 📄 Offer letter ✓ Due diligence
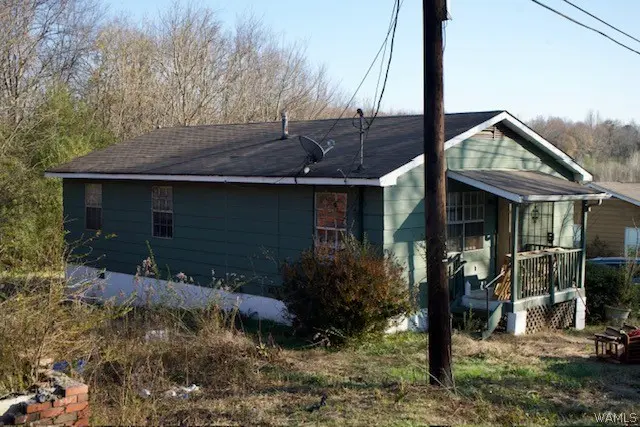
Listing remarks
This 2-bedroom, 1.5-bath home offers an inviting layout of approximately 1,000 sq ft with a comfortable flow and strong potential for personalization. A welcoming rear deck extends the living space outdoors, creating the perfect setting for relaxing, entertaining, or future enhancements. Inside, the home provides a functional footprint that supports a variety of design visions, making it an excellent canvas for modern touches. Natural light, defined living areas, and a practical floorplan add to its appeal, while the overall structure presents a solid foundation for transformation. Located in North Birmingham within an established residential area known for steady activity and a mix of long
Key facts
- Practical floorplan
- Solid foundation
- Rear deck
Tags
Property features AI
Finance
- Other: Lot size approximately 0.12 acres; Flood plain: No
- Financial info: No additional financial details provided
- HOA & community: No association fees
Exterior
- Parking: Driveway parking; Off-street parking
- Security: No specific security features listed
- Utilities: Public water; Septic sewage; Electric water heater; Ceiling fans noted as energy/green feature; Internet availability unknown
- Home design: Existing property; Siding (Hardiplank) exterior; Crawl space foundation
- Construction: Hardiplank siding
- Exterior features: Porch; Open deck; No patio, no pool, no garden view, not waterfront
Interior
- Kitchen: Laminate countertops; Gas stove
- Bedrooms: Two bedrooms on main level
- Flooring: Vinyl flooring
- Bathrooms: One full bathroom; One half bathroom; Tub/shower combo
- Heating & cooling: Central heating; Central cooling
- Interior features: Ceilings noted as 'Other (See Remarks)'; No attic, loft, split level, split foyer, or tri-level; No additional interior features listed
- Laundry & utility: No laundry details provided
Neighborhood map
What this means for you Summary
Snapshot
- This is a 2-bed/1.0-bath single-family listed at $45k.
Deal economics
- At list price, monthly cash flow is $557 ($7k/yr) — positive.
- The deal already cash-flows at list — no discount required.
- Meets the 1% rule at list price ($1k rent vs $45k).
- Recommended offer: $44k (1.5% below list) — sets the bar for market timing.
- Cap rate 21.2% vs local median 6.2% in Birmingham — top-decile yield for the area; either an underpriced asset or a hidden risk that comps aren't pricing in. Stress-test before assuming the spread holds.
Location & tenants
- Location reads 67/100 on livability (#78 in AL) — a middle-class / working-renter tenant base. Strengths: commute A+, cost of living A+, housing A+; Watch: amenities C-, crime F, employment F.
- Jefferson County (suburban): math 9% / reading 32% proficiency, ranked #104 of 129 in AL (top 81%) — low school quality limits family demand, transient renter base, plan for 1-2y turnover.
- Zoned schools: Fultondale Elementary School (math 6% / reading 30%, grade F, #481 of 627 statewide, top 77%, 982 students, 49% FRL); Gardendale High School (math 21% / reading 28%, grade F, #118 of 305 statewide, top 45%, 1,047 students, 48% FRL) — zoned schools at 48% FRL track the district average.
- Market conditions: 42 active listings in the ZIP; 7 comparable units currently listed for rent nearby; rentals lingering (median 44d on market — plan ~5-8 weeks vacancy on turnover, expect pricing pressure); 71% of comp listings sitting > 30 days — soft ceiling on asking rent; 2,114 units permitted in Jefferson County in 2024 (556 in 5+ unit buildings).
Forward outlook
- In year one you build about $5k of equity ($310 loan paydown + $4k appreciation (10.0% local appreciation)).
- Jefferson County population projected to shrink 4% by 2050 — rents likely to lag national; underwrite the cash flow, not the appreciation.
- At projected returns (10.0% appreciation + 3.0% rent growth), your $13k cash investment doubles in ~2 years — after that, you're playing with house money.
- By year 7, paydown + projected appreciation supports a ~$35k cash-out refi (75% LTV) — recoverable capital for the next deal without selling this one.
Negotiation context
- It's been on market 20 days — a 2% lower offer ($44k) is reasonable based on typical stale-listing flexibility.
- 3 sale attempts with the ask held roughly flat each time — persistent listings suggest the price (not the market) is what's stuck; bring a comps-based counter.
Risks & watch-outs
- Watch-outs: built in 1937 — expect roof / HVAC / electrical / plumbing capex.
- Climate carrying-cost: major wind risk, 27% chance of damaging wind over 30y; extreme-heat days projected 7→19/yr by 2055 (HVAC capex compounding) — expect insurance premiums to compound above CPI over the hold.
Questions for the listing agent
- Built in 1937 — when were the roof, HVAC, electrical panel, plumbing, and water heater last replaced?
- Is there a deadline driving the sale (1031 exchange, divorce, estate, relocation)? That informs how much negotiation room exists.
- Schools are F-rated, which usually means shorter tenancies and higher turnover. Who's the typical renter profile here, and what's been the actual vacancy rate?
- Crime grade is F in this area — have there been break-ins, vandalism, or insurance claims at this property in the last 3 years? What carrier currently insures it and at what premium?
- What's the average days-on-market for RENTAL listings here right now (not sales)? A rising rental-DOM trend means longer vacancies and softer asking-rent achievability than the comps imply.
- What's the recent tenant-quality profile in this submarket — average credit score on applications, eviction rate, late-payment / NSF rate, and stable-employment percentage? A property-management company in the area should have these aggregated.
- How much new for-sale + rental construction is in the pipeline within 1–3 miles? Heavy new supply typically softens prices + rents 12–24 months out; constrained supply supports both.
Investment metrics
- 1% rule
- 2.40% ✓
- Cap rate
- 21.19%
- Cash-on-cash
- 53.19%
- DSCR
- 3.37
- GRM
- 3.5
CMA / ARV
- ARV (median comp)
- $99,950
- List price
- $44,900
- Delta
- -31.97%
- Verdict
- UNDERPRICED
- Comps
- 6 within 1.0 mi
Show comp detail 1 sale within ~0.75 mi
| Address | Dist | Beds/Ba | Sqft | Sold | Price | $/sf | Match |
|---|---|---|---|---|---|---|---|
| 2228 Belmore Ln | 0.50mi | 3/1.0 (+1) | 1,059 (+6%) | 18mo | $122,500 | $116 | 47 |
Match score weights: distance 35% · size 25% · config 20% · recency 20%. Top-matched comps best support the ARV.
Projected returns pro-forma
10.0% appreciation · 3.0% rent growth · sell at horizon
- IRR
- 66.3%
- Equity multiple
- 5.77×
- Total profit
- $59,954
- Equity at exit
- $40,449
- IRR
- 59.9%
- Equity multiple
- 12.82×
- Total profit
- $148,655
- Equity at exit
- $87,231
Cash invested: $12,572 (down + closing). Projections, not guarantees.
Landlord ↔ Tenant lean methodology
- Overall (STATE)
- 90 Strongly Landlord-Friendly
- State Alabama
- 90 Strongly Landlord-Friendly · R+15
- County
- — inherits STATE
- City
- — inherits STATE
ZIP-level market 35207
- Home prices YoY
- 18.7%
- Active inventory
- 42
- Price-to-rent
- 3.5×
Monthly cashflow live
- Estimated rent
- $1,078 high interval (Pro) →
- Mortgage (P&I)
- −$235
- Tax from tax record
- −$40 /mo · $478/yr
- Insurance
- −$19
- HOA
- −$0
- Vacancy / Maint / Mgmt
- −$226
- Net cashflow
- $557
Break-even live
UW: 25.0% down · 7.5% · 30yr · 1.5% tax · 5.0% vac · 8.0% maint · 8.0% mgmt
Financing live
Cash to close
- Down payment
- $11,225
- Closing costs
- $1,347
- Reserves months
- —
- Total cash needed
- —
Loan-product check · same deal, 3 products live
Conventional
25% down · 7.5% · 30yr
- Down + closing
- —
- Monthly P&I
- —
- Monthly cashflow
- —
- DSCR
- —
- Eligible?
- —
Personal DTI + credit; lowest rate.
DSCR
20% down · 8.5% · 30yr
- Down + closing
- —
- Monthly P&I
- —
- Monthly cashflow
- —
- DSCR
- —
- Eligible?
- —
No personal income docs; deal must DSCR.
Hard money
10% down · 12.0% · 12mo
- Down + closing
- —
- Monthly P&I
- —
- Monthly cashflow
- —
- DSCR
- —
- Eligible?
- —
Short-term bridge; refi at stabilization.
Rent comps 7 comps
| Address | Beds | Baths | Sqft | Rent | $/sqft | DOM | Units | Dist |
|---|---|---|---|---|---|---|---|---|
| 2015 36th Ave N Birmingham, AL | 3.0 | 1.0 | 1468 | $1,190 | $0.81 | 23d | 1 | 1.01mi |
| 1709 36th Ave N Birmingham, AL | 3.0 | 1.0 | 970 | $1,350 | $1.39 | 43d | 1 | 1.04mi |
| 1721 35th Ave N Birmingham, AL | 2.0 | 1.0 | 1184 | $875 | $0.74 | 43d | 1 | 1.11mi |
| 537 37th Ter W Birmingham, AL | 3.0 | 1.0 | 1060 | $1,000 | $0.94 | 43d | 1 | 1.17mi |
| 3417 4th St W Birmingham, AL | 3.0 | 2.0 | 1275 | $1,000 | $0.78 | 43d | 1 | 1.40mi |
| 2129 30th Ave N Birmingham, AL | 3.0 | 1.0 | 1042 | $1,000 | $0.96 | 43d | 1 | 1.45mi |
| 424 34th Ave W Birmingham, AL | 3.0 | 2.0 | 969 | $1,050 | $1.08 | 23d | 1 | 1.46mi |
Listing history 16 events
-
2026-06-18days on market $44,900 Active 20 DOM
-
2026-06-17days on market $44,900 Active 19 DOM
-
2026-06-16days on market $44,900 Active 18 DOM
-
2026-06-15days on market $44,900 Active 17 DOM
-
2026-06-13days on market $44,900 Active 15 DOM
-
2026-06-10days on market $44,900 Active 12 DOM
-
2026-06-09days on market $44,900 Active 11 DOM
-
2026-06-08days on market $44,900 Active 10 DOM
-
2026-06-07days on market $44,900 Active 9 DOM
-
2026-06-03days on market $44,900 Active 5 DOM
-
2026-06-02days on market $44,900 Active 4 DOM
-
2026-06-01days on market $44,900 Active 3 DOM
-
2026-05-31days on market $44,900 Active 2 DOM
-
2026-05-19price $68,000 573-char remark
-
2026-03-26$70,000 Active 573-char remark
-
2025-09-19$65,000 Active
ⓘ Source: listings_history table (triggers on properties + properties_extension) + one-shot
backfill from property_details.listing_events for pre-trigger history.
Tax reassessment forecast AL · Resets to sale price
- Current annual tax
- $478 · $40/mo
- Projected year-2 tax
- $478 · $40/mo
- Expected delta
- $0/yr ($0/mo · 0.0%)
ⓘ Screening estimate from a state-policy table — verify with the county assessor before closing.
Climate risk First Street
- Flood 1/10 Low FEMA zone X (unshaded) · 0% chance over 30 yrs
- Wildfire 3/10 Moderate
- Heat 6/10 Major 7 d/yr ≥107°F today · 19 d/yr by 30 yrs out
- Wind 6/10 Major 27% chance of damaging wind over 30 yrs
- Air quality 5/10 Major 9 unhealthy d/yr today · 10 by 30 yrs out
Nearby sold comps map
Loading sold comps map…
Walkable amenities ~0.75 mi
Loading nearby amenities…
Taxation est. · year 1
- Rental income
- $12,931
- − Mortgage interest
- −$2,515
- − Property taxes
- −$478
- − Insurance
- −$224
- − Repairs & maintenance
- −$1,034
- − Management
- −$1,034
- − Depreciation
- −$1,306
- Taxable income
- $6,338
- Est. tax owed @ 24.0%
- −$1,521
- After-tax cash flow
- $5,166/yr
For passive investors: Depreciation is non-cash, so a rental often shows a tax loss while cash-flowing — sheltering income. Rental losses are passive: they offset passive income freely, and up to $25,000/yr can offset ordinary (W-2) income if you actively participate and your MAGI is under $100k (phasing out to $0 by $150k); unused losses carry forward. On sale, claimed depreciation is recaptured at up to 25%, and gains may owe capital-gains tax (a 1031 exchange can defer both). Figures are a year-1 estimate at your 24.0% rate — not tax advice; consult a CPA.
Schools (NCES district)
- District
- Jefferson County
- NCES district ID
- 0101920
- Math proficiency
- 9% ▼ -24.00%
- Reading proficiency
- 32% ▼ -5.00%
- Median HH income
- $51,712
- Composite
- 18.4/100
- National rank
- #8937
- State rank
- #104 of 129 in AL
Livability — Birmingham
- Score
- 67/100
- State rank
- #78
- US rank
- #10412
Category grades
Schools grade is shown separately in the Schools card above.
Census & demographics
- City population
- 210,422
- Population (ZIP)
- 6,824
Population outlook (Jefferson County) Hauer SSP2
- Today (2025)
- 669,185 people
- By 2030
- 669,694 · +0.1%
- By 2040
- 661,388 · -1.2%
- By 2050
- 643,086 · -3.9%
- By 2075
- 577,267 · -13.7%
- By 2100
- 474,758 · -29.1%
Race, ethnicity, and origin ACS 2023
- Neighborhood character
- Predominantly Black (86%)
- Race & ethnicity
- Black 86% White 7% Hispanic / Latino 6%
- Hispanic origin (detail)
- Mexican 5%
- Common ancestry
- Romanian 1% Hispanic 1%
- Foreign-born
- 3% · Canada
- Languages at home
- 92% English-only · Spanish 6% French/Haitian/Cajun 1%
Political lean MEDSL · Jefferson
- 2024 margin
- D (+10.4) · D 54.6% · R 44.2% · Other 1.2%
- 2008→2024 swing
- +5.4pp toward D · 2008: 5.1pp · 2024: 10.4pp
- All cycles
- 2024: D+10.4 2020: D+13.2 2016: D+7.2 2012: D+6.0 2008: D+5.1
Not yet ingested
- Civics
- —
Market trends
- HPI YoY
- ▲ 35.95%
- Current HPI
- 228.5664
- Rent YoY
- —
- Metro
- —
- State GDP YoY
- ▲ 2.94%
- F500 in state
- 4
Industry mix (Fortune 500 HQ in AL)
| Industry | F500 HQs | Revenue |
|---|---|---|
| Financial Services | 1 | $8B |
|
||
| Healthcare | 1 | $5B |
|
||
Price history
-30.9% since first listed5 events — show timeline
- 2026-05-28 Listed $44,900 Greater Alabama MLS
- 2026-05-22 Pending — WAMLS
- 2026-05-19 Price Changed $68,000 WAMLS
- 2026-03-26 Listed $70,000 WAMLS
- 2025-09-19 Listed $65,000 WAMLS
Property tax history
+3.8%/yrLatest (2025): $478 · +0.0% YoY. Source: county tax records.
Cash-flow waterfall
monthlySold comps — $/sqft
last 12 mo · ≤1 miLoading sold comps…