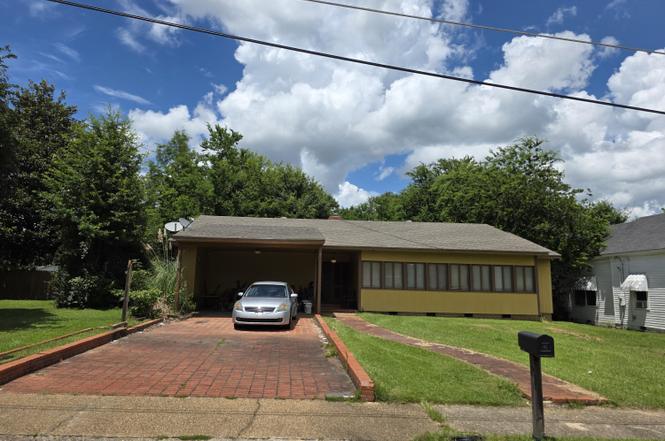
630 W Minnesota Ave #1 · McComb, MS
Flood risk 1/10 · Minimal
- FEMA flood zone
- X (unshaded)
- Chance of flooding over 30 yrs
- 0.0%
- Est. flood insurance / yr
- $507 – $1,088
Fire risk 4/10 · Minor
- Est. fire insurance / yr
- $1,241 – $2,305
Heat risk 8/10 · Major
- Hot days now (above 109°F)
- 7 days/yr
- Hot days in 30 yrs
- 21 days/yr
Wind risk 8/10 · Major
- Chance of severe wind over 30 yrs
- 99.0%
Air-quality risk 1/10 · Minimal
- Unhealthy air days now
- 0 days/yr
- Unhealthy air days in 30 yrs
- 0 days/yr
Risk factors via First Street. Map © Google.
Why this score? — see what drove the C grade
The composite is a weighted blend of 9 inputs, each scored 0–100. Each bar is that input's sub-score; the figure is the points it added to the 100-point composite (weight × sub-score).
- Cash flow +21.5/30.0
- ARV discount +15.0/15.0
- DSCR +6.8/10.0
- 1% rule +5.6/10.0
- Livability +3.5/5.0
- Rent growth +2.5/5.0
- Condition / age +2.2/5.0
- Schools +1.2/10.0
- Appreciation +0.0/10.0
$141,000
🖨 Deal sheet (PDF) 📄 Offer letter ✓ Due diligence
Listing remarks
This is a very spacious home. It has a formal living room, dining room and a large family room with a fireplace. It has a back enclosed porch/sunroom for morning or evening tea or coffee relaxation which overlooks the in-ground pool area in the back yard. Some of the walls are beautiful knotted pine wood. The property has a lot of potential and it does need some repairs. It is being sold-as is. The owner will remove all of the furnishing and remaining items before or after closing.
Key facts
- In-ground pool
- Large family room
- Knotted pine wood
Tags
Property features AI
Finance
- Financial info: Property listed as a fixer
- HOA & community: Community includes park, playground, sidewalks, and street lights
Exterior
- Parking: Attached covered carport (1 carport space); Driveway parking; Open paved concrete parking; Total parking for 2 vehicles
- Security: Leased security system
- Utilities: Public water; Public sewer; Cable available; Electricity connected; Natural gas connected
- Home design: Single-family house; One level; Raised foundation
- Construction: HardiPlank and wood siding exterior; Architectural shingle roof; Built in — year source: assessor
- Exterior features: Private outdoor in-ground pool; Front porch and covered porch; Glass-enclosed porch; Patio; Covered courtyard; Wood fence enclosing back yard; City lot with front yard
Interior
- Kitchen: Cooktop (electric cooktop); Dishwasher; Exhaust fan; Water heater
- Bedrooms: Bedrooms information not provided
- Flooring: Ceramic tile; Hardwood
- Bathrooms: 2 full bathrooms
- Heating & cooling: Central heating; Fireplace(s) with wood-burning option; Natural gas heating; Central air conditioning; Ceiling fans for cooling
- Interior features: Bookcases; Ceiling fans; Granite counters; High-speed internet available; Soaking tub; Pocket and security doors; Aluminum window frames with bay windows and blinds
- Laundry & utility: Washer hookup; Electric dryer hookup; Laundry in common area
Neighborhood map
What this means for you Summary
Snapshot
- This is a 3-bed/2.0-bath single-family listed at $141k. Condition is rated fair.
Deal economics
- At list price, monthly cash flow is $211 ($3k/yr) — positive.
- The deal already cash-flows at list — no discount required.
- Meets the 1% rule at list price ($2k rent vs $141k).
- Cap rate 8.1% vs local median 6.5% in McComb — meaningfully above typical; check what's discounted (condition, days-on-market, listing class) to confirm the premium yield is real.
Location & tenants
- Location reads 69/100 on livability (#50 in MS) — a middle-class / working-renter tenant base. Strengths: cost of living A+, health & safety A+, housing A-; Watch: schools D-, amenities F, commute F.
- Mccomb School District (town): math 15% / reading 16% proficiency, ranked #106 of 130 in MS (top 82%) — low school quality limits family demand, transient renter base, plan for 1-2y turnover; 93% free/reduced lunch — lower-income household profile, screen leases tightly.
- Market conditions: 191 active listings in the ZIP; 1 comparable units currently listed for rent nearby; 10 units permitted in Pike County in 2024 (0 in 5+ unit buildings).
Forward outlook
- Local home prices are declining (-3.0%/yr); year-one equity from $975 of loan paydown is wiped out by about $4k of value loss. Plan a longer hold.
- Pike County population projected at -14% by 2050 — secular population decline; favor cash flow + early exit over multi-decade hold.
Negotiation context
- Only 6 days on market — expect competitive offers; lowballing is unlikely to land.
Risks & watch-outs
- Climate carrying-cost: severe wind risk, 99% chance of damaging wind over 30y; extreme-heat days projected 7→21/yr by 2055 (HVAC capex compounding) — expect insurance premiums to compound above CPI over the hold.
Questions for the listing agent
- Have any recent inspections been done? Can we get a copy of the seller's disclosures and any deferred-maintenance estimates?
- Built in 1974 — when were the roof, HVAC, electrical panel, plumbing, and water heater last replaced?
- Is there a deadline driving the sale (1031 exchange, divorce, estate, relocation)? That informs how much negotiation room exists.
- Schools are D-rated, which usually means shorter tenancies and higher turnover. Who's the typical renter profile here, and what's been the actual vacancy rate?
- What's the average days-on-market for RENTAL listings here right now (not sales)? A rising rental-DOM trend means longer vacancies and softer asking-rent achievability than the comps imply.
- What's the recent tenant-quality profile in this submarket — average credit score on applications, eviction rate, late-payment / NSF rate, and stable-employment percentage? A property-management company in the area should have these aggregated.
- How much new for-sale + rental construction is in the pipeline within 1–3 miles? Heavy new supply typically softens prices + rents 12–24 months out; constrained supply supports both.
Investment metrics
- 1% rule
- 1.06% ✓
- Cap rate
- 8.09%
- Cash-on-cash
- 6.40%
- DSCR
- 1.28
- GRM
- 7.8
CMA / ARV
- ARV (on-the-fly)
- $171,000
- Comps found
- 12
Show comp detail 12 sales within ~0.75 mi
| Address | Dist | Beds/Ba | Sqft | Sold | Price | $/sf | Match |
|---|---|---|---|---|---|---|---|
| 507 W Georgia Ave | 0.25mi | 3/2.0 | 2,264 (+1%) | 1mo | $55,000 | $24 | 86 |
| 234 S 4th St | 0.27mi | 3/2.0 | 2,130 (-5%) | 2mo | $178,500 | $84 | 76 |
| 227 N James Ave | 0.39mi | 3/3.0 | 2,251 (0%) | 11mo | $59,000 | $26 | 68 |
| 412 S 4th St | 0.36mi | 3/1.0 | 2,076 (-8%) | 5mo | $70,000 | $34 | 63 |
| 623 Louisiana Ave | 0.15mi | 3/2.0 | 1,968 (-12%) | 13mo | $135,000 | $69 | 62 |
| 228 Sinclair St | 0.59mi | 4/3.0 (+1) | 2,400 (+7%) | 1mo | $179,000 | $75 | 52 |
| 600 Jackson Ave | 0.59mi | 4/3.0 (+1) | 2,400 (+7%) | 6mo | $159,000 | $66 | 48 |
| 128 Sinclair St | 0.60mi | 4/2.5 (+1) | 2,000 (-11%) | 0mo | $214,900 | $107 | 46 |
| 402 High St | 0.60mi | 4/2.0 (+1) | 2,023 (-10%) | 8mo | $169,900 | $84 | 44 |
| 517 James Avenue North | 0.62mi | 3/2.0 | 2,567 (+14%) | 8mo | $195,500 | $76 | 41 |
| 425 S Broadway St | 0.64mi | 4/3.0 (+1) | 1,971 (-12%) | 2mo | $169,900 | $86 | 39 |
| 214 Thompson St | 0.62mi | 4/3.0 (+1) | 1,935 (-14%) | 3mo | $169,900 | $88 | 37 |
Match score weights: distance 35% · size 25% · config 20% · recency 20%. Top-matched comps best support the ARV.
Projected returns pro-forma
-3.0% appreciation · 3.0% rent growth · sell at horizon
- IRR
- -6.4%
- Equity multiple
- 0.76×
- Total profit
- $-9,413
- Equity at exit
- $21,024
- IRR
- 3.2%
- Equity multiple
- 1.23×
- Total profit
- $9,165
- Equity at exit
- $12,191
Cash invested: $39,480 (down + closing). Projections, not guarantees.
Landlord ↔ Tenant lean methodology
- Overall (STATE)
- 90 Strongly Landlord-Friendly
- State Mississippi
- 90 Strongly Landlord-Friendly · R+11
- County
- — inherits STATE
- City
- — inherits STATE
ZIP-level market 39648
- Active inventory
- 191
- Price-to-rent
- 7.8×
Monthly cashflow live
- Estimated rent
- $1,500 medium interval (Pro) →
- Mortgage (P&I)
- −$739
- Tax est. 1.5%
- −$176 /mo · $2,115/yr
- Insurance
- −$59
- HOA
- −$0
- Vacancy / Maint / Mgmt
- −$315
- Net cashflow
- $211
Break-even live
Sensitivity live
| Price | -10% $308 | -5% $259 | +0% $211 | +5% $162 | +10% $113 |
|---|---|---|---|---|---|
| Rent | -10% $92 | -5% $151 | +0% $211 | +5% $270 | +10% $329 |
| Rate | -1.0pp $282 | -0.5pp $246 | base $211 | +0.5pp $174 | +1.0pp $137 |
UW: 25.0% down · 7.5% · 30yr · 1.5% tax · 5.0% vac · 8.0% maint · 8.0% mgmt
Financing live
Cash to close
- Down payment
- $35,250
- Closing costs
- $4,230
- Reserves months
- —
- Total cash needed
- —
Loan-product check · same deal, 3 products live
Conventional
25% down · 7.5% · 30yr
- Down + closing
- —
- Monthly P&I
- —
- Monthly cashflow
- —
- DSCR
- —
- Eligible?
- —
Personal DTI + credit; lowest rate.
DSCR
20% down · 8.5% · 30yr
- Down + closing
- —
- Monthly P&I
- —
- Monthly cashflow
- —
- DSCR
- —
- Eligible?
- —
No personal income docs; deal must DSCR.
Hard money
10% down · 12.0% · 12mo
- Down + closing
- —
- Monthly P&I
- —
- Monthly cashflow
- —
- DSCR
- —
- Eligible?
- —
Short-term bridge; refi at stabilization.
Rent comps 1 comps
| Address | Beds | Baths | Sqft | Rent | $/sqft | DOM | Units | Dist |
|---|---|---|---|---|---|---|---|---|
| 606 Lakeview Ave McComb, MS | 2.0 | 2.0 | 2312 | $1,500 | $0.65 | 44d | 1 | 1.04mi |
Listing history 6 events
-
2026-06-21days on market $141,000 Active 6 DOM
-
2026-06-18days on market $141,000 Active 4 DOM
-
2026-06-17days on market $141,000 Active 3 DOM
-
2026-06-16days on market $141,000 Active 2 DOM
-
2026-06-15remarks 488-char remark
-
2026-06-15$141,000 Active 1 DOM
ⓘ Source: listings_history table (triggers on properties + properties_extension) + one-shot
backfill from property_details.listing_events for pre-trigger history.
Climate risk First Street
- Flood 1/10 Low FEMA zone X (unshaded) · 0% chance over 30 yrs
- Wildfire 4/10 Moderate
- Heat 8/10 Severe 7 d/yr ≥109°F today · 21 d/yr by 30 yrs out
- Wind 8/10 Severe 99% chance of damaging wind over 30 yrs
- Air quality 1/10 Low 0 unhealthy d/yr today · 0 by 30 yrs out
Nearby sold comps map
Loading sold comps map…
Walkable amenities ~0.75 mi
Loading nearby amenities…
Taxation est. · year 1
- Rental income
- $18,000
- − Mortgage interest
- −$7,898
- − Property taxes
- −$2,115
- − Insurance
- −$705
- − Repairs & maintenance
- −$1,440
- − Management
- −$1,440
- − Depreciation
- −$4,102
- Taxable income
- $300
- Est. tax owed @ 24.0%
- −$72
- After-tax cash flow
- $2,455/yr
For passive investors: Depreciation is non-cash, so a rental often shows a tax loss while cash-flowing — sheltering income. Rental losses are passive: they offset passive income freely, and up to $25,000/yr can offset ordinary (W-2) income if you actively participate and your MAGI is under $100k (phasing out to $0 by $150k); unused losses carry forward. On sale, claimed depreciation is recaptured at up to 25%, and gains may owe capital-gains tax (a 1031 exchange can defer both). Figures are a year-1 estimate at your 24.0% rate — not tax advice; consult a CPA.
Condition & rehab AI · 12 photos
This home requires moderate renovations to improve its condition and increase its value. The kitchen and bathrooms are in poor condition and need major repairs. Landscaping is also in need of attention. Upgrading these areas would significantly increase the home's value.
Repairs flagged
- Major kitchen cabinets — poor condition
- Major bathroom fixtures — dated and worn
- Major landscaping — overgrown and unkempt
Value-add opportunities
- Both kitchen renovation — modernizing the kitchen would increase both resale and rental value
- Both bathroom renovation — updating the bathrooms would increase both resale and rental value
- Both landscaping — improving the landscaping would increase both resale and rental value
Renovation cost estimate screening
| Repair item | Severity | Est. cost |
|---|---|---|
| kitchen cabinets · poor condition | Major | $15,000–50,000 |
| bathroom fixtures · dated and worn | Major | $15,000–50,000 |
| landscaping · overgrown and unkempt | Major | $15,000–50,000 |
| Total estimated repair cost · 3 items | $45,000–150,000 |
Value-add ROI direction
- Both kitchen renovation — modernizing the kitchen would increase both resale and rental value ↑
- Both bathroom renovation — updating the bathrooms would increase both resale and rental value ↑
- Both landscaping — improving the landscaping would increase both resale and rental value ↑
ⓘ Cost ranges are severity-bucket heuristics (US national rule-of-thumb). Get contractor quotes + a written scope before underwriting a rehab budget.
Schools (NCES district)
- District
- Mccomb School District
- NCES district ID
- 2802880
- Math proficiency
- 15% ▼ -20.00%
- Reading proficiency
- 16% ▼ -5.00%
- Median HH income
- $29,855
- Composite
- 12.26/100
- National rank
- #9645
- State rank
- #106 of 130 in MS
Livability — McComb
- Score
- 69/100
- State rank
- #50
- US rank
- #8347
Category grades
Schools grade is shown separately in the Schools card above.
Census & demographics
- Census place
- McComb, MS
- Population (ZIP)
- 19,767
Population outlook (Pike County) Hauer SSP2
- Today (2025)
- 38,766 people
- By 2030
- 37,874 · -2.3%
- By 2040
- 35,743 · -7.8%
- By 2050
- 33,276 · -14.2%
- By 2075
- 26,799 · -30.9%
- By 2100
- 18,562 · -52.1%
Race, ethnicity, and origin ACS 2023
- Neighborhood character
- Majority Black (64%)
- Race & ethnicity
- Black 64% White 32% Two or more races 2% Hispanic / Latino 2%
- Common ancestry
- Slovak 2% Lithuanian 1% Italian 1%
- Foreign-born
- 1%
- Languages at home
- 98% English-only · Spanish 1%
Political lean MEDSL · Pike
- 2024 margin
- Toss-up / Even · D 47.8% · R 51.3%
- 2008→2024 swing
- -7.0pp toward R · 2008: 3.5pp · 2024: -3.5pp
- All cycles
- 2024: R+3.5 2020: D+1.0 2016: R+0.7 2012: D+7.6 2008: D+3.5
Not yet ingested
- Civics
- —
Market trends
- HPI YoY
- ▼ -88.61%
- Current HPI
- 92.2495
- Rent YoY
- —
- Metro
- —
- State GDP YoY
- —
- F500 in state
- 0
Price history
1 event — show timeline
- 2026-06-13 Listed $141,000 MLSU
Cash-flow waterfall
monthlySold comps — $/sqft
last 12 mo · ≤1 miLoading sold comps…