 Multi-family
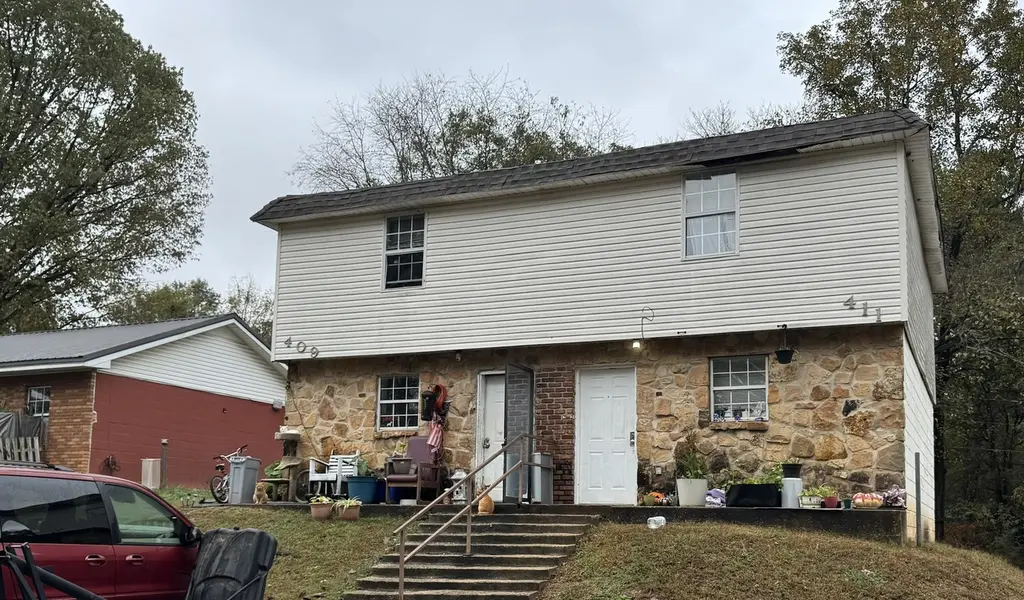
409 S Orleans St · Florence, AL
Flood risk 1/10 · Minimal
- FEMA flood zone
- X (unshaded)
- Chance of flooding over 30 yrs
- 0.0%
- Est. flood insurance / yr
- $507 – $1,088
Fire risk 1/10 · Minimal
- Est. fire insurance / yr
- $916 – $1,700
Heat risk 6/10 · Moderate
- Hot days now (above 108°F)
- 7 days/yr
- Hot days in 30 yrs
- 20 days/yr
Wind risk 5/10 · Moderate
- Chance of severe wind over 30 yrs
- 23.0%
Air-quality risk 2/10 · Minimal
- Unhealthy air days now
- 0 days/yr
- Unhealthy air days in 30 yrs
- 2 days/yr
Risk factors via First Street. Map © Google.
Why this score? — see what drove the C+ grade
The composite is a weighted blend of 9 inputs, each scored 0–100. Each bar is that input's sub-score; the figure is the points it added to the 100-point composite (weight × sub-score).
- Cash flow +26.4/30.0
- DSCR +9.0/10.0
- ARV discount +7.5/15.0
- 1% rule +7.0/10.0
- Livability +4.1/5.0
- Rent growth +4.0/5.0
- Schools +3.0/10.0
- Condition / age +2.2/5.0
- Appreciation +0.0/10.0
$449,900
🖨 Deal sheet (PDF) 📄 Offer letter ✓ Due diligence
Multi-family units
County records classify this as Multi-Family (2-4 Unit). Listing-text estimate: 1 unit. estimate disagrees with records
Listing remarks MLS
Great investment opportunity in a prime location! This property features three duplexes with six fully rented 2-bedroom, 1-bath units, offering immediate income plus strong upside potential. The units are solid but could benefit from updates, giving investors an excellent chance to increase rents and overall property value. Consistently rented and conveniently located near major amenities, this is a smart value-add addition to any portfolio.
Key facts
- Updates
- Immediate income
- Prime location
Tags
Neighborhood map
What this means for you Summary
Snapshot
- This is a multifamily listed at $450k. Condition is rated fair.
Deal economics
- At list price, monthly cash flow is $1k ($14k/yr) — positive.
- The deal already cash-flows at list — no discount required.
- Meets the 1% rule at list price ($5k rent vs $450k).
- Recommended offer: $396k (12.0% below list) — sets the bar for market timing.
- Cap rate 9.4% vs local median 3.6% in Florence — top-decile yield for the area; either an underpriced asset or a hidden risk that comps aren't pricing in. Stress-test before assuming the spread holds.
Location & tenants
- Location reads 82/100 on livability (#4 in AL, #1,140 nationally) — a professional / high-income tenant draw. Strengths: amenities A+, commute A+, cost of living A+; Watch: crime F, employment F.
- Florence City (urban): math 28% / reading 44% proficiency, ranked #44 of 129 in AL (top 34%) — families likely to look elsewhere, expect single-tenant / working-renter base with shorter leases.
- Zoned schools: Forest Hills School (math 39% / reading 65%, grade C-, #102 of 627 statewide, top 17%, 831 students, 45% FRL); Florence Middle School (math 22% / reading 44%, grade F, #101 of 257 statewide, top 40%, 689 students, 51% FRL); Florence High School (math 28% / reading 34%, grade F, #66 of 305 statewide, top 21%, 1,034 students, 36% FRL).
- Market conditions: Rents rising fast (+6.2%/yr); 270 active listings in the ZIP; 2 comparable units currently listed for rent nearby; 164 units permitted in Lauderdale County in 2024 (72 in 5+ unit buildings).
- At $5,416/mo this rent would consume 140% of the median local household income ($46k/yr) (locally 1516% of renters already pay >50% of income on rent) — very limited rent-growth headroom before tenants either downsize or default.
Forward outlook
- Local home prices are declining (-3.0%/yr); year-one equity from $3k of loan paydown is wiped out by about $13k of value loss. Plan a longer hold.
- At projected returns (-3.0% appreciation + 6.2% rent growth), your $126k cash investment doubles in ~8 years — after that, you're playing with house money.
Negotiation context
- It's been on market 194 days — a 12% lower offer ($396k) is reasonable based on typical stale-listing flexibility.
- 2 sale attempts since 4y ago with the ask held roughly flat each time — persistent listings suggest the price (not the market) is what's stuck; bring a comps-based counter.
- Current owner paid $75k; list at $450k implies a 500% gain — meaningful room to come down on a strong offer.
Risks & watch-outs
- Climate carrying-cost: moderate wind risk, 23% chance of damaging wind over 30y; extreme-heat days projected 7→20/yr by 2055 (HVAC capex compounding) — expect insurance premiums to compound above CPI over the hold.
Questions for the listing agent
- It's been on market 194 days. Have you received any prior offers? Is the seller open to a 12% concession, seller financing, or rate buy-down credit?
- Have any recent inspections been done? Can we get a copy of the seller's disclosures and any deferred-maintenance estimates?
- Built in 1976 — when were the roof, HVAC, electrical panel, plumbing, and water heater last replaced?
- Why hasn't it sold? Are there any deal-killer items the seller is aware of (foundation, flood, title, zoning, code violations)?
- Is there a deadline driving the sale (1031 exchange, divorce, estate, relocation)? That informs how much negotiation room exists.
- Crime grade is F in this area — have there been break-ins, vandalism, or insurance claims at this property in the last 3 years? What carrier currently insures it and at what premium?
- What's the average days-on-market for RENTAL listings here right now (not sales)? A rising rental-DOM trend means longer vacancies and softer asking-rent achievability than the comps imply.
- What's the recent tenant-quality profile in this submarket — average credit score on applications, eviction rate, late-payment / NSF rate, and stable-employment percentage? A property-management company in the area should have these aggregated.
- How much new apartment / multifamily construction is in the pipeline within 1–3 miles? Heavy new supply (>2% of stock underway) typically softens rents 12–24 months out; light construction supports rent growth.
Investment metrics
- 1% rule
- 1.20% ✓
- Cap rate
- 9.41%
- Cash-on-cash
- 11.14%
- DSCR
- 1.50
- GRM
- 6.9
CMA / ARV
- ARV (median comp)
- $78,612
- List price
- $449,900
- Delta
- 472.30%
- Verdict
- OVERPRICED
- Comps
- 1 within 2.0 mi
Projected returns pro-forma
-3.0% appreciation · 6.18% rent growth · sell at horizon
- IRR
- 3.9%
- Equity multiple
- 1.16×
- Total profit
- $19,544
- Equity at exit
- $67,082
- IRR
- 16.2%
- Equity multiple
- 2.52×
- Total profit
- $191,593
- Equity at exit
- $38,899
Cash invested: $125,972 (down + closing). Projections, not guarantees.
Landlord ↔ Tenant lean methodology
- Overall (STATE)
- 90 Strongly Landlord-Friendly
- State Alabama
- 90 Strongly Landlord-Friendly · R+15
- County
- — inherits STATE
- City
- — inherits STATE
ZIP-level market 35630
- Home prices YoY
- -33.7%
- Rents YoY
- 6.2%
- Active inventory
- 270
- Price-to-rent
- 41.5×
Monthly cashflow live
- Estimated rent
- $5,416 medium interval (Pro) →
- Mortgage (P&I)
- −$2,359
- Tax est. 1.5%
- −$562 /mo · $6,748/yr
- Insurance
- −$187
- HOA
- −$0
- Vacancy / Maint / Mgmt
- −$1,137
- Net cashflow
- $1,169
Break-even live
Sensitivity live
| Price | -10% $1,480 | -5% $1,325 | +0% $1,169 | +5% $1,014 | +10% $859 |
|---|---|---|---|---|---|
| Rent | -10% $742 | -5% $956 | +0% $1,169 | +5% $1,383 | +10% $1,597 |
| Rate | -1.0pp $1,396 | -0.5pp $1,284 | base $1,169 | +0.5pp $1,053 | +1.0pp $934 |
6-unit breakdown (identical units grouped — click to expand)
| Units | Beds | Baths | Est. rent |
|---|---|---|---|
| 6× units | 2 | 1 | $5,418 |
| #1 | 2 | 1 | $903 |
| #2 | 2 | 1 | $903 |
| #3 | 2 | 1 | $903 |
| #4 | 2 | 1 | $903 |
| #5 | 2 | 1 | $903 |
| #6 | 2 | 1 | $903 |
| Total (6 units) | $5,416 | ||
UW: 25.0% down · 7.5% · 30yr · 1.5% tax · 5.0% vac · 8.0% maint · 8.0% mgmt
Financing live
Cash to close
- Down payment
- $112,475
- Closing costs
- $13,497
- Reserves months
- —
- Total cash needed
- —
Loan-product check · same deal, 3 products live
Conventional
25% down · 7.5% · 30yr
- Down + closing
- —
- Monthly P&I
- —
- Monthly cashflow
- —
- DSCR
- —
- Eligible?
- —
Personal DTI + credit; lowest rate.
DSCR
20% down · 8.5% · 30yr
- Down + closing
- —
- Monthly P&I
- —
- Monthly cashflow
- —
- DSCR
- —
- Eligible?
- —
No personal income docs; deal must DSCR.
Hard money
10% down · 12.0% · 12mo
- Down + closing
- —
- Monthly P&I
- —
- Monthly cashflow
- —
- DSCR
- —
- Eligible?
- —
Short-term bridge; refi at stabilization.
Rent comps 2 comps
| Address | Beds | Baths | Sqft | Rent | $/sqft | DOM | Units | Dist |
|---|---|---|---|---|---|---|---|---|
| 4026 Peachtree St Florence, AL | 3.0 | 2.0 | 1660 | $1,300 | $0.78 | 45d | 1 | 0.85mi |
| 200 Foxfield Pl Florence, AL | 2.0 | 2.0 | 1250 | $1,120 | $0.90 | 45d | 1 | 0.90mi |
Listing history 20 events
-
2026-06-22days on market $449,900 Active 194 DOM
-
2026-06-21days on market $449,900 Active 193 DOM
-
2026-06-19days on market $449,900 Active 191 DOM
-
2026-06-18days on market $449,900 Active 190 DOM
-
2026-06-17days on market $449,900 Active 189 DOM
-
2026-06-16days on market $449,900 Active 188 DOM
-
2026-06-15days on market $449,900 Active 187 DOM
-
2026-06-14days on market $449,900 Active 185 DOM
-
2026-06-13days on market $449,900 Active 184 DOM
-
2026-06-10days on market $449,900 Active 182 DOM
-
2026-06-09days on market $449,900 Active 181 DOM
-
2026-06-08days on market $449,900 Active 180 DOM
-
2026-06-05days on market $449,900 Active 176 DOM
-
2026-06-02days on market $449,900 Active 174 DOM
-
2026-06-01days on market $449,900 Active 173 DOM
-
2026-05-31days on market $449,900 Active 172 DOM
-
2026-05-30days on market $449,900 Active 171 DOM
-
2025-12-10$449,900 Active 445-char remark
Show marketing remark (445 chars)
Great investment opportunity in a prime location! This property features three duplexes with six fully rented 2-bedroom, 1-bath units, offering immediate income plus strong upside potential. The units are solid but could benefit from updates, giving investors an excellent chance to increase rents and overall property value. Consistently rented and conveniently located near major amenities, this is a smart value-add addition to any portfolio.
-
2022-05-04soldstatus $75,000 13-char remark
Show marketing remark (13 chars)
Sold at print
-
2022-05-03$75,000 13-char remark
Show marketing remark (13 chars)
Sold at print
ⓘ Source: listings_history table (triggers on properties + properties_extension) + one-shot
backfill from property_details.listing_events for pre-trigger history.
Climate risk First Street
- Flood 1/10 Low FEMA zone X (unshaded) · 0% chance over 30 yrs
- Wildfire 1/10 Low
- Heat 6/10 Major 7 d/yr ≥108°F today · 20 d/yr by 30 yrs out
- Wind 5/10 Major 23% chance of damaging wind over 30 yrs
- Air quality 2/10 Low 0 unhealthy d/yr today · 2 by 30 yrs out
Nearby sold comps map
Loading sold comps map…
Walkable amenities ~0.75 mi
Loading nearby amenities…
Taxation est. · year 1
- Rental income
- $64,992
- − Mortgage interest
- −$25,201
- − Property taxes
- −$6,748
- − Insurance
- −$2,250
- − Repairs & maintenance
- −$5,199
- − Management
- −$5,199
- − Depreciation
- −$13,088
- Taxable income
- $7,306
- Est. tax owed @ 24.0%
- −$1,753
- After-tax cash flow
- $12,280/yr
For passive investors: Depreciation is non-cash, so a rental often shows a tax loss while cash-flowing — sheltering income. Rental losses are passive: they offset passive income freely, and up to $25,000/yr can offset ordinary (W-2) income if you actively participate and your MAGI is under $100k (phasing out to $0 by $150k); unused losses carry forward. On sale, claimed depreciation is recaptured at up to 25%, and gains may owe capital-gains tax (a 1031 exchange can defer both). Figures are a year-1 estimate at your 24.0% rate — not tax advice; consult a CPA.
Condition & rehab AI · 2 photos
This multi-family property presents as needing moderate repairs and maintenance, with potential for significant value increase through exterior updates and landscaping improvements.
Repairs flagged
- Moderate exterior siding — Weathered and discolored
- Minor landscaping — Needs trimming and freshening
Value-add opportunities
- Both paint exterior — Enhances curb appeal and property value
- Both landscaping — Improves curb appeal and rental appeal
Renovation cost estimate screening
| Repair item | Severity | Est. cost |
|---|---|---|
| exterior siding · Weathered and discolored | Moderate | $3,000–15,000 |
| landscaping · Needs trimming and freshening | Minor | $500–3,000 |
| Total estimated repair cost · 2 items | $3,500–18,000 |
Value-add ROI direction
- Both paint exterior — Enhances curb appeal and property value ↑
- Both landscaping — Improves curb appeal and rental appeal ↑
ⓘ Cost ranges are severity-bucket heuristics (US national rule-of-thumb). Get contractor quotes + a written scope before underwriting a rehab budget.
Schools (NCES district)
- District
- Florence City
- NCES district ID
- 0101530
- Math proficiency
- 28% ▼ -28.00%
- Reading proficiency
- 44% ▼ -4.00%
- Median HH income
- $34,997
- Composite
- 29.69/100
- National rank
- #6456
- State rank
- #44 of 129 in AL
Livability — Florence
- Score
- 82/100
- State rank
- #4
- US rank
- #1140
Category grades
Schools grade is shown separately in the Schools card above.
Census & demographics
- Census place
- Florence, AL
- County
- Lauderdale County · 47,988 people
- City population
- 34,028
- Metro
- Florence-Muscle Shoals, AL
- Population (ZIP)
- 34,028
- Household income
- $46,304
- Rent vs Own
- Severe rent burden
- 1516.0
Population outlook (Lauderdale County) Hauer SSP2
- Today (2025)
- 93,386 people
- By 2030
- 93,634 · +0.3%
- By 2040
- 93,114 · -0.3%
- By 2050
- 91,586 · -1.9%
- By 2075
- 88,667 · -5.1%
- By 2100
- 81,098 · -13.2%
Race, ethnicity, and origin ACS 2023
- Neighborhood character
- Predominantly White (70%)
- Race & ethnicity
- White 70% Black 18% Two or more races 6% Hispanic / Latino 6%
- Hispanic origin (detail)
- Mexican 5%
- Common ancestry
- Slovak 3% Serbian 2% Romanian 1%
- Foreign-born
- 4% · Canada, Vietnam, Guatemala
- Languages at home
- 92% English-only · Spanish 6% Vietnamese 1%
Political lean MEDSL · Lauderdale
- 2024 margin
- Solid R (+51.5) · D 23.8% · R 75.3%
- 2008→2024 swing
- -23.3pp toward R · 2008: -28.2pp · 2024: -51.5pp
- All cycles
- 2024: R+51.5 2020: R+44.7 2016: R+46.0 2012: R+30.9 2008: R+28.2
Not yet ingested
- Civics
- —
Market trends
- HPI YoY
- ▼ -104.78%
- Current HPI
- 206.1364
- Rent YoY
- ▲ 6.18%
- Metro
- Florence-Muscle Shoals, AL
- State GDP YoY
- ▲ 2.94%
- F500 in state
- 4
Industry mix (Fortune 500 HQ in AL)
| Industry | F500 HQs | Revenue |
|---|---|---|
| Financial Services | 1 | $8B |
|
||
| Healthcare | 1 | $5B |
|
||
Price history
+499.9% since first listed3 events — show timeline
- 2025-12-10 Listed $449,900 SAARMLS
- 2022-05-04 Sold (MLS) $75,000 SAARMLS
- 2022-05-03 Listed $75,000 SAARMLS
Cash-flow waterfall
monthlySold comps — $/sqft
last 12 mo · ≤1 miLoading sold comps…