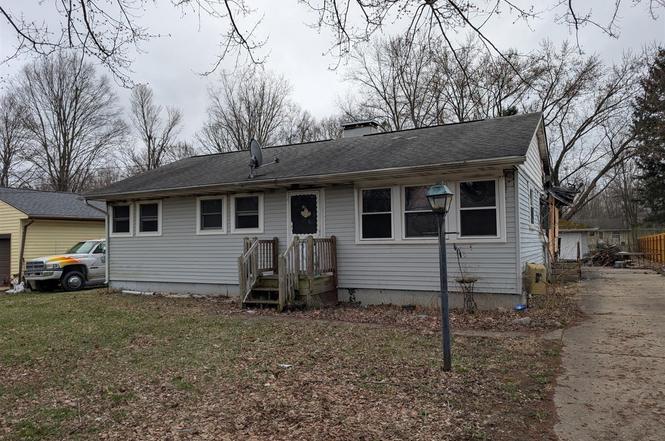
109 Bradley Dr · Jackson, MI
Flood risk 1/10 · Minimal
- FEMA flood zone
- X (unshaded)
- Chance of flooding over 30 yrs
- 0.0%
- Est. flood insurance / yr
- $473 – $860
Fire risk 1/10 · Minimal
- Est. fire insurance / yr
- $784 – $1,456
Heat risk 3/10 · Minor
- Hot days now (above 98°F)
- 7 days/yr
- Hot days in 30 yrs
- 15 days/yr
Wind risk 2/10 · Minimal
- Chance of severe wind over 30 yrs
- —
Air-quality risk 2/10 · Minimal
- Unhealthy air days now
- 1 days/yr
- Unhealthy air days in 30 yrs
- 1 days/yr
Risk factors via First Street. Map © Google.
Why this score? — see what drove the B grade
The composite is a weighted blend of 9 inputs, each scored 0–100. Each bar is that input's sub-score; the figure is the points it added to the 100-point composite (weight × sub-score).
- Cash flow +30.0/30.0
- 1% rule +10.0/10.0
- DSCR +10.0/10.0
- ARV discount +7.5/15.0
- Rent growth +5.0/5.0
- Livability +3.7/5.0
- Schools +2.6/10.0
- Condition / age +2.5/5.0
- Appreciation +0.0/10.0
$99,500
🖨 Deal sheet 📄 Offer letter ✓ Due diligence
Listing remarks MLS
* * LAND CONTRACT TERMS AVAILABLE * * - Property As-Is - Fire damage in back of home. . Ranch style home with 4 bedrooms and 2 full baths. . Partial finished basement . . large lot with a 4 car garage . . located at the dead end part of Bradley Drive . . Northwest Schools . . Hold harmless document needs to be signed before entry into home
Key facts
- 0.27 acre lot
- 4 garage spots
- Pool
Property features AI
Exterior
- Parking: Detached garage; Four-car garage
- Utilities: Public water; Public sewer
- Home design: Ranch-style single family home; Single-story
- Construction: Built in 1955; Vinyl siding; Shingle roof; Full living area approximately 1,828
- Exterior features: Paved road access; Lot approximately 0.27 acres
Interior
- Bathrooms: Two full bathrooms
- Heating & cooling: Forced air heating
- Interior features: Six total rooms; Full basement
- Laundry & utility: Natural gas water heater
Neighborhood map
What this means for you Summary
Snapshot
- This is a 4-bed/2.0-bath single-family listed at $100k.
Deal economics
- At list price, monthly cash flow is $430 ($5k/yr) — positive.
- The deal already cash-flows at list — no discount required.
- Meets the 1% rule at list price ($2k rent vs $100k).
- Recommended offer: $88k (12.0% below list) — sets the bar for market timing.
- Cap rate 11.5% vs local median 5.4% in Jackson — top-decile yield for the area; either an underpriced asset or a hidden risk that comps aren't pricing in. Stress-test before assuming the spread holds.
Location & tenants
- Location reads 74/100 on livability (#197 in MI, #4,970 nationally) — a middle-class / working-renter tenant base. Strengths: cost of living A+, housing A+, health & safety A+; Watch: schools D, crime F, employment F.
- Northwest Community Schools (suburban): math 19% / reading 41% proficiency, ranked #360 of 540 in MI (top 67%) — families likely to look elsewhere, expect single-tenant / working-renter base with shorter leases.
- Market conditions: Rents rising fast (+10.3%/yr); 362 active listings in the ZIP; 317 units permitted in Jackson County in 2024 (103 in 5+ unit buildings).
Forward outlook
- Local home prices are declining (-3.0%/yr); year-one equity from $688 of loan paydown is wiped out by about $3k of value loss. Plan a longer hold.
- Jackson County population projected at -13% by 2050 — secular population decline; favor cash flow + early exit over multi-decade hold.
- At projected returns (-3.0% appreciation + 8.0% rent growth), your $28k cash investment doubles in ~5 years — after that, you're playing with house money.
Negotiation context
- It's been on market 127 days — a 12% lower offer ($88k) is reasonable based on typical stale-listing flexibility.
- 6 sale attempts with the ask held roughly flat each time — persistent listings suggest the price (not the market) is what's stuck; bring a comps-based counter.
- Current owner paid $30k; list at $100k implies a 232% gain — meaningful room to come down on a strong offer.
Risks & watch-outs
- Watch-outs: property tax is 3.5% of price; built in 1955 — expect roof / HVAC / electrical / plumbing capex.
Questions for the listing agent
- It's been on market 127 days. Have you received any prior offers? Is the seller open to a 12% concession, seller financing, or rate buy-down credit?
- Built in 1955 — when were the roof, HVAC, electrical panel, plumbing, and water heater last replaced?
- Property tax is high relative to price — has the assessment been appealed recently, and will the sale trigger a re-assessment?
- Why hasn't it sold? Are there any deal-killer items the seller is aware of (foundation, flood, title, zoning, code violations)?
- Is there a deadline driving the sale (1031 exchange, divorce, estate, relocation)? That informs how much negotiation room exists.
- Schools are D-rated, which usually means shorter tenancies and higher turnover. Who's the typical renter profile here, and what's been the actual vacancy rate?
- Crime grade is F in this area — have there been break-ins, vandalism, or insurance claims at this property in the last 3 years? What carrier currently insures it and at what premium?
- What's the average days-on-market for RENTAL listings here right now (not sales)? A rising rental-DOM trend means longer vacancies and softer asking-rent achievability than the comps imply.
- What's the recent tenant-quality profile in this submarket — average credit score on applications, eviction rate, late-payment / NSF rate, and stable-employment percentage? A property-management company in the area should have these aggregated.
- How much new for-sale + rental construction is in the pipeline within 1–3 miles? Heavy new supply typically softens prices + rents 12–24 months out; constrained supply supports both.
Investment metrics
- 1% rule
- 1.64% ✓
- Cap rate
- 11.48%
- Cash-on-cash
- 18.52%
- DSCR
- 1.82
- GRM
- 5.1
CMA / ARV
- ARV (on-the-fly)
- $294,308
- Comps found
- 9
Show comp detail 9 sales within ~0.75 mi
| Address | Dist | Beds/Ba | Sqft | Sold | Price | $/sf | Match |
|---|---|---|---|---|---|---|---|
| 5124 Emerald Rd | 0.41mi | 3/2.5 (-1) | 1,775 (-3%) | 4mo | $367,500 | $207 | 66 |
| 5230 Grand River Cir | 0.35mi | 3/2.5 (-1) | 1,895 (+4%) | 8mo | $305,000 | $161 | 64 |
| 145 Falcon Rd | 0.35mi | 3/1.0 (-1) | 1,771 (-3%) | 10mo | $238,000 | $134 | 61 |
| 5243 S Boulder St | 0.55mi | 3/2.0 (-1) | 1,760 (-4%) | 7mo | $293,000 | $166 | 57 |
| 5022 Fieldstone St | 0.42mi | 3/2.5 (-1) | 1,812 (-1%) | 19mo | $287,500 | $159 | 56 |
| 5300 Grand River Cir | 0.52mi | 3/2.5 (-1) | 1,756 (-4%) | 10mo | $325,430 | $185 | 54 |
| 5177 Stone River Rd | 0.48mi | 4/3.5 | 2,066 (+13%) | 2mo | $400,000 | $194 | 48 |
| 4105 Oriole Dr | 0.31mi | 3/2.0 (-1) | 1,619 (-11%) | 18mo | $205,000 | $127 | 46 |
| 4934 Ledgerock St | 0.41mi | 3/2.5 (-1) | 1,662 (-9%) | 21mo | $265,000 | $159 | 42 |
Match score weights: distance 35% · size 25% · config 20% · recency 20%. Top-matched comps best support the ARV.
Projected returns pro-forma
-3.0% appreciation · 8.0% rent growth · sell at horizon
- IRR
- 16.6%
- Equity multiple
- 1.72×
- Total profit
- $20,006
- Equity at exit
- $14,836
- IRR
- 29.0%
- Equity multiple
- 4.32×
- Total profit
- $92,405
- Equity at exit
- $8,603
Cash invested: $27,860 (down + closing). Projections, not guarantees.
Landlord ↔ Tenant lean methodology
- Overall (STATE)
- 62 Landlord-Friendly
- State Michigan
- 62 Landlord-Friendly · EVEN
- County
- — inherits STATE
- City
- — inherits STATE
ZIP-level market 49201
- Rents YoY
- 10.3%
- Active inventory
- 362
- Price-to-rent
- 5.1×
Monthly cashflow live
- Estimated rent
- $1,630 medium interval (Pro) →
- Mortgage (P&I)
- −$522
- Tax from tax record
- −$294 /mo · $3,528/yr
- Insurance
- −$41
- HOA
- −$0
- Vacancy / Maint / Mgmt
- −$342
- Net cashflow
- $430
Break-even live
UW: 25.0% down · 7.5% · 30yr · 1.5% tax · 5.0% vac · 8.0% maint · 8.0% mgmt
Financing live
Cash to close
- Down payment
- $24,875
- Closing costs
- $2,985
- Reserves months
- —
- Total cash needed
- —
Loan-product check · same deal, 3 products live
Conventional
25% down · 7.5% · 30yr
- Down + closing
- —
- Monthly P&I
- —
- Monthly cashflow
- —
- DSCR
- —
- Eligible?
- —
Personal DTI + credit; lowest rate.
DSCR
20% down · 8.5% · 30yr
- Down + closing
- —
- Monthly P&I
- —
- Monthly cashflow
- —
- DSCR
- —
- Eligible?
- —
No personal income docs; deal must DSCR.
Hard money
10% down · 12.0% · 12mo
- Down + closing
- —
- Monthly P&I
- —
- Monthly cashflow
- —
- DSCR
- —
- Eligible?
- —
Short-term bridge; refi at stabilization.
Listing history 30 events
-
2026-06-19days on market $99,500 Active 127 DOM
-
2026-06-18days on market $99,500 Active 126 DOM
-
2026-06-17days on market $99,500 Active 125 DOM
-
2026-06-16days on market $99,500 Active 124 DOM
-
2026-06-15days on market $99,500 Active 123 DOM
-
2026-06-14days on market $99,500 Active 121 DOM
-
2026-06-13days on market $99,500 Active 120 DOM
-
2026-06-10days on market $99,500 Active 118 DOM
-
2026-06-09days on market $99,500 Active 117 DOM
-
2026-06-08days on market $99,500 Active 116 DOM
-
2026-06-07days on market $99,500 Active 115 DOM
-
2026-06-05days on market $99,500 Active 112 DOM
-
2026-06-03days on market $99,500 Active 111 DOM
-
2026-06-02days on market $99,500 Active 110 DOM
-
2026-06-01days on market $99,500 Active 109 DOM
-
2026-05-31days on market $99,500 Active 108 DOM
-
2026-05-30days on market $99,500 Active 107 DOM
-
2026-02-12$99,500 Active 345-char remark
Show marketing remark (345 chars)
* * LAND CONTRACT TERMS AVAILABLE * * - Property As-Is - Fire damage in back of home. . Ranch style home with 4 bedrooms and 2 full baths. . Partial finished basement . . large lot with a 4 car garage . . located at the dead end part of Bradley Drive . . Northwest Schools . . Hold harmless document needs to be signed before entry into home
-
2026-02-12$99,500 Active
Show marketing remark (345 chars)
* * LAND CONTRACT TERMS AVAILABLE * * - Property As-Is - Fire damage in back of home. . Ranch style home with 4 bedrooms and 2 full baths. . Partial finished basement . . large lot with a 4 car garage . . located at the dead end part of Bradley Drive . . Northwest Schools . . Hold harmless document needs to be signed before entry into home
-
2026-02-04soldstatus $30,000 Closed
-
2026-02-04soldstatus $30,000 Closed
-
2026-02-04soldstatus $30,000 Sold
-
2026-01-19status Pending
-
2026-01-19status Pending
-
2026-01-19status Pending
-
2026-01-16$99,500 Active
-
2026-01-16$99,500 Active
-
2026-01-16$99,500 Active
-
2021-01-21soldstatus $157,000
ⓘ Source: listings_history table (triggers on properties + properties_extension) + one-shot
backfill from property_details.listing_events for pre-trigger history.
Tax reassessment forecast MI · Partial reset (capped growth)
- Current annual tax
- $3,528 · $294/mo
- Projected year-2 tax
- $3,528 · $294/mo
- Expected delta
- $0/yr ($0/mo · 0.0%)
ⓘ Screening estimate from a state-policy table — verify with the county assessor before closing.
Climate risk First Street
- Flood 1/10 Low FEMA zone X (unshaded) · 0% chance over 30 yrs
- Wildfire 1/10 Low
- Heat 3/10 Moderate 7 d/yr ≥98°F today · 15 d/yr by 30 yrs out
- Wind 2/10 Low
- Air quality 2/10 Low 1 unhealthy d/yr today · 1 by 30 yrs out
Nearby sold comps map
Loading sold comps map…
Walkable amenities ~0.75 mi
Loading nearby amenities…
Taxation est. · year 1
- Rental income
- $19,554
- − Mortgage interest
- −$5,574
- − Property taxes
- −$3,528
- − Insurance
- −$498
- − Repairs & maintenance
- −$1,564
- − Management
- −$1,564
- − Depreciation
- −$2,895
- Taxable income
- $3,931
- Est. tax owed @ 24.0%
- −$944
- After-tax cash flow
- $4,217/yr
For passive investors: Depreciation is non-cash, so a rental often shows a tax loss while cash-flowing — sheltering income. Rental losses are passive: they offset passive income freely, and up to $25,000/yr can offset ordinary (W-2) income if you actively participate and your MAGI is under $100k (phasing out to $0 by $150k); unused losses carry forward. On sale, claimed depreciation is recaptured at up to 25%, and gains may owe capital-gains tax (a 1031 exchange can defer both). Figures are a year-1 estimate at your 24.0% rate — not tax advice; consult a CPA.
Schools (NCES district)
- District
- Northwest Community Schools
- NCES district ID
- 2626010
- Math proficiency
- 19% ▼ -8.00%
- Reading proficiency
- 41% ▼ -1.00%
- Median HH income
- $47,509
- Composite
- 25.88/100
- National rank
- #7342
- State rank
- #360 of 540 in MI
Livability — Jackson
- Score
- 74/100
- State rank
- #197
- US rank
- #4970
Category grades
Schools grade is shown separately in the Schools card above.
Census & demographics
- County
- Jackson County · 85,581 people
- City population
- 85,581
- Metro
- Jackson, MI
- Population (ZIP)
- 49,107
- Household income
- $74,484
- Rent vs Own
- Severe rent burden
- 840.0
Population outlook (Jackson County) Hauer SSP2
- Today (2025)
- 156,365 people
- By 2030
- 153,123 · -2.1%
- By 2040
- 144,981 · -7.3%
- By 2050
- 135,671 · -13.2%
- By 2075
- 113,833 · -27.2%
- By 2100
- 86,592 · -44.6%
Race, ethnicity, and origin ACS 2023
- Neighborhood character
- Predominantly White (80%)
- Race & ethnicity
- White 80% Black 9% Two or more races 6% Hispanic / Latino 5%
- Hispanic origin (detail)
- Mexican 4%
- Common ancestry
- Romanian 7% Lithuanian 3% Slovak 2%
- Foreign-born
- 3% · Canada
- Languages at home
- 96% English-only · Spanish 2% Other Indo-European 1% Russian/Polish/Slavic 1%
Political lean MEDSL · Jackson
- 2024 margin
- Strong R (+21.3) · D 38.6% · R 59.9% · Other 1.5%
- 2008→2024 swing
- -23.7pp toward R · 2008: 2.4pp · 2024: -21.3pp
- All cycles
- 2024: R+21.3 2020: R+19.0 2016: R+20.1 2012: R+5.8 2008: D+2.4
Not yet ingested
- Civics
- —
Market trends
- HPI YoY
- ▼ -198.89%
- Current HPI
- 185.3773
- Rent YoY
- ▲ 10.32%
- Metro
- Jackson, MI
- State GDP YoY
- ▲ 1.37%
- F500 in state
- 28
Industry mix (Fortune 500 HQ in MI)
| Industry | F500 HQs | Revenue |
|---|---|---|
| Automotive Parts | 3 | $48B |
|
||
| Automotive | 2 | $372B |
|
||
| Chemicals | 1 | $45B |
|
||
| Automotive Retail | 1 | $29B |
|
||
| Healthcare / Medical Devices | 1 | $23B |
|
||
| Automotive Technology | 1 | $20B |
|
||
Price history
-36.6% since first listed13 events — show timeline
- 2026-02-12 Listed $99,500 SW Michigan MLS
- 2026-02-12 Listed $99,500 MiRealSource-MiMLS
- 2026-02-12 Listed $99,500 REALCOMP
- 2026-02-04 Sold (MLS) $30,000 SW Michigan MLS
- 2026-02-04 Sold (MLS) $30,000 REALCOMP
- 2026-02-04 Sold (MLS) $30,000 MiRealSource-MiMLS
- 2026-01-19 Pending — REALCOMP
- 2026-01-19 Pending — MiRealSource-MiMLS
- 2026-01-19 Pending — SW Michigan MLS
- 2026-01-16 Listed $99,500 REALCOMP
- 2026-01-16 Listed $99,500 SW Michigan MLS
- 2026-01-16 Listed $99,500 MiRealSource-MiMLS
- 2021-01-21 Sold (Public Records) $157,000 Public Records
Property tax history
+8.1%/yrLatest (2025): $3,528 · +2.5% YoY. Source: county tax records.
Cash-flow waterfall
monthlySold comps — $/sqft
last 12 mo · ≤1 miLoading sold comps…