 🔨 Auction
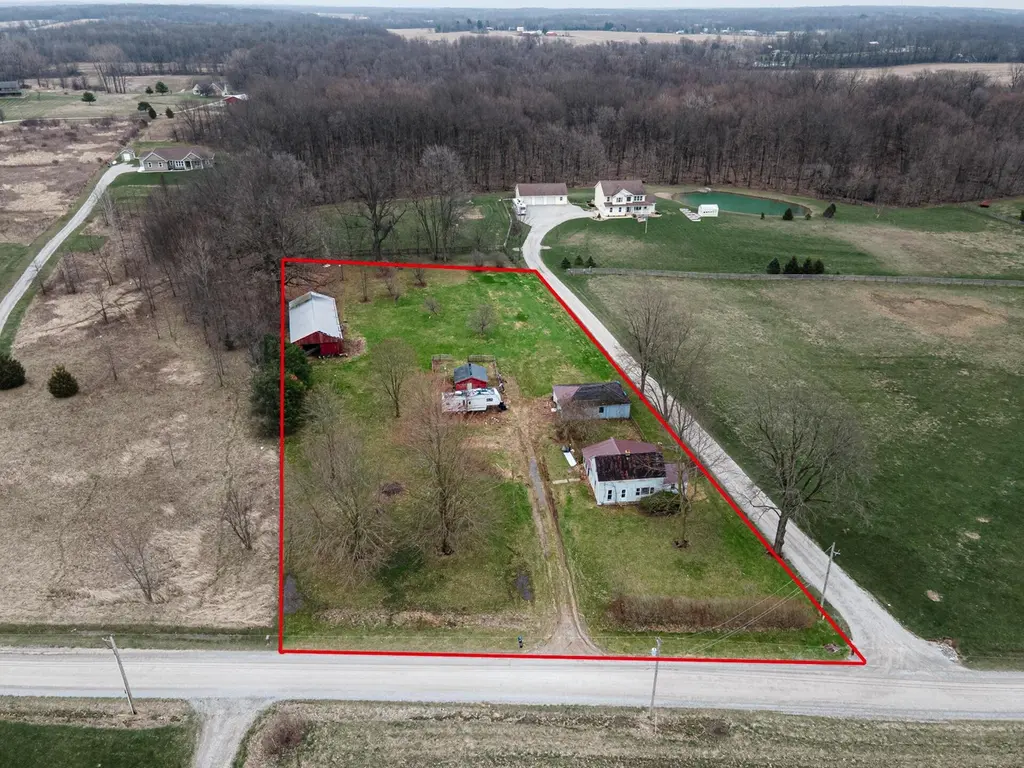
2735 Township Road 20 · Fulton, OH
Flood risk 1/10 · Minimal
- FEMA flood zone
- X (unshaded)
- Chance of flooding over 30 yrs
- 0.0%
- Est. flood insurance / yr
- $507 – $1,088
Fire risk 1/10 · Minimal
- Est. fire insurance / yr
- $713 – $1,323
Heat risk 3/10 · Minor
- Hot days now (above 97°F)
- 7 days/yr
- Hot days in 30 yrs
- 17 days/yr
Wind risk 2/10 · Minimal
- Chance of severe wind over 30 yrs
- —
Air-quality risk 2/10 · Minimal
- Unhealthy air days now
- 1 days/yr
- Unhealthy air days in 30 yrs
- 2 days/yr
Risk factors via First Street. Map © Google.
Why this score? — see what drove the F grade
The composite is a weighted blend of 9 inputs, each scored 0–100. Each bar is that input's sub-score; the figure is the points it added to the 100-point composite (weight × sub-score).
- ARV discount +7.5/15.0
- Schools +4.5/10.0
- Livability +3.1/5.0
- Cash flow +2.8/30.0
- Rent growth +2.5/5.0
- Condition / age +2.5/5.0
- 1% rule +0.0/10.0
- DSCR +0.0/10.0
- Appreciation +0.0/10.0
$75,000
🖨 Deal sheet 📄 Offer letter ✓ Due diligence
Listing remarks
ONLINE AUCTION, the RESERVE (minimum bid) is $75,000. The Auction ends at 7:00pm, Tuesday, 4/21/26. Bring your vision to life with this charming country farmhouse set in a peaceful, private rural setting. Situated on just under 2 acres in Morrow County, this property offers the perfect opportunity for a full renovation or investment project. With approximately 1364 sq ft of living space, the 1.5-story home provides a solid starting point for those ready to roll up their sleeves and create something special. The property is well-equipped for a variety of uses, featuring multiple outbuildings including a 72x28 barn in need of rehab, a 35x23 detached garage, and a 16x14 shed with fenced area
Key facts
- 72x28 barn
- Country farmhouse
- 16x14 shed
Tags
Property features AI
Finance
- Financial info: Property listed at auction
Exterior
- Parking: Detached 2-car garage
- Utilities: Private sewer; Well water
- Home design: Single-family residence; One-and-a-half stories; Built in 1901; No shared/common walls; Suitable for farm use
- Construction: Stone foundation
- Exterior features: Shed(s) and outbuilding; Lot about 1.92 acres
Interior
- Bedrooms: One main-level bedroom
- Bathrooms: One full bathroom
- Interior features: Fireplace (one); Crawl space basement
Neighborhood map
What this means for you Summary
Snapshot
- This is a 2-bed/1.0-bath single-family listed at $75k.
Deal economics
- At list price, monthly cash flow is $-1k ($-14k/yr) — negative.
- The deal already cash-flows at list — no discount required.
- Meets the 1% rule at list price ($1k rent vs $75k).
- Recommended offer: $73k (3.0% below list) — sets the bar for market timing.
Location & tenants
- Location reads 62/100 on livability (#895 in OH) — a middle-class / working-renter tenant base. Strengths: cost of living A+, housing A+; Watch: schools F, amenities F, commute F.
- Cardington-Lincoln Local (rural): math 48% / reading 58% proficiency, ranked #395 of 656 in OH (top 60%) — acceptable for families but not a draw, mixed tenant base, ~2y average lease.
- Market conditions: 33 active listings in the ZIP; 129 units permitted in Morrow County in 2024 (0 in 5+ unit buildings).
Forward outlook
- Local home prices are declining (-3.0%/yr); year-one equity from $2k of loan paydown is wiped out by about $10k of value loss. Plan a longer hold.
- Morrow County population projected at -10% by 2050 — secular population decline; favor cash flow + early exit over multi-decade hold.
Negotiation context
- It's been on market 31 days — a 3% lower offer ($73k) is reasonable based on typical stale-listing flexibility.
- 2 sale attempts since 13y ago with the ask held roughly flat each time — persistent listings suggest the price (not the market) is what's stuck; bring a comps-based counter.
Risks & watch-outs
- Watch-outs: built in 1901 — expect roof / HVAC / electrical / plumbing capex.
Questions for the listing agent
- What do current leases actually rent for vs. the listed asking? Can we see a recent rent roll and the last 12 months of T-12 income?
- It's been on market 31 days. Have you received any prior offers? Is the seller open to a 3% concession, seller financing, or rate buy-down credit?
- Built in 1901 — when were the roof, HVAC, electrical panel, plumbing, and water heater last replaced?
- Is there a deadline driving the sale (1031 exchange, divorce, estate, relocation)? That informs how much negotiation room exists.
- Schools are F-rated, which usually means shorter tenancies and higher turnover. Who's the typical renter profile here, and what's been the actual vacancy rate?
- The area grade is low — what's the realistic commute time and amenity access for the typical tenant pool here? Any planned neighborhood developments (good or bad) we should know about?
- What's the average days-on-market for RENTAL listings here right now (not sales)? A rising rental-DOM trend means longer vacancies and softer asking-rent achievability than the comps imply.
- What's the recent tenant-quality profile in this submarket — average credit score on applications, eviction rate, late-payment / NSF rate, and stable-employment percentage? A property-management company in the area should have these aggregated.
- How much new for-sale + rental construction is in the pipeline within 1–3 miles? Heavy new supply typically softens prices + rents 12–24 months out; constrained supply supports both.
Investment metrics
- 1% rule
- 0.35% ✗
- Cap rate
- 2.27%
- Cash-on-cash
- -14.35%
- DSCR
- 0.36
- GRM
- 23.9
CMA / ARV
- ARV (on-the-fly)
- $346,456
- Comps found
- 3
Show comp detail 3 sales within ~0.75 mi
| Address | Dist | Beds/Ba | Sqft | Sold | Price | $/sf | Match |
|---|---|---|---|---|---|---|---|
| 5280 Township Road 179 | 0.68mi | 3/2.0 (+1) | 1,296 (-5%) | 11mo | $279,900 | $216 | 42 |
| 2920 Township 20 Rd | 0.53mi | 3/2.0 (+1) | 1,192 (-13%) | 16mo | $355,000 | $298 | 32 |
| 5358 Township Road 179 | 0.75mi | 3/2.0 (+1) | 1,200 (-12%) | 13mo | $305,000 | $254 | 26 |
Match score weights: distance 35% · size 25% · config 20% · recency 20%. Top-matched comps best support the ARV.
Projected returns pro-forma
-3.0% appreciation · 3.0% rent growth · sell at horizon
- IRR
- -43.7%
- Equity multiple
- -0.34×
- Total profit
- $-130,183
- Equity at exit
- $51,658
- IRR
- -78.0%
- Equity multiple
- -1.16×
- Total profit
- $-209,131
- Equity at exit
- $29,955
Cash invested: $97,008 (down + closing). Projections, not guarantees.
Landlord ↔ Tenant lean methodology
- Overall (STATE)
- 73 Landlord-Friendly
- State Ohio
- 73 Landlord-Friendly · R+6
- County
- — inherits STATE
- City
- — inherits STATE
ZIP-level market 43315
- Home prices YoY
- -25.8%
- Active inventory
- 33
- Price-to-rent
- 5.2×
Monthly cashflow live
- Estimated rent
- $1,207 medium interval (Pro) →
- Mortgage (P&I)
- −$1,817
- Tax from tax record
- −$152 /mo · $1,827/yr
- Insurance
- −$144
- HOA
- −$0
- Vacancy / Maint / Mgmt
- −$253
- Net cashflow
- $-1,160
Break-even live
UW: 25.0% down · 7.5% · 30yr · 1.5% tax · 5.0% vac · 8.0% maint · 8.0% mgmt
Financing live
Cash to close
- Down payment
- $86,614
- Closing costs
- $10,394
- Reserves months
- —
- Total cash needed
- —
Loan-product check · same deal, 3 products live
Conventional
25% down · 7.5% · 30yr
- Down + closing
- —
- Monthly P&I
- —
- Monthly cashflow
- —
- DSCR
- —
- Eligible?
- —
Personal DTI + credit; lowest rate.
DSCR
20% down · 8.5% · 30yr
- Down + closing
- —
- Monthly P&I
- —
- Monthly cashflow
- —
- DSCR
- —
- Eligible?
- —
No personal income docs; deal must DSCR.
Hard money
10% down · 12.0% · 12mo
- Down + closing
- —
- Monthly P&I
- —
- Monthly cashflow
- —
- DSCR
- —
- Eligible?
- —
Short-term bridge; refi at stabilization.
Listing history 7 events
-
2026-04-22status Pending
-
2026-03-22$75,000 Active
-
2014-01-15soldstatus $165,000
-
2014-01-15soldstatus $165,000
-
2013-11-21historical
-
2013-09-03$189,900
-
1972-06-01soldstatus $29,900
ⓘ Source: listings_history table (triggers on properties + properties_extension) + one-shot
backfill from property_details.listing_events for pre-trigger history.
Tax reassessment forecast OH · Partial reset (capped growth)
- Current annual tax
- $1,827 · $152/mo
- Projected year-2 tax
- $1,827 · $152/mo
- Expected delta
- $0/yr ($0/mo · 0.0%)
ⓘ Screening estimate from a state-policy table — verify with the county assessor before closing.
Climate risk First Street
- Flood 1/10 Low FEMA zone X (unshaded) · 0% chance over 30 yrs
- Wildfire 1/10 Low
- Heat 3/10 Moderate 7 d/yr ≥97°F today · 17 d/yr by 30 yrs out
- Wind 2/10 Low
- Air quality 2/10 Low 1 unhealthy d/yr today · 2 by 30 yrs out
Nearby sold comps map
Loading sold comps map…
Walkable amenities ~0.75 mi
Loading nearby amenities…
Taxation est. · year 1
- Rental income
- $14,482
- − Mortgage interest
- −$19,407
- − Property taxes
- −$1,827
- − Insurance
- −$1,732
- − Repairs & maintenance
- −$1,159
- − Management
- −$1,159
- − Depreciation
- −$10,079
- Taxable loss
- −$20,881
- Est. tax savings @ 24.0%
- +$5,011
- After-tax cash flow
- $-8,910/yr
For passive investors: Depreciation is non-cash, so a rental often shows a tax loss while cash-flowing — sheltering income. Rental losses are passive: they offset passive income freely, and up to $25,000/yr can offset ordinary (W-2) income if you actively participate and your MAGI is under $100k (phasing out to $0 by $150k); unused losses carry forward. On sale, claimed depreciation is recaptured at up to 25%, and gains may owe capital-gains tax (a 1031 exchange can defer both). Figures are a year-1 estimate at your 24.0% rate — not tax advice; consult a CPA.
Schools (NCES district)
- District
- Cardington-Lincoln Local
- NCES district ID
- 3904879
- Math proficiency
- 48% ▼ -12.00%
- Reading proficiency
- 58% ▼ -1.00%
- Median HH income
- $50,782
- Composite
- 45.31/100
- National rank
- #2646
- State rank
- #395 of 656 in OH
Livability — Fulton
- Score
- 62/100
- State rank
- #895
- US rank
- #16941
Category grades
Schools grade is shown separately in the Schools card above.
Census & demographics
- County
- Morrow · 41,908 people
- City population
- 357
- Metro
- Columbus, OH
- Population (ZIP)
- 6,996
- Household income
- $69,621
- Rent vs Own
- Severe rent burden
- 4.1
Population outlook (Morrow County) Hauer SSP2
- Today (2025)
- 35,607 people
- By 2030
- 35,482 · -0.4%
- By 2040
- 34,369 · -3.5%
- By 2050
- 32,038 · -10.0%
- By 2075
- 25,090 · -29.5%
- By 2100
- 17,123 · -51.9%
Race, ethnicity, and origin ACS 2023
- Neighborhood character
- Predominantly White (93%)
- Race & ethnicity
- White 93% Two or more races 4% Black 1%
- Common ancestry
- Slovak 7% Portuguese 5% Romanian 3%
- Foreign-born
- 0%
- Languages at home
- 99% English-only · German/W. Germanic 1%
Political lean MEDSL · Morrow
- 2024 margin
- Solid R (+55.7) · D 21.7% · R 77.5%
- 2008→2024 swing
- -32.4pp toward R · 2008: -23.4pp · 2024: -55.7pp
- All cycles
- 2024: R+55.7 2020: R+54.3 2016: R+49.5 2012: R+24.6 2008: R+23.4
Not yet ingested
- Civics
- —
Market trends
- HPI YoY
- ▼ -81.79%
- Current HPI
- 235.5712
- Rent YoY
- —
- Metro
- —
- State GDP YoY
- ▲ 1.98%
- F500 in state
- 48
Industry mix (Fortune 500 HQ in OH)
| Industry | F500 HQs | Revenue |
|---|---|---|
| Insurance | 3 | $145B |
|
||
| Industrial Machinery | 3 | $49B |
|
||
| Financial Services | 3 | $24B |
|
||
| Consumer Goods | 2 | $93B |
|
||
| Aerospace / Defense | 2 | $47B |
|
||
| Utilities | 2 | $33B |
|
||
Price history
+150.8% since first listed7 events — show timeline
- 2026-04-22 Pending — CBRMLS
- 2026-03-22 Listed $75,000 CBRMLS
- 2014-01-15 Sold (Public Records) $165,000 Public Records
- 2014-01-15 Sold (MLS) $165,000 CBRMLS
- 2013-11-21 Listing Removed — CBRMLS
- 2013-09-03 Listed $189,900 CBRMLS
- 1972-06-01 Sold (Public Records) $29,900 Public Records
Property tax history
+5.5%/yrLatest (2025): $1,827 · -4.9% YoY. Source: county tax records.
Cash-flow waterfall
monthlySold comps — $/sqft
last 12 mo · ≤1 miLoading sold comps…