4029 Barnor Dr · Indianapolis city (balance), IN
Flood risk 1/10 · Minimal
- FEMA flood zone
- X (shaded)
- Chance of flooding over 30 yrs
- 0.0%
- Est. flood insurance / yr
- $507 – $1,088
Fire risk 1/10 · Minimal
- Est. fire insurance / yr
- $717 – $1,331
Heat risk 3/10 · Minor
- Hot days now (above 101°F)
- 7 days/yr
- Hot days in 30 yrs
- 18 days/yr
Wind risk 2/10 · Minimal
- Chance of severe wind over 30 yrs
- 1.0%
Air-quality risk 4/10 · Minor
- Unhealthy air days now
- 5 days/yr
- Unhealthy air days in 30 yrs
- 7 days/yr
Risk factors via First Street. Map © Google.
Why this score? — see what drove the C+ grade
The composite is a weighted blend of 9 inputs, each scored 0–100. Each bar is that input's sub-score; the figure is the points it added to the 100-point composite (weight × sub-score).
- Cash flow +22.7/30.0
- ARV discount +15.0/15.0
- DSCR +7.3/10.0
- 1% rule +6.2/10.0
- Rent growth +4.2/5.0
- Livability +2.5/5.0
- Condition / age +2.5/5.0
- Schools +1.4/10.0
- Appreciation +0.0/10.0
$179,900
🖨 Deal sheet 📄 Offer letter ✓ Due diligence
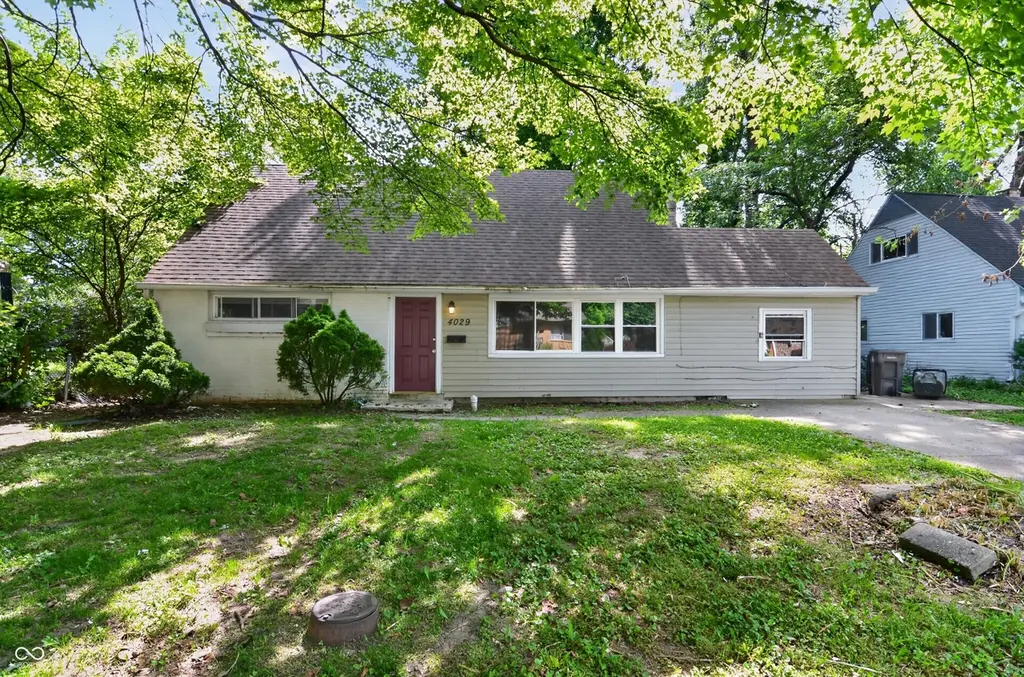
Listing remarks MLS
Nice 4 Bedroom, 2 Bath home with a Large Family Room. Fenced Yard and Concrete Drive.
Key facts
- Generous lot
- Full bathroom
- Comfortable bedrooms
Tags
Property features AI
Exterior
- Parking: Attached garage (1 car)
- Utilities: Public water; Municipal sewer connected; 100 amp electric service; Cable connected
- Home design: Single-family residence; Two levels; East-facing
- Construction: Vinyl siding and brick exterior; Slab foundation
- Exterior features: Chain link fence; Mature trees on the lot
Interior
- Kitchen: Electric oven; Refrigerator; Range hood
- Bedrooms: Four bedrooms total — two on the main level and two on the upper level; Bedroom (approx. 11 x 10); Two additional upper-level bedrooms
- Bathrooms: Two full bathrooms
- Heating & cooling: Forced air heating; Central air conditioning
- Interior features: Eat-in kitchen; Living room (approximately 18 x 14); Dining room (approximately 10 x 10); Laundry room (approximately 6 x 5)
- Laundry & utility: Main-level laundry; Water heater (gas)
Neighborhood map
What this means for you Summary
Snapshot
- This is a 4-bed/1.0-bath single-family listed at $180k.
Deal economics
- At list price, monthly cash flow is $308 ($4k/yr) — positive.
- The deal already cash-flows at list — no discount required.
- Meets the 1% rule at list price ($2k rent vs $180k).
- Cap rate 8.3% vs local median 4.4% in Indianapolis city (balance) — top-decile yield for the area; either an underpriced asset or a hidden risk that comps aren't pricing in. Stress-test before assuming the spread holds.
Location & tenants
- Location reads: area grade C — affects rentability + tenant quality, not the cash-flow math above.
- Indianapolis Public Schools (urban): math 14% / reading 20% proficiency, ranked #286 of 301 in IN (top 95%) — low school quality limits family demand, transient renter base, plan for 1-2y turnover; 77% free/reduced lunch — lower-income household profile, screen leases tightly.
- Zoned schools: Shortridge High School (math 20% / reading 51%, grade F, #263 of 369 statewide, top 72%, 1,089 students, 70% FRL).
- Zoned-school proficiency averages 36% at this address vs 17% district-wide (+18 pts) — the actual schools serving this property are materially stronger than the Indianapolis Public Schools average implies; a family-tenant draw the district grade alone would hide.
- Market conditions: Rents rising fast (+6.8%/yr); 151 active listings in the ZIP; 4 comparable units currently listed for rent nearby; rentals at typical pace (median 24d on market — plan ~3-4 weeks tenant-placement turnaround); 1,906 units permitted in Marion County in 2024 (621 in 5+ unit buildings).
- At $2,019/mo this rent would consume 48% of the median local household income ($50k/yr) (locally 2742% of renters already pay >50% of income on rent) — very limited rent-growth headroom before tenants either downsize or default.
Forward outlook
- Local home prices are declining (-3.0%/yr); year-one equity from $1k of loan paydown is wiped out by about $5k of value loss. Plan a longer hold.
- Marion County population projected at +18% by 2050 — long-run rental-demand tailwind backs the buy-and-hold thesis.
- At projected returns (-3.0% appreciation + 6.8% rent growth), your $50k cash investment doubles in ~9 years — after that, you're playing with house money.
Negotiation context
- Only 13 days on market — expect competitive offers; lowballing is unlikely to land.
- 5 sale attempts since 16y ago with the ask held roughly flat each time — persistent listings suggest the price (not the market) is what's stuck; bring a comps-based counter.
- Current owner paid $45k; list at $180k implies a 300% gain — meaningful room to come down on a strong offer.
Risks & watch-outs
- Watch-outs: built in 1957 — expect roof / HVAC / electrical / plumbing capex.
Questions for the listing agent
- Built in 1957 — when were the roof, HVAC, electrical panel, plumbing, and water heater last replaced?
- Is there a deadline driving the sale (1031 exchange, divorce, estate, relocation)? That informs how much negotiation room exists.
- What's the average days-on-market for RENTAL listings here right now (not sales)? A rising rental-DOM trend means longer vacancies and softer asking-rent achievability than the comps imply.
- What's the recent tenant-quality profile in this submarket — average credit score on applications, eviction rate, late-payment / NSF rate, and stable-employment percentage? A property-management company in the area should have these aggregated.
- How much new for-sale + rental construction is in the pipeline within 1–3 miles? Heavy new supply typically softens prices + rents 12–24 months out; constrained supply supports both.
Investment metrics
- 1% rule
- 1.12% ✓
- Cap rate
- 8.35%
- Cash-on-cash
- 7.33%
- DSCR
- 1.33
- GRM
- 7.4
CMA / ARV
- ARV (on-the-fly)
- $218,764
- Comps found
- 12
Show comp detail 12 sales within ~0.75 mi
| Address | Dist | Beds/Ba | Sqft | Sold | Price | $/sf | Match |
|---|---|---|---|---|---|---|---|
| 4045 Barnor Dr | 0.02mi | 4/2.0 | 2,236 (-7%) | 6mo | $135,000 | $60 | 78 |
| 4062 N Webster Ave | 0.18mi | 3/1.5 (-1) | 2,280 (-5%) | 1mo | $125,000 | $55 | 76 |
| 6142 Meadowlark Dr | 0.35mi | 4/2.0 | 2,236 (-7%) | 10mo | $195,000 | $87 | 60 |
| 3951 N Audubon Rd | 0.53mi | 3/1.5 (-1) | 2,436 (+1%) | 10mo | $162,500 | $67 | 58 |
| 4025 N Campbell Ave | 0.27mi | 3/1.0 (-1) | 2,080 (-14%) | 3mo | $150,000 | $72 | 58 |
| 6629 E 45th St | 0.67mi | 4/2.0 | 2,309 (-4%) | 4mo | $227,700 | $99 | 55 |
| 3920 Priscilla Ave | 0.45mi | 3/1.5 (-1) | 2,080 (-14%) | 0mo | $183,000 | $88 | 49 |
| 4013 Priscilla Ave | 0.39mi | 3/1.0 (-1) | 2,080 (-14%) | 10mo | $195,000 | $94 | 46 |
| 4617 N Kenmore Rd | 0.74mi | 3/2.0 (-1) | 2,268 (-6%) | 3mo | $218,500 | $96 | 45 |
| 5806 E 39th St | 0.49mi | 3/2.5 (-1) | 2,080 (-14%) | 0mo | $190,000 | $91 | 43 |
| 3842 Priscilla Ave | 0.48mi | 3/2.0 (-1) | 2,080 (-14%) | 8mo | $214,000 | $103 | 39 |
| 4337 N Audubon Rd | 0.59mi | 3/1.0 (-1) | 2,080 (-14%) | 10mo | $195,000 | $94 | 37 |
Match score weights: distance 35% · size 25% · config 20% · recency 20%. Top-matched comps best support the ARV.
Projected returns pro-forma
-3.0% appreciation · 6.76% rent growth · sell at horizon
- IRR
- -0.8%
- Equity multiple
- 0.97×
- Total profit
- $-1,558
- Equity at exit
- $26,824
- IRR
- 12.6%
- Equity multiple
- 2.18×
- Total profit
- $59,274
- Equity at exit
- $15,554
Cash invested: $50,372 (down + closing). Projections, not guarantees.
Landlord ↔ Tenant lean methodology
- Overall (STATE)
- 90 Strongly Landlord-Friendly
- State Indiana
- 90 Strongly Landlord-Friendly · R+11
- County
- — inherits STATE
- City
- — inherits STATE
ZIP-level market 46226
- Rents YoY
- 6.8%
- Active inventory
- 151
- Price-to-rent
- 7.4×
Monthly cashflow live
- Estimated rent
- $2,019 medium interval (Pro) →
- Mortgage (P&I)
- −$943
- Tax from tax record
- −$269 /mo · $3,225/yr
- Insurance
- −$75
- HOA
- −$0
- Vacancy / Maint / Mgmt
- −$424
- Net cashflow
- $308
Break-even live
UW: 25.0% down · 7.5% · 30yr · 1.5% tax · 5.0% vac · 8.0% maint · 8.0% mgmt
Financing live
Cash to close
- Down payment
- $44,975
- Closing costs
- $5,397
- Reserves months
- —
- Total cash needed
- —
Loan-product check · same deal, 3 products live
Conventional
25% down · 7.5% · 30yr
- Down + closing
- —
- Monthly P&I
- —
- Monthly cashflow
- —
- DSCR
- —
- Eligible?
- —
Personal DTI + credit; lowest rate.
DSCR
20% down · 8.5% · 30yr
- Down + closing
- —
- Monthly P&I
- —
- Monthly cashflow
- —
- DSCR
- —
- Eligible?
- —
No personal income docs; deal must DSCR.
Hard money
10% down · 12.0% · 12mo
- Down + closing
- —
- Monthly P&I
- —
- Monthly cashflow
- —
- DSCR
- —
- Eligible?
- —
Short-term bridge; refi at stabilization.
Rent comps 4 comps
| Address | Beds | Baths | Sqft | Rent | $/sqft | DOM | Units | Dist |
|---|---|---|---|---|---|---|---|---|
| 3919 Barnor Dr Indianapolis, IN | 5.0 | 2.0 | 1800 | $2,495 | $1.39 | 23d | 1 | 0.10mi |
| 4176 N Irwin Ave Indianapolis, IN | 4.0 | 2.0 | 2006 | $1,595 | $0.80 | 22d | 1 | 0.43mi |
| 3940 N Graham Ave Indianapolis, IN | 3.0 | 1.0 | 2378 | $1,501 | $0.63 | 43d | 1 | 0.48mi |
| 3707 N Riley Ave Indianapolis, IN | 3.0 | 1.5 | 2016 | $1,500 | $0.74 | 23d | 1 | 1.40mi |
Listing history 10 events
-
2026-06-18days on market $179,900 Active 13 DOM
-
2026-06-17days on market $179,900 Active 12 DOM
-
2026-06-16days on market $179,900 Active 11 DOM
-
2026-06-15days on market $179,900 Active 10 DOM
-
2026-06-13days on market $179,900 Active 8 DOM
-
2026-06-13days on market $179,900 Active 7 DOM
-
2026-06-09days on market $179,900 Active 4 DOM
-
2026-06-08days on market $179,900 Active 3 DOM
-
2026-06-07remarks 612-char remark
-
2026-06-07$179,900 Active 2 DOM
ⓘ Source: listings_history table (triggers on properties + properties_extension) + one-shot
backfill from property_details.listing_events for pre-trigger history.
Tax reassessment forecast IN · Partial reset (capped growth)
- Current annual tax
- $3,225 · $269/mo
- Projected year-2 tax
- $3,225 · $269/mo
- Expected delta
- $0/yr ($0/mo · 0.0%)
ⓘ Screening estimate from a state-policy table — verify with the county assessor before closing.
Climate risk First Street
- Flood 1/10 Low FEMA zone X (shaded) · 0% chance over 30 yrs
- Wildfire 1/10 Low
- Heat 3/10 Moderate 7 d/yr ≥101°F today · 18 d/yr by 30 yrs out
- Wind 2/10 Low 100% chance of damaging wind over 30 yrs
- Air quality 4/10 Moderate 5 unhealthy d/yr today · 7 by 30 yrs out
Nearby sold comps map
Loading sold comps map…
Walkable amenities ~0.75 mi
Loading nearby amenities…
Taxation est. · year 1
- Rental income
- $24,228
- − Mortgage interest
- −$10,077
- − Property taxes
- −$3,225
- − Insurance
- −$900
- − Repairs & maintenance
- −$1,938
- − Management
- −$1,938
- − Depreciation
- −$5,233
- Taxable income
- $916
- Est. tax owed @ 24.0%
- −$220
- After-tax cash flow
- $3,475/yr
For passive investors: Depreciation is non-cash, so a rental often shows a tax loss while cash-flowing — sheltering income. Rental losses are passive: they offset passive income freely, and up to $25,000/yr can offset ordinary (W-2) income if you actively participate and your MAGI is under $100k (phasing out to $0 by $150k); unused losses carry forward. On sale, claimed depreciation is recaptured at up to 25%, and gains may owe capital-gains tax (a 1031 exchange can defer both). Figures are a year-1 estimate at your 24.0% rate — not tax advice; consult a CPA.
Schools (NCES district)
- District
- Indianapolis Public Schools
- NCES district ID
- 1804770
- Math proficiency
- 14% ▼ -7.00%
- Reading proficiency
- 20% ▼ -3.00%
- Median HH income
- $32,034
- Composite
- 13.69/100
- National rank
- #9499
- State rank
- #286 of 301 in IN
Livability — Indianapolis city (balance)
No livability data for this city. (Only ~50 U.S. cities are tracked.)
Census & demographics
- Census place
- Indianapolis city (balance), IN
- County
- Marion County · 998,460 people
- City population
- 881,119
- Metro
- Indianapolis-Carmel-Anderson, IN
- Population (ZIP)
- 47,099
- Household income
- $50,325
- Rent vs Own
- Severe rent burden
- 2742.0
Population outlook (Marion County) Hauer SSP2
- Today (2025)
- 1,025,572 people
- By 2030
- 1,065,727 · +3.9%
- By 2040
- 1,141,577 · +11.3%
- By 2050
- 1,208,920 · +17.9%
- By 2075
- 1,367,288 · +33.3%
- By 2100
- 1,438,201 · +40.2%
Race, ethnicity, and origin ACS 2023
- Neighborhood character
- Diverse neighborhood (Simpson 0.62)
- Race & ethnicity
- Black 53% White 25% Hispanic / Latino 17% Two or more races 9% Asian 2%
- Hispanic origin (detail)
- Mexican 11%
- Common ancestry
- Lithuanian 1% Italian 1% Romanian 1%
- Foreign-born
- 11% · Canada
- Languages at home
- 86% English-only · Spanish 10% French/Haitian/Cajun 1% Other Asian/Pacific 1%
Political lean MEDSL · Marion
- 2024 margin
- Strong D (+27.7) · D 63.0% · R 35.3% · Other 1.7%
- 2008→2024 swing
- -0.7pp no change · 2008: 28.4pp · 2024: 27.7pp
- All cycles
- 2024: D+27.7 2020: D+29.1 2016: D+22.8 2012: D+22.2 2008: D+28.4
Not yet ingested
- Civics
- —
Market trends
- HPI YoY
- ▼ -218.85%
- Current HPI
- 239.43
- Rent YoY
- ▲ 6.76%
- Metro
- Indianapolis-Carmel-Anderson, IN
- State GDP YoY
- ▲ 2.90%
- F500 in state
- 18
Industry mix (Fortune 500 HQ in IN)
| Industry | F500 HQs | Revenue |
|---|---|---|
| Industrial Machinery | 2 | $37B |
|
||
| Healthcare | 1 | $177B |
|
||
| Pharmaceuticals | 1 | $45B |
|
||
| Metals / Steel | 1 | $18B |
|
||
| Agriculture | 1 | $17B |
|
||
| Packaging | 1 | $12B |
|
||
Price history
+652.7% since first listed12 events — show timeline
- 2026-06-05 Listed $179,900 MIBOR as Distributed by MLS Grid
- 2017-08-01 Pending — MIBOR as Distributed by MLS Grid
- 2017-08-01 Relisted — MIBOR as Distributed by MLS Grid
- 2017-08-01 Sold (MLS) $45,000 MIBOR as Distributed by MLS Grid
- 2017-04-28 Sold (Public Records) $777,700 Public Records
- 2016-11-23 Pending — MIBOR as Distributed by MLS Grid
- 2016-11-02 Relisted — MIBOR as Distributed by MLS Grid
- 2016-09-30 Listing Removed — MIBOR as Distributed by MLS Grid
- 2015-10-20 Listed $55,000 MIBOR as Distributed by MLS Grid
- 2011-03-23 Listing Removed — MIBOR as Distributed by MLS Grid
- 2011-02-28 Sold (MLS) $22,100 MIBOR as Distributed by MLS Grid
- 2010-08-12 Listed $23,900 MIBOR as Distributed by MLS Grid
Property tax history
+7.5%/yrLatest (2025): $3,225 · -4.1% YoY. Source: county tax records.
Cash-flow waterfall
monthlySold comps — $/sqft
last 12 mo · ≤1 miLoading sold comps…