716 N Grand Unit E2 · Covina, CA
Flood risk 1/10 · Minimal
- FEMA flood zone
- X (unshaded)
- Chance of flooding over 30 yrs
- 0.0%
- Est. flood insurance / yr
- $507 – $1,088
Fire risk 5/10 · Moderate
- Est. fire insurance / yr
- $659 – $1,223
Heat risk 7/10 · Major
- Hot days now (above 98°F)
- 7 days/yr
- Hot days in 30 yrs
- 20 days/yr
Wind risk 1/10 · Minimal
- Chance of severe wind over 30 yrs
- —
Air-quality risk 7/10 · Major
- Unhealthy air days now
- 15 days/yr
- Unhealthy air days in 30 yrs
- 17 days/yr
Risk factors via First Street. Map © Google.
Why this score? — see what drove the B grade
The composite is a weighted blend of 9 inputs, each scored 0–100. Each bar is that input's sub-score; the figure is the points it added to the 100-point composite (weight × sub-score).
- Cash flow +30.0/30.0
- 1% rule +10.0/10.0
- DSCR +10.0/10.0
- ARV discount +7.5/15.0
- Schools +4.7/10.0
- Rent growth +4.3/5.0
- Livability +3.6/5.0
- Condition / age +2.5/5.0
- Appreciation +0.0/10.0
$168,000
🖨 Deal sheet 📄 Offer letter ✓ Due diligence
Listing remarks
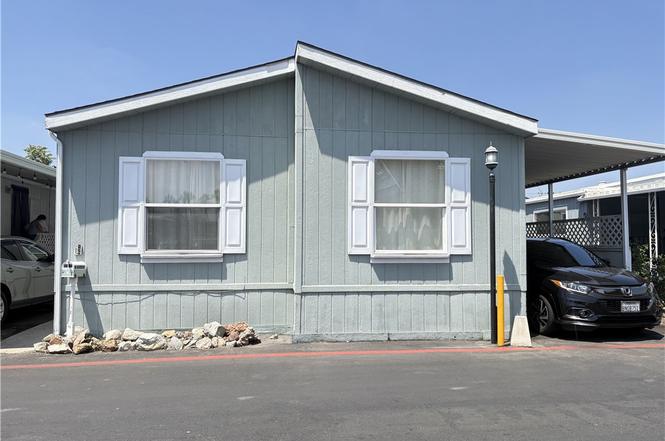
Beautifully maintained 3-bedroom, 2-bath manufactured home located in the desirable Mobil Aire Estates community in Covina. Built in 2000, this spacious home features high ceilings, an open-concept layout, and an inviting living room with an energy-saving skylight that provides abundant natural light. The kitchen opens seamlessly to the main living areas, creating a comfortable and functional space for everyday living and entertaining. Additional features include inside laundry hookups, central air conditioning, and a well-designed floor plan with all bedrooms conveniently located on the main level. Conveniently situated near the 10 Freeway, shopping centers, restaurants, and local amenitie
Key facts
- Open concept kitchen
- Shopping centers
- Restaurants
Tags
Property features AI
Finance
- Other: Lot density approximately 36–40 units per acre; Parcel number 8428022015
- Financial info: Land lease of $1,600 per month (park-managed); rent includes pool
- HOA & community: Park community with shared pool
Exterior
- Parking: Located in Mobil Aire Estates
- Utilities: Public sewer; District/public water
- Home design: Single-story property; Mobile home remains on site (24' x 46'); Living area is an estimated value
- Construction: Estimated year built
- Exterior features: Community pool; Located in a park community
Interior
- Bedrooms: All bedrooms on the first floor
- Bathrooms: 2 full bathrooms
- Heating & cooling: Central cooling
- Interior features: All bedrooms located on the ground floor; One-level home; single-story entry
- Laundry & utility: Indoor laundry with washer hookup
Neighborhood map
What this means for you Summary
Snapshot
- This is a 3-bed/2.0-bath manufactured listed at $168k.
Deal economics
- At list price, monthly cash flow is $1k ($16k/yr) — positive.
- The deal already cash-flows at list — no discount required.
- Meets the 1% rule at list price ($3k rent vs $168k).
- Cap rate 15.7% vs local median 2.4% in Covina — top-decile yield for the area; either an underpriced asset or a hidden risk that comps aren't pricing in. Stress-test before assuming the spread holds.
Location & tenants
- Location reads 72/100 on livability (#181 in CA) — a middle-class / working-renter tenant base. Strengths: amenities A+, commute A+, employment A+; Watch: schools C-, crime C-, health & safety C-.
- Charter Oak Unified (suburban): math 45% / reading 55% proficiency, ranked #387 of 1,400 in CA (top 28%) — acceptable for families but not a draw, mixed tenant base, ~2y average lease.
- Market conditions: Rents rising fast (+7.2%/yr); 31 active listings in the ZIP; 34 comparable units currently listed for rent nearby; rentals leasing fast (median 13d on market — plan ~1-2 weeks tenant-placement turnaround); solid renter incomes; 19,697 units permitted in Los Angeles County in 2024 (9,426 in 5+ unit buildings).
- This rent runs 38% of the median local income ($94k/yr) — at the standard rent-burdened threshold; future hikes will face affordability resistance.
Forward outlook
- Local home prices are declining (-3.0%/yr); year-one equity from $1k of loan paydown is wiped out by about $5k of value loss. Plan a longer hold.
- Los Angeles County population projected at +9% by 2050 — modest demand growth; plan on rents tracking national, not racing it.
- At projected returns (-3.0% appreciation + 7.2% rent growth), your $47k cash investment doubles in ~4 years — after that, you're playing with house money.
Negotiation context
- Only 1 days on market — expect competitive offers; lowballing is unlikely to land.
- 15 sale attempts since 8y ago with the ask held roughly flat each time — persistent listings suggest the price (not the market) is what's stuck; bring a comps-based counter.
Risks & watch-outs
- Climate carrying-cost: moderate wildfire risk; extreme-heat days projected 7→20/yr by 2055 (HVAC capex compounding) — expect insurance premiums to compound above CPI over the hold.
Questions for the listing agent
- Is there a deadline driving the sale (1031 exchange, divorce, estate, relocation)? That informs how much negotiation room exists.
- What's the average days-on-market for RENTAL listings here right now (not sales)? A rising rental-DOM trend means longer vacancies and softer asking-rent achievability than the comps imply.
- What's the recent tenant-quality profile in this submarket — average credit score on applications, eviction rate, late-payment / NSF rate, and stable-employment percentage? A property-management company in the area should have these aggregated.
- How much new for-sale + rental construction is in the pipeline within 1–3 miles? Heavy new supply typically softens prices + rents 12–24 months out; constrained supply supports both.
Investment metrics
- 1% rule
- 1.75% ✓
- Cap rate
- 15.72%
- Cash-on-cash
- 33.67%
- DSCR
- 2.50
- GRM
- 4.8
CMA / ARV
- ARV (median comp)
- $98,903
- List price
- $168,000
- Delta
- 70.87%
- Verdict
- OVERPRICED
- Comps
- 20 within 1.0 mi
Show comp detail 3 sales within ~0.75 mi
| Address | Dist | Beds/Ba | Sqft | Sold | Price | $/sf | Match |
|---|---|---|---|---|---|---|---|
| 716 N Grand Ave Unit F-8 | 0.00mi | 2/2.0 (-1) | 1,080 (0%) | 5mo | $89,900 | $83 | 91 |
| 716 N Grand Ave N Unit A8 | 0.00mi | 3/2.0 | 1,152 (+7%) | 1mo | $115,000 | $100 | 88 |
| 716 N Grand Unit I3 | 0.05mi | 3/2.0 | 1,022 (-5%) | 4mo | $219,900 | $215 | 86 |
Match score weights: distance 35% · size 25% · config 20% · recency 20%. Top-matched comps best support the ARV.
Projected returns pro-forma
-3.0% appreciation · 7.23% rent growth · sell at horizon
- IRR
- 33.4%
- Equity multiple
- 2.49×
- Total profit
- $69,869
- Equity at exit
- $25,049
- IRR
- 42.4%
- Equity multiple
- 5.83×
- Total profit
- $227,417
- Equity at exit
- $14,526
Cash invested: $47,040 (down + closing). Projections, not guarantees.
Landlord ↔ Tenant lean methodology
- Overall (STATE)
- 18 Strongly Tenant-Friendly
- State California
- 18 Strongly Tenant-Friendly · D+13
- County
- — inherits STATE
- City
- — inherits STATE
ZIP-level market 91723
- Rents YoY
- 7.2%
- Active inventory
- 31
- Price-to-rent
- 4.8×
Monthly cashflow live
- Estimated rent
- $2,945 high interval (Pro) →
- Mortgage (P&I)
- −$881
- Tax from tax record
- −$56 /mo · $668/yr
- Insurance
- −$70
- HOA
- −$0
- Vacancy / Maint / Mgmt
- −$618
- Net cashflow
- $1,320
Break-even live
UW: 25.0% down · 7.5% · 30yr · 1.5% tax · 5.0% vac · 8.0% maint · 8.0% mgmt
Financing live
Cash to close
- Down payment
- $42,000
- Closing costs
- $5,040
- Reserves months
- —
- Total cash needed
- —
Loan-product check · same deal, 3 products live
Conventional
25% down · 7.5% · 30yr
- Down + closing
- —
- Monthly P&I
- —
- Monthly cashflow
- —
- DSCR
- —
- Eligible?
- —
Personal DTI + credit; lowest rate.
DSCR
20% down · 8.5% · 30yr
- Down + closing
- —
- Monthly P&I
- —
- Monthly cashflow
- —
- DSCR
- —
- Eligible?
- —
No personal income docs; deal must DSCR.
Hard money
10% down · 12.0% · 12mo
- Down + closing
- —
- Monthly P&I
- —
- Monthly cashflow
- —
- DSCR
- —
- Eligible?
- —
Short-term bridge; refi at stabilization.
Rent comps 34 comps
| Address | Beds | Baths | Sqft | Rent | $/sqft | DOM | Units | Dist |
|---|---|---|---|---|---|---|---|---|
| 959 E Edgecomb St Covina, CA | 3.0 | 2.0 | 1335 | $5,000 | $3.75 | 2d | 1 | 0.15mi |
| 367 N Prospero Dr Covina, CA | 2.0 | 2.0 | 1000 | $1,950 | $1.95 | 7d | 1 | 0.51mi |
| 554 E Hurst St Unit 2 Covina, CA | 2.0 | 1.0 | 866 | $2,650 | $3.06 | 5d | 1 | 0.52mi |
| 628 E Italia St Unit 3 Covina, CA | 2.0 | 1.5 | 900 | $1,850 | $2.06 | 7d | 1 | 0.54mi |
| 1061 N Glendora Ave Covina, CA | 2.0 | 2.0 | 1212 | $2,850 | $2.35 | 43d | 1 | 0.56mi |
| 826 N Barranca Ave Covina, CA | 1.0–2.0 | 1.0–2.0 | 762 | $2,295 | $3.01 | 43d | 2 | 0.57mi |
| 4830 N Brightview Dr Covina, CA | 4.0 | 3.0 | 1497 | $3,650 | $2.44 | 20d | 1 | 0.57mi |
| 501 E Hurst St Unit 2 Covina, CA | 2.0 | 1.0 | 866 | $1,900 | $2.19 | 2d | 1 | 0.59mi |
| 19531 E Cienega Ave Unit 208 Covina, CA | 2.0 | 2.0 | 850 | $2,195 | $2.58 | 19d | 1 | 0.72mi |
| 111 S Barranca Ave Covina, CA | 2.0 | 1.0 | 957 | $2,445 | $2.55 | 13d | 1 | 0.78mi |
| 417 E Badillo St Covina, CA | 2.0 | 1.5 | 1150 | $2,550 | $2.22 | 19d | 1 | 0.81mi |
| 1400 N Grand Ave Covina, CA | 1.0–2.0 | 1.0–2.0 | 846 | $2,720 | $3.22 | 1d | 5 | 0.83mi |
| 345 E College St Covina, CA | 2.0 | 2.0 | 1300 | $2,795 | $2.15 | 24d | 1 | 0.87mi |
| 445 E Puente St Covina, CA | 2.0 | 1.0 | 992 | $2,900 | $2.92 | 20d | 1 | 0.96mi |
| 321 S San Jose Ave Covina, CA | 2.0 | 2.0 | 1090 | $2,595 | $2.38 | 16d | 2 | 0.99mi |
| 707 N Park Ave Covina, CA | 2.0 | 2.0 | 900 | $2,900 | $3.22 | 43d | 1 | 1.06mi |
| 320 S 1st Ave Covina, CA | 2.0 | 2.0 | 1090 | $2,595 | $2.38 | 17d | 1 | 1.07mi |
| 20240 E Arrow Hwy Unit D Covina, CA | 3.0 | 2.5 | 1477 | $3,350 | $2.27 | 43d | 1 | 1.15mi |
| 20254 E Arrow Hwy Unit B Covina, CA | 3.0 | 2.5 | 1477 | $3,100 | $2.10 | 24d | 1 | 1.16mi |
| 532 Stewart Dr Covina, CA | 2.0 | 1.0 | 800 | $2,600 | $3.25 | 7d | 1 | 1.17mi |
| 228 E Puente St Unit 230 Covina, CA | 2.0 | 1.0 | 1080 | $2,550 | $2.36 | 16d | 1 | 1.18mi |
| 1632 S Glendora Ave Glendora, CA | 3.0 | 2.0 | 1000 | $3,200 | $3.20 | 6d | 1 | 1.18mi |
| 1620 S Glendora Ave Glendora, CA | 3.0 | 2.0 | 1450 | $3,500 | $2.41 | 6d | 1 | 1.23mi |
| 200 N Grand Ave West Covina, CA | 1.0–3.0 | 1.0–2.0 | 860 | $3,342 | $3.89 | 1d | 12 | 1.25mi |
| 141 S 3rd Ave Covina, CA | 3.0 | 2.0 | 1151 | $3,300 | $2.87 | 7d | 1 | 1.34mi |
| 18645 E Arrow Hwy Covina, CA | 2.0 | — | 919 | $2,129 | $2.32 | 13d | 1 | 1.37mi |
| 440 W Gladstone St Glendora, CA | 1.0–2.0 | 1.0–2.0 | 875 | $2,390 | $2.73 | 1d | 9 | 1.38mi |
| 18537 E Arrow Hwy Covina, CA | 1.0–2.0 | 1.0–2.5 | 937 | $2,650 | $2.83 | 4d | 7 | 1.39mi |
| 228 W Center St Unit 5 Covina, CA | 3.0 | 2.0 | 1350 | $3,130 | $2.32 | 43d | 1 | 1.39mi |
| 228 W Center St Unit 5 Covina, CA | 3.0 | 2.0 | 1350 | $3,150 | $2.33 | 10d | 1 | 1.39mi |
| 1145 N Barston Ave Covina, CA | 2.0 | 1.0 | 836 | $2,300 | $2.75 | 7d | 1 | 1.40mi |
| 670 S 2nd Ave Covina, CA | 2.0 | 1.0 | 700 | $2,495 | $3.56 | 43d | 1 | 1.43mi |
| 20983 E Covina Blvd Covina, CA | 2.0 | 2.0 | 962 | $2,500 | $2.60 | 24d | 1 | 1.46mi |
| 435 W Gladstone St Glendora, CA | 2.0 | 2.0 | 1200 | $2,994 | $2.49 | 1d | 2 | 1.48mi |
Listing history 44 events
-
2026-06-18pricedays on market $168,000 Active 1 DOM
-
2026-06-17days on market $169,000 Active 93 DOM
-
2026-06-16days on market $169,000 Active 92 DOM
-
2026-06-15days on market $169,000 Active 91 DOM
-
2026-06-13days on market $169,000 Active 89 DOM
-
2026-06-13days on market $169,000 Active 88 DOM
-
2026-06-09days on market $169,000 Active 85 DOM
-
2026-06-08days on market $169,000 Active 84 DOM
-
2026-06-07days on market $169,000 Active 83 DOM
-
2026-06-04days on market $169,000 Active 80 DOM
-
2026-06-03days on market $169,000 Active 79 DOM
-
2026-06-02days on market $169,000 Active 78 DOM
-
2026-06-01days on market $169,000 Active 77 DOM
-
2026-05-31days on market $169,000 Active 76 DOM
-
2026-05-06price $169,000 956-char remark
-
2026-04-28price $172,000 956-char remark
-
2026-03-16$175,000 Active 956-char remark
-
2026-03-04historical
-
2026-02-11price $169,999
-
2026-02-04$175,000 Active
-
2025-12-31historical
-
2025-12-15price $179,000
-
2025-11-24$180,000 Active
-
2025-10-31historical
-
2025-10-09$180,000 Active
-
2025-09-30historical
-
2025-07-30$189,000 Active
-
2021-10-17historical
-
2021-10-16status Active
-
2021-07-22$89,500 Active
-
2019-01-02status Active
-
2019-01-02historical Hold Do Not Show
-
2018-12-01status Active
-
2018-12-01historical Hold Do Not Show
-
2018-10-07historical Hold Do Not Show
-
2018-10-06status Active
-
2018-09-27status Active
-
2018-09-27historical Hold Do Not Show
-
2018-09-19status Active
-
2018-09-19historical Hold Do Not Show
-
2018-08-10status Active
-
2018-08-10historical Hold Do Not Show
-
2018-08-02historical Hold Do Not Show
-
2018-07-25$36,000 Active
ⓘ Source: listings_history table (triggers on properties + properties_extension) + one-shot
backfill from property_details.listing_events for pre-trigger history.
Tax reassessment forecast CA · Resets to sale price
- Current annual tax
- $668 · $56/mo
- Projected year-2 tax
- $1,277 · $106/mo
- Expected delta
- +$609/yr (+$51/mo · 91.1%)
ⓘ Screening estimate from a state-policy table — verify with the county assessor before closing.
Climate risk First Street
- Flood 1/10 Low FEMA zone X (unshaded) · 0% chance over 30 yrs
- Wildfire 5/10 Major
- Heat 7/10 Severe 7 d/yr ≥98°F today · 20 d/yr by 30 yrs out
- Wind 1/10 Low
- Air quality 7/10 Severe 15 unhealthy d/yr today · 17 by 30 yrs out
Nearby sold comps map
Loading sold comps map…
Walkable amenities ~0.75 mi
Loading nearby amenities…
Taxation est. · year 1
- Rental income
- $35,343
- − Mortgage interest
- −$9,411
- − Property taxes
- −$668
- − Insurance
- −$840
- − Repairs & maintenance
- −$2,827
- − Management
- −$2,827
- − Depreciation
- −$4,887
- Taxable income
- $13,882
- Est. tax owed @ 24.0%
- −$3,332
- After-tax cash flow
- $12,509/yr
For passive investors: Depreciation is non-cash, so a rental often shows a tax loss while cash-flowing — sheltering income. Rental losses are passive: they offset passive income freely, and up to $25,000/yr can offset ordinary (W-2) income if you actively participate and your MAGI is under $100k (phasing out to $0 by $150k); unused losses carry forward. On sale, claimed depreciation is recaptured at up to 25%, and gains may owe capital-gains tax (a 1031 exchange can defer both). Figures are a year-1 estimate at your 24.0% rate — not tax advice; consult a CPA.
Schools (NCES district)
- District
- Charter Oak Unified
- NCES district ID
- 0608190
- Math proficiency
- 45% ▲ 2.00%
- Reading proficiency
- 55% ▲ 4.00%
- Median HH income
- $72,756
- Composite
- 46.95/100
- National rank
- #5160
- State rank
- #387 of 1400 in CA
Livability — Covina
- Score
- 72/100
- State rank
- #181
- US rank
- #5811
Category grades
Schools grade is shown separately in the Schools card above.
Census & demographics
- Census place
- Covina, CA
- County
- Los Angeles County · 9,444,647 people
- City population
- 81,184
- Metro
- Los Angeles-Long Beach-Anaheim, CA
- Population (ZIP)
- 17,733
- Household income
- $94,167
- Rent vs Own
- Severe rent burden
- 792.0
Population outlook (Los Angeles County) Hauer SSP2
- Today (2025)
- 10,940,515 people
- By 2030
- 11,256,481 · +2.9%
- By 2040
- 11,729,929 · +7.2%
- By 2050
- 11,948,407 · +9.2%
- By 2075
- 11,818,114 · +8.0%
- By 2100
- 10,842,928 · -0.9%
Race, ethnicity, and origin ACS 2023
- Neighborhood character
- Diverse neighborhood (Simpson 0.55)
- Race & ethnicity
- Hispanic / Latino 63% Two or more races 22% White 19% Asian 11% Black 4% Native American 1%
- Hispanic origin (detail)
- Mexican 52% Cuban 1%
- Common ancestry
- Lithuanian 1% Russian 1% Iranian 1%
- Foreign-born
- 22% · Canada, China, Vietnam
- Languages at home
- 56% English-only · Spanish 33% Chinese 3% Tagalog/Filipino 2%
Political lean MEDSL · Los Angeles
- 2024 margin
- Solid D (+32.9) · D 64.8% · R 31.9% · Other 3.3%
- 2008→2024 swing
- -7.4pp toward R · 2008: 40.4pp · 2024: 32.9pp
- All cycles
- 2024: D+32.9 2020: D+44.2 2016: D+48.0 2012: D+40.0 2008: D+40.4
Not yet ingested
- Civics
- —
Market trends
- HPI YoY
- ▼ -540.18%
- Current HPI
- 426.3313
- Rent YoY
- ▲ 7.23%
- Metro
- Los Angeles-Long Beach-Anaheim, CA
- State GDP YoY
- ▲ 3.21%
- F500 in state
- 116
Industry mix (Fortune 500 HQ in CA)
| Industry | F500 HQs | Revenue |
|---|---|---|
| Technology | 27 | $1,492B |
|
||
| Financial Services | 3 | $174B |
|
||
| Retail | 3 | $44B |
|
||
| Insurance | 3 | $26B |
|
||
| Media / Entertainment | 2 | $115B |
|
||
| Pharmaceuticals / Biotech | 2 | $62B |
|
||
Price history
+366.7% since first listed32 events — show timeline
- 2026-06-17 Listed $168,000 CRMLS
- 2026-06-16 Listing Removed — CRMLS
- 2026-05-06 Price Changed $169,000 CRMLS
- 2026-04-28 Price Changed $172,000 CRMLS
- 2026-03-16 Listed $175,000 CRMLS
- 2026-03-04 Listing Removed — CRMLS
- 2026-02-11 Price Changed $169,999 CRMLS
- 2026-02-04 Listed $175,000 CRMLS
- 2025-12-31 Listing Removed — CRMLS
- 2025-12-15 Price Changed $179,000 CRMLS
- 2025-11-24 Listed $180,000 CRMLS
- 2025-10-31 Listing Removed — CRMLS
- 2025-10-09 Listed $180,000 CRMLS
- 2025-09-30 Listing Removed — CRMLS
- 2025-07-30 Listed $189,000 CRMLS
- 2021-10-17 Listing Removed — CRMLS
- 2021-10-16 Relisted — CRMLS
- 2021-07-22 Listed $89,500 CRMLS
- 2019-01-02 Relisted — CRMLS
- 2019-01-02 Delisted — CRMLS
- 2018-12-01 Relisted — CRMLS
- 2018-12-01 Delisted — CRMLS
- 2018-10-07 Delisted — CRMLS
- 2018-10-06 Relisted — CRMLS
- 2018-09-27 Relisted — CRMLS
- 2018-09-27 Delisted — CRMLS
- 2018-09-19 Relisted — CRMLS
- 2018-09-19 Delisted — CRMLS
- 2018-08-10 Relisted — CRMLS
- 2018-08-10 Delisted — CRMLS
- 2018-08-02 Delisted — CRMLS
- 2018-07-25 Listed $36,000 CRMLS
Property tax history
+4.9%/yrLatest (2025): $668 · +4.9% YoY. Source: county tax records.
Cash-flow waterfall
monthlySold comps — $/sqft
last 12 mo · ≤1 miLoading sold comps…