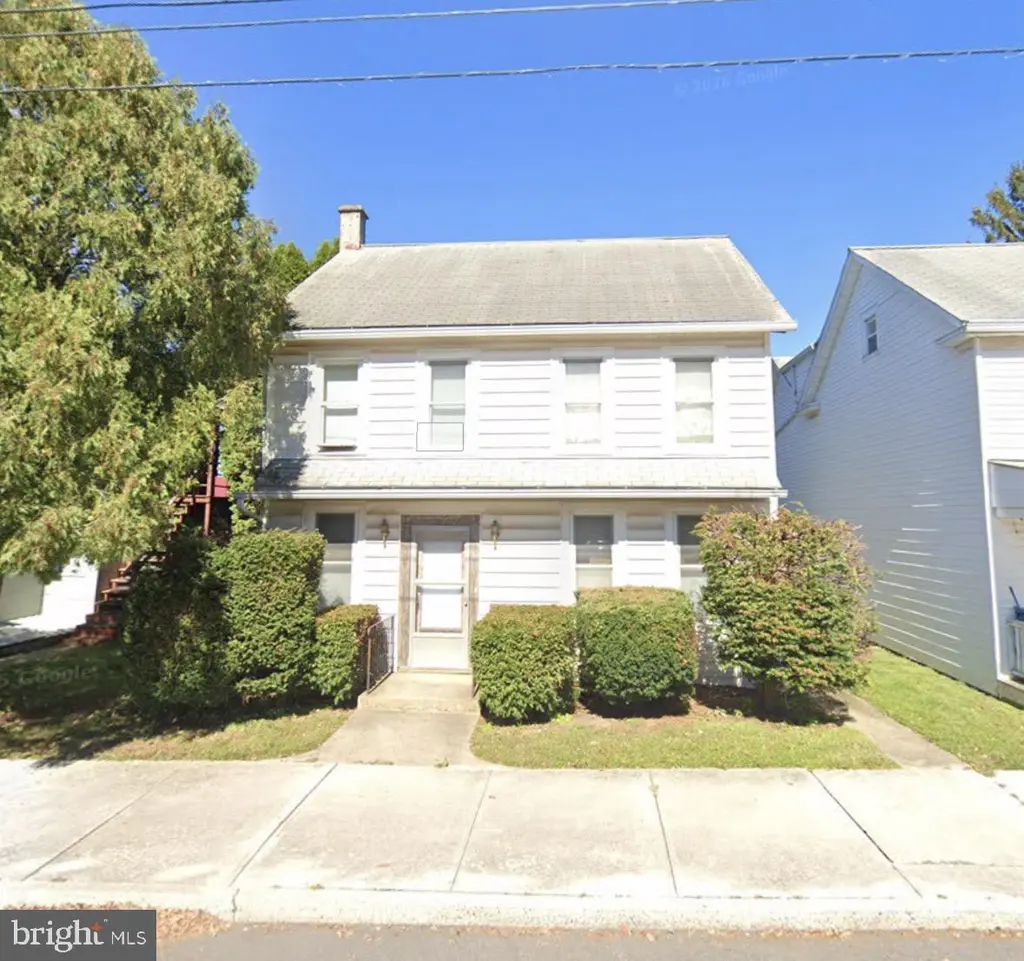
318 W High St · Hummelstown, PA
Flood risk 1/10 · Minimal
- FEMA flood zone
- X (unshaded)
- Chance of flooding over 30 yrs
- 0.0%
- Est. flood insurance / yr
- $473 – $860
Fire risk 1/10 · Minimal
- Est. fire insurance / yr
- $511 – $949
Heat risk 5/10 · Moderate
- Hot days now (above 100°F)
- 7 days/yr
- Hot days in 30 yrs
- 15 days/yr
Wind risk 3/10 · Minor
- Chance of severe wind over 30 yrs
- 7.0%
Air-quality risk 3/10 · Minor
- Unhealthy air days now
- 3 days/yr
- Unhealthy air days in 30 yrs
- 4 days/yr
Risk factors via First Street. Map © Google.
Why this score? — see what drove the B grade
The composite is a weighted blend of 9 inputs, each scored 0–100. Each bar is that input's sub-score; the figure is the points it added to the 100-point composite (weight × sub-score).
- Cash flow +30.0/30.0
- 1% rule +10.0/10.0
- DSCR +10.0/10.0
- ARV discount +7.5/15.0
- Schools +4.6/10.0
- Livability +3.7/5.0
- Rent growth +2.6/5.0
- Condition / age +2.5/5.0
- Appreciation +0.0/10.0
$80,000
🖨 Deal sheet 📄 Offer letter ✓ Due diligence
Listing remarks
* * * Not an arm's length transaction. * * * 2 story home in Hummelstown Borough in need of much repair.
Key facts
- 7,841 sq ft lot
- Built 1900
Neighborhood map
What this means for you Summary
Snapshot
- This is a 3-bed/1.0-bath single-family listed at $80k.
Deal economics
- At list price, monthly cash flow is $983 ($12k/yr) — positive.
- The deal already cash-flows at list — no discount required.
- Meets the 1% rule at list price ($2k rent vs $80k).
- Cap rate 21.0% vs local median 4.4% in Hummelstown — top-decile yield for the area; either an underpriced asset or a hidden risk that comps aren't pricing in. Stress-test before assuming the spread holds.
Location & tenants
- Location reads 74/100 on livability (#528 in PA, #4,888 nationally) — a middle-class / working-renter tenant base. Strengths: cost of living A+, housing A+, employment B+; Watch: crime C-, amenities F, commute F.
- Lower Dauphin SD (suburban): math 45% / reading 59% proficiency, ranked #130 of 539 in PA (top 24%) — acceptable for families but not a draw, mixed tenant base, ~2y average lease; only 18% free/reduced lunch — higher-income household profile.
- Zoned schools: Lower Dauphin Hs (math 82%, 1,085 students, 22% FRL) — zoned schools at 22% FRL track the district average.
- Market conditions: Rents flat; 106 active listings in the ZIP; 11 comparable units currently listed for rent nearby; rentals lingering (median 44d on market — plan ~5-8 weeks vacancy on turnover, expect pricing pressure); 55% of comp listings sitting > 30 days — soft ceiling on asking rent; high-income renter base; 540 units permitted in Dauphin County in 2024 (194 in 5+ unit buildings).
Forward outlook
- Local home prices are declining (-3.0%/yr); year-one equity from $553 of loan paydown is wiped out by about $2k of value loss. Plan a longer hold.
- At projected returns (-3.0% appreciation + 0.6% rent growth), your $22k cash investment doubles in ~3 years — after that, you're playing with house money.
Negotiation context
- Only 0 days on market — expect competitive offers; lowballing is unlikely to land.
- Current owner paid $36k; list at $80k implies a 122% gain — meaningful room to come down on a strong offer.
Risks & watch-outs
- Watch-outs: property tax is 4.1% of price; built in 1900 — expect roof / HVAC / electrical / plumbing capex.
- Climate carrying-cost: extreme-heat days projected 7→15/yr by 2055 (HVAC capex compounding) — expect insurance premiums to compound above CPI over the hold.
Questions for the listing agent
- Built in 1900 — when were the roof, HVAC, electrical panel, plumbing, and water heater last replaced?
- Property tax is high relative to price — has the assessment been appealed recently, and will the sale trigger a re-assessment?
- Is there a deadline driving the sale (1031 exchange, divorce, estate, relocation)? That informs how much negotiation room exists.
- Schools are A-rated — typically a magnet for longer-tenancy family renters. What's the average tenant stay here, and is there a school-zone premium baked into asking?
- What's the average days-on-market for RENTAL listings here right now (not sales)? A rising rental-DOM trend means longer vacancies and softer asking-rent achievability than the comps imply.
- What's the recent tenant-quality profile in this submarket — average credit score on applications, eviction rate, late-payment / NSF rate, and stable-employment percentage? A property-management company in the area should have these aggregated.
- How much new for-sale + rental construction is in the pipeline within 1–3 miles? Heavy new supply typically softens prices + rents 12–24 months out; constrained supply supports both.
Investment metrics
- 1% rule
- 2.70% ✓
- Cap rate
- 21.03%
- Cash-on-cash
- 52.64%
- DSCR
- 3.34
- GRM
- 3.1
CMA / ARV
- ARV (on-the-fly)
- $330,600
- Comps found
- 12
Show comp detail 12 sales within ~0.75 mi
| Address | Dist | Beds/Ba | Sqft | Sold | Price | $/sf | Match |
|---|---|---|---|---|---|---|---|
| 120 Holly St | 0.07mi | 3/1.5 | 1,750 (+1%) | 9mo | $365,000 | $209 | 87 |
| 291 Birch Ln | 0.23mi | 2/1.0 (-1) | 1,655 (-5%) | 1mo | $360,000 | $218 | 76 |
| 235 W 2nd St | 0.21mi | 3/1.0 | 1,611 (-7%) | 4mo | $222,500 | $138 | 75 |
| 603 W High St | 0.24mi | 3/1.0 | 1,659 (-5%) | 12mo | $315,000 | $190 | 71 |
| 115 N Landis St | 0.19mi | 4/2.0 (+1) | 1,696 (-2%) | 12mo | $272,000 | $160 | 68 |
| 257 Willow St | 0.46mi | 3/2.0 | 1,792 (+3%) | 6mo | $350,000 | $195 | 64 |
| 265 Redwood St | 0.39mi | 3/1.5 | 1,592 (-8%) | 7mo | $345,000 | $217 | 60 |
| 123 Graystone Dr | 0.42mi | 4/2.5 (+1) | 1,908 (+10%) | 4mo | $426,749 | $224 | 50 |
| 27 Crescent St | 0.59mi | 3/2.0 | 1,883 (+8%) | 6mo | $330,000 | $175 | 50 |
| 211 N East St | 0.60mi | 3/3.0 | 1,826 (+5%) | 11mo | $345,000 | $189 | 47 |
| 416 N Duke St | 0.60mi | 3/2.5 | 1,960 (+13%) | 2mo | $322,500 | $165 | 43 |
| 112 Park Ave | 0.57mi | 3/2.5 | 1,964 (+13%) | 7mo | $334,900 | $171 | 40 |
Match score weights: distance 35% · size 25% · config 20% · recency 20%. Top-matched comps best support the ARV.
Projected returns pro-forma
-3.0% appreciation · 0.55% rent growth · sell at horizon
- IRR
- 47.6%
- Equity multiple
- 2.99×
- Total profit
- $44,556
- Equity at exit
- $11,928
- IRR
- 52.1%
- Equity multiple
- 5.45×
- Total profit
- $99,625
- Equity at exit
- $6,917
Cash invested: $22,400 (down + closing). Projections, not guarantees.
Landlord ↔ Tenant lean methodology
- Overall (STATE)
- 62 Landlord-Friendly
- State Pennsylvania
- 62 Landlord-Friendly · EVEN
- County
- — inherits STATE
- City
- — inherits STATE
ZIP-level market 17036
- Home prices YoY
- -28.4%
- Rents YoY
- 0.6%
- Active inventory
- 106
- Price-to-rent
- 3.1×
Monthly cashflow live
- Estimated rent
- $2,162 high interval (Pro) →
- Mortgage (P&I)
- −$420
- Tax from tax record
- −$272 /mo · $3,266/yr
- Insurance
- −$33
- HOA
- −$0
- Vacancy / Maint / Mgmt
- −$454
- Net cashflow
- $983
Break-even live
UW: 25.0% down · 7.5% · 30yr · 1.5% tax · 5.0% vac · 8.0% maint · 8.0% mgmt
Financing live
Cash to close
- Down payment
- $20,000
- Closing costs
- $2,400
- Reserves months
- —
- Total cash needed
- —
Loan-product check · same deal, 3 products live
Conventional
25% down · 7.5% · 30yr
- Down + closing
- —
- Monthly P&I
- —
- Monthly cashflow
- —
- DSCR
- —
- Eligible?
- —
Personal DTI + credit; lowest rate.
DSCR
20% down · 8.5% · 30yr
- Down + closing
- —
- Monthly P&I
- —
- Monthly cashflow
- —
- DSCR
- —
- Eligible?
- —
No personal income docs; deal must DSCR.
Hard money
10% down · 12.0% · 12mo
- Down + closing
- —
- Monthly P&I
- —
- Monthly cashflow
- —
- DSCR
- —
- Eligible?
- —
Short-term bridge; refi at stabilization.
Rent comps 11 comps
| Address | Beds | Baths | Sqft | Rent | $/sqft | DOM | Units | Dist |
|---|---|---|---|---|---|---|---|---|
| 105 N Walnut St Hummelstown, PA | 4.0 | 1.5 | 1496 | $1,700 | $1.14 | 43d | 1 | 0.18mi |
| 116 E 2nd St Hummelstown, PA | 3.0 | 1.0 | 1400 | $1,700 | $1.21 | 21d | 1 | 0.60mi |
| 210 Division St Hummelstown, PA | 3.0 | 1.0 | 1340 | $2,200 | $1.64 | 43d | 1 | 0.71mi |
| 215 Division St Hummelstown, PA | 3.0 | 2.0 | 1980 | $2,750 | $1.39 | 14d | 1 | 0.74mi |
| 670 Whitetail Dr Hummelstown, PA | 2.0 | 2.0 | 1332 | $2,000 | $1.50 | 14d | 1 | 1.00mi |
| 2134 Red Fox Dr Hummelstown, PA | 3.0 | 2.5 | 2180 | $2,350 | $1.08 | 43d | 1 | 1.12mi |
| 861 Fawn Ln Hummelstown, PA | 3.0 | 2.5 | 1726 | $2,300 | $1.33 | 21d | 1 | 1.14mi |
| 861 Fawn Ln Hummelstown, PA | 3.0 | 2.5 | 1726 | $1,995 | $1.16 | 14d | 1 | 1.14mi |
| 688 Stoverdale Rd Hummelstown, PA | 3.0 | 2.5 | 1980 | $2,500 | $1.26 | 43d | 1 | 1.21mi |
| 1959 Deer Run Dr Hummelstown, PA | 2.0 | 3.0 | 2000 | $2,550 | $1.27 | 43d | 1 | 1.21mi |
| 2086 Deer Run Dr Hummelstown, PA | 2.0 | 2.5 | 1994 | $2,150 | $1.08 | 43d | 1 | 1.22mi |
Listing history 2 events
-
2026-06-02remarks 109-char remark
-
2026-06-02$80,000 Pending
ⓘ Source: listings_history table (triggers on properties + properties_extension) + one-shot
backfill from property_details.listing_events for pre-trigger history.
Tax reassessment forecast PA · Partial reset (capped growth)
- Current annual tax
- $3,266 · $272/mo
- Projected year-2 tax
- $3,266 · $272/mo
- Expected delta
- $0/yr ($0/mo · 0.0%)
ⓘ Screening estimate from a state-policy table — verify with the county assessor before closing.
Climate risk First Street
- Flood 1/10 Low FEMA zone X (unshaded) · 0% chance over 30 yrs
- Wildfire 1/10 Low
- Heat 5/10 Major 7 d/yr ≥100°F today · 15 d/yr by 30 yrs out
- Wind 3/10 Moderate 7% chance of damaging wind over 30 yrs
- Air quality 3/10 Moderate 3 unhealthy d/yr today · 4 by 30 yrs out
Nearby sold comps map
Loading sold comps map…
Walkable amenities ~0.75 mi
Loading nearby amenities…
Taxation est. · year 1
- Rental income
- $25,939
- − Mortgage interest
- −$4,481
- − Property taxes
- −$3,266
- − Insurance
- −$400
- − Repairs & maintenance
- −$2,075
- − Management
- −$2,075
- − Depreciation
- −$2,327
- Taxable income
- $11,314
- Est. tax owed @ 24.0%
- −$2,715
- After-tax cash flow
- $9,076/yr
For passive investors: Depreciation is non-cash, so a rental often shows a tax loss while cash-flowing — sheltering income. Rental losses are passive: they offset passive income freely, and up to $25,000/yr can offset ordinary (W-2) income if you actively participate and your MAGI is under $100k (phasing out to $0 by $150k); unused losses carry forward. On sale, claimed depreciation is recaptured at up to 25%, and gains may owe capital-gains tax (a 1031 exchange can defer both). Figures are a year-1 estimate at your 24.0% rate — not tax advice; consult a CPA.
Schools (NCES district)
- District
- Lower Dauphin SD
- NCES district ID
- 4214100
- Math proficiency
- 45% ▼ -10.00%
- Reading proficiency
- 59% ▼ -13.00%
- Median HH income
- $67,760
- Composite
- 46.09/100
- National rank
- #2513
- State rank
- #130 of 539 in PA
Livability — Hummelstown
- Score
- 74/100
- State rank
- #528
- US rank
- #4888
Category grades
Schools grade is shown separately in the Schools card above.
Census & demographics
- Census place
- Hummelstown, PA
- County
- Dauphin County · 247,857 people
- City population
- 23,520
- Metro
- Harrisburg-Carlisle, PA
- Population (ZIP)
- 23,520
- Household income
- $115,533
- Rent vs Own
- Severe rent burden
- 357.0
Population outlook (Dauphin County) Hauer SSP2
- Today (2025)
- 281,628 people
- By 2030
- 283,549 · +0.7%
- By 2040
- 285,385 · +1.3%
- By 2050
- 286,188 · +1.6%
- By 2075
- 291,053 · +3.3%
- By 2100
- 282,374 · +0.3%
Race, ethnicity, and origin ACS 2023
- Neighborhood character
- Predominantly White (82%)
- Race & ethnicity
- White 82% Asian 8% Hispanic / Latino 7% Two or more races 4%
- Hispanic origin (detail)
- Mexican 2% Puerto Rican 3%
- Common ancestry
- Romanian 5% Slovak 2% Italian 2%
- Foreign-born
- 10% · China, Canada, Vietnam
- Languages at home
- 89% English-only · Other Indo-European 4% Spanish 3% Chinese 2%
Political lean MEDSL · Dauphin
- 2024 margin
- Lean D (+5.9) · D 52.4% · R 46.5% · Other 1.1%
- 2008→2024 swing
- -3.1pp toward R · 2008: 9.1pp · 2024: 5.9pp
- All cycles
- 2024: D+5.9 2020: D+8.5 2016: D+2.8 2012: D+6.0 2008: D+9.1
Not yet ingested
- Civics
- —
Market trends
- HPI YoY
- ▼ -97.37%
- Current HPI
- 245.2109
- Rent YoY
- ▲ 0.55%
- Metro
- Harrisburg-Carlisle, PA
- State GDP YoY
- ▲ 1.68%
- F500 in state
- 34
Industry mix (Fortune 500 HQ in PA)
| Industry | F500 HQs | Revenue |
|---|---|---|
| Healthcare | 2 | $309B |
|
||
| Insurance | 2 | $27B |
|
||
| Telecommunications / Media | 1 | $124B |
|
||
| Industrial Distribution | 1 | $22B |
|
||
| Financial Services | 1 | $20B |
|
||
| Chemicals / Materials | 1 | $18B |
|
||
Price history
+122.2% since first listed3 events — show timeline
- 2026-06-01 Listing Removed — BRIGHT MLS
- 2026-06-01 Listed $80,000 BRIGHT MLS
- 1985-11-22 Sold (Public Records) $36,000 Public Records
Property tax history
+1.9%/yrLatest (2026): $3,266 · +5.4% YoY. Source: county tax records.
Cash-flow waterfall
monthlySold comps — $/sqft
last 12 mo · ≤1 miLoading sold comps…