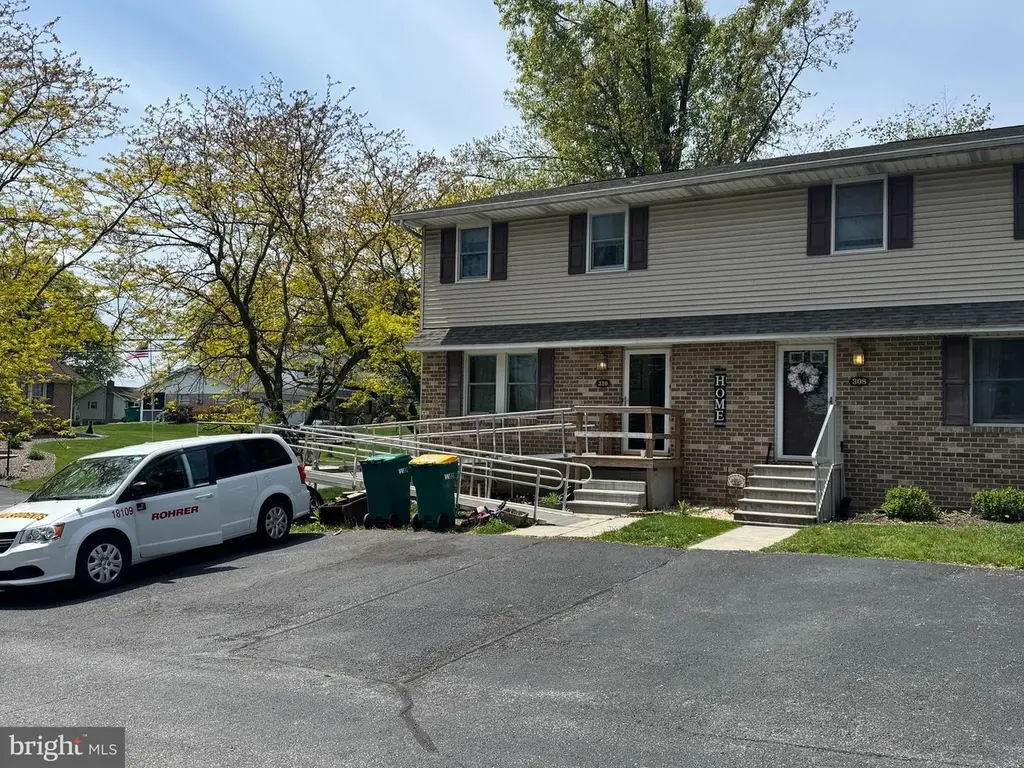
310 Fairview St · Carlisle, PA
Flood risk No data
- FEMA flood zone
- —
- Chance of flooding over 30 yrs
- —
- Est. flood insurance / yr
- —
Fire risk No data
- Est. fire insurance / yr
- —
Heat risk No data
- Hot days now (above threshold)
- —
- Hot days in 30 yrs
- —
Wind risk No data
- Chance of severe wind over 30 yrs
- —
Air-quality risk No data
- Unhealthy air days now
- —
- Unhealthy air days in 30 yrs
- —
Risk factors via First Street. Map © Google.
Why this score? — see what drove the B grade
The composite is a weighted blend of 9 inputs, each scored 0–100. Each bar is that input's sub-score; the figure is the points it added to the 100-point composite (weight × sub-score).
- Cash flow +30.0/30.0
- 1% rule +10.0/10.0
- DSCR +10.0/10.0
- ARV discount +7.5/15.0
- Schools +4.8/10.0
- Livability +3.9/5.0
- Rent growth +2.5/5.0
- Condition / age +2.5/5.0
- Appreciation +0.0/10.0
$145,000
🖨 Deal sheet 📄 Offer letter ✓ Due diligence
Listing remarks MLS
3 bedrooms, 1.5 bath end unit townhouse in Willaway Condominiums w/ full finished basement. Lots of space for you and your family. Some recent renovations completed. Nice deck and yard in rear.
Key facts
- $150 HOA
- 2 parking spots
- Built 1986
Neighborhood map
What this means for you Summary
Snapshot
- This is a 3-bed/1.5-bath townhouse listed at $145k.
Deal economics
- At list price, monthly cash flow is $598 ($7k/yr) — positive.
- The deal already cash-flows at list — no discount required.
- Meets the 1% rule at list price ($2k rent vs $145k).
- Cap rate 11.2% vs local median 3.7% in Carlisle — top-decile yield for the area; either an underpriced asset or a hidden risk that comps aren't pricing in. Stress-test before assuming the spread holds.
Location & tenants
- Location reads 78/100 on livability (#297 in PA, #2,632 nationally) — a middle-class / working-renter tenant base. Strengths: cost of living A+, housing A+, health & safety A+; Watch: employment C-, amenities D, commute F.
- South Middleton SD (town): math 45% / reading 63% proficiency, ranked #106 of 539 in PA (top 20%) — acceptable for families but not a draw, mixed tenant base, ~2y average lease; only 16% free/reduced lunch — higher-income household profile.
- Zoned schools: W.G. Rice El Sch (432 students, 38% FRL); Yellow Breeches Ms (math 27% / reading 59%, grade D-, #214 of 512 statewide, top 42%, 474 students, 31% FRL); Boiling Springs Hs (math 72% / reading 72%, grade B+, #39 of 437 statewide, top 9%, 777 students, 22% FRL).
- Market conditions: 188 active listings in the ZIP; 9 comparable units currently listed for rent nearby; rentals at typical pace (median 24d on market — plan ~3-4 weeks tenant-placement turnaround); solid renter incomes; 1,052 units permitted in Cumberland County in 2024 (310 in 5+ unit buildings).
- This rent runs 31% of the median local income ($87k/yr) — at the standard rent-burdened threshold; future hikes will face affordability resistance.
Forward outlook
- Local home prices are declining (-3.0%/yr); year-one equity from $1k of loan paydown is wiped out by about $4k of value loss. Plan a longer hold.
- Cumberland County population projected at +17% by 2050 — long-run rental-demand tailwind backs the buy-and-hold thesis.
- At projected returns (-3.0% appreciation + 3.0% rent growth), your $41k cash investment doubles in ~7 years — after that, you're playing with house money.
Negotiation context
- Only 0 days on market — expect competitive offers; lowballing is unlikely to land.
- 2 sale attempts since 20y ago with the ask held roughly flat each time — persistent listings suggest the price (not the market) is what's stuck; bring a comps-based counter.
Questions for the listing agent
- What does the HOA fee cover, when was the last increase, and are there any pending special assessments or reserve-fund shortfalls?
- Is there a deadline driving the sale (1031 exchange, divorce, estate, relocation)? That informs how much negotiation room exists.
- Schools are B-rated — typically a magnet for longer-tenancy family renters. What's the average tenant stay here, and is there a school-zone premium baked into asking?
- What's the average days-on-market for RENTAL listings here right now (not sales)? A rising rental-DOM trend means longer vacancies and softer asking-rent achievability than the comps imply.
- What's the recent tenant-quality profile in this submarket — average credit score on applications, eviction rate, late-payment / NSF rate, and stable-employment percentage? A property-management company in the area should have these aggregated.
- How much new for-sale + rental construction is in the pipeline within 1–3 miles? Heavy new supply typically softens prices + rents 12–24 months out; constrained supply supports both.
Investment metrics
- 1% rule
- 1.53% ✓
- Cap rate
- 11.24%
- Cash-on-cash
- 17.67%
- DSCR
- 1.79
- GRM
- 5.4
CMA / ARV
- ARV (on-the-fly)
- $295,680
- Comps found
- 10
Show comp detail 10 sales within ~0.75 mi
| Address | Dist | Beds/Ba | Sqft | Sold | Price | $/sf | Match |
|---|---|---|---|---|---|---|---|
| 310 Fairview St | 0.00mi | 3/1.5 | 1,608 (-13%) | 0mo | $140,000 | $87 | 78 |
| 134 Sable Dr | 0.68mi | 3/2.5 | 1,629 (-12%) | 1mo | $223,000 | $137 | 44 |
| 41 Abbey Ct | 0.57mi | 2/2.0 (-1) | 1,588 (-14%) | 11mo | $263,000 | $166 | 34 |
| 319 Pelham Ct | 0.70mi | 3/2.5 | 1,584 (-14%) | 8mo | $307,000 | $194 | 33 |
| 315 Pelham Ct | 0.71mi | 3/2.5 | 1,584 (-14%) | 8mo | $316,725 | $200 | 33 |
| 317 Pelham Ct | 0.70mi | 3/2.5 | 1,584 (-14%) | 9mo | $240,000 | $152 | 32 |
| 22 Abbey Ct | 0.64mi | 2/2.0 (-1) | 1,654 (-10%) | 21mo | $265,000 | $160 | 28 |
| 313 Pelham Ct | 0.71mi | 3/2.5 | 1,584 (-14%) | 13mo | $329,700 | $208 | 28 |
| 202 Sable Dr | 0.64mi | 3/2.5 | 1,629 (-12%) | 23mo | $240,200 | $147 | 27 |
| 116 Sable Dr | 0.74mi | 3/2.0 | 1,570 (-15%) | 18mo | $231,000 | $147 | 23 |
Match score weights: distance 35% · size 25% · config 20% · recency 20%. Top-matched comps best support the ARV.
Projected returns pro-forma
-3.0% appreciation · 3.0% rent growth · sell at horizon
- IRR
- 9.2%
- Equity multiple
- 1.36×
- Total profit
- $14,706
- Equity at exit
- $21,620
- IRR
- 18.4%
- Equity multiple
- 2.54×
- Total profit
- $62,352
- Equity at exit
- $12,537
Cash invested: $40,600 (down + closing). Projections, not guarantees.
Landlord ↔ Tenant lean methodology
- Overall (STATE)
- 62 Landlord-Friendly
- State Pennsylvania
- 62 Landlord-Friendly · EVEN
- County
- — inherits STATE
- City
- — inherits STATE
ZIP-level market 17015
- Home prices YoY
- -25.2%
- Active inventory
- 188
- Price-to-rent
- 5.4×
Monthly cashflow live
- Estimated rent
- $2,219 high interval (Pro) →
- Mortgage (P&I)
- −$760
- Tax from tax record
- −$184 /mo · $2,209/yr
- Insurance
- −$60
- HOA
- −$150
- Vacancy / Maint / Mgmt
- −$466
- Net cashflow
- $598
Break-even live
UW: 25.0% down · 7.5% · 30yr · 1.5% tax · 5.0% vac · 8.0% maint · 8.0% mgmt
Financing live
Cash to close
- Down payment
- $36,250
- Closing costs
- $4,350
- Reserves months
- —
- Total cash needed
- —
Loan-product check · same deal, 3 products live
Conventional
25% down · 7.5% · 30yr
- Down + closing
- —
- Monthly P&I
- —
- Monthly cashflow
- —
- DSCR
- —
- Eligible?
- —
Personal DTI + credit; lowest rate.
DSCR
20% down · 8.5% · 30yr
- Down + closing
- —
- Monthly P&I
- —
- Monthly cashflow
- —
- DSCR
- —
- Eligible?
- —
No personal income docs; deal must DSCR.
Hard money
10% down · 12.0% · 12mo
- Down + closing
- —
- Monthly P&I
- —
- Monthly cashflow
- —
- DSCR
- —
- Eligible?
- —
Short-term bridge; refi at stabilization.
Rent comps 9 comps
| Address | Beds | Baths | Sqft | Rent | $/sqft | DOM | Units | Dist |
|---|---|---|---|---|---|---|---|---|
| 315 York Rd Carlisle, PA | 3.0 | 2.5 | 1604 | $2,100 | $1.31 | 14d | 1 | 0.42mi |
| 134 Sable Dr Carlisle, PA | 3.0 | 2.5 | 1629 | $2,100 | $1.29 | 14d | 1 | 0.69mi |
| 308 Alfalfa Dr CARLISLE BRKS, PA | 4.0 | 2.5 | 1625 | $2,150 | $1.32 | 23d | 1 | 1.08mi |
| 206 Alfalfa Dr CARLISLE BRKS, PA | 4.0 | 2.5 | 1625 | $2,050 | $1.26 | 23d | 1 | 1.08mi |
| 79 Dawn Ridge Loop Carlisle, PA | 2.0–3.0 | 1.0–1.5 | 1179 | $1,474 | $1.25 | 14d | 4 | 1.18mi |
| 495 S Spring Garden St #109 Carlisle, PA | 4.0 | 2.5 | 1625 | $2,150 | $1.32 | 23d | 1 | 1.32mi |
| 495 S Spring Garden St #202 Carlisle, PA | 4.0 | 2.5 | 1625 | $2,050 | $1.26 | 23d | 1 | 1.32mi |
| 495 S Spring Garden St #308 Carlisle, PA | 4.0 | 2.5 | 1625 | $1,835 | $1.13 | 43d | 1 | 1.32mi |
| 495 S Spring Garden St Unit 302 Carlisle, PA | 4.0 | 2.5 | 1625 | $1,735 | $1.07 | 43d | 1 | 1.32mi |
HOA detail
- Monthly dues
- $150 · $1,800/yr
Listing history 6 events
-
2026-05-12$145,000
-
2026-05-12historical
-
2006-12-29soldstatus $127,900 193-char remark
Show marketing remark (193 chars)
3 bedrooms, 1.5 bath end unit townhouse in Willaway Condominiums w/ full finished basement. Lots of space for you and your family. Some recent renovations completed. Nice deck and yard in rear.
-
2006-12-20soldstatus $127,900
-
2006-11-08$127,900 193-char remark
Show marketing remark (193 chars)
3 bedrooms, 1.5 bath end unit townhouse in Willaway Condominiums w/ full finished basement. Lots of space for you and your family. Some recent renovations completed. Nice deck and yard in rear.
-
1986-09-22soldstatus $65,000
ⓘ Source: listings_history table (triggers on properties + properties_extension) + one-shot
backfill from property_details.listing_events for pre-trigger history.
Tax reassessment forecast PA · Partial reset (capped growth)
- Current annual tax
- $2,209 · $184/mo
- Projected year-2 tax
- $2,250 · $188/mo
- Expected delta
- +$41/yr (+$3/mo · 1.8%)
ⓘ Screening estimate from a state-policy table — verify with the county assessor before closing.
Nearby sold comps map
Loading sold comps map…
Walkable amenities ~0.75 mi
Loading nearby amenities…
Taxation est. · year 1
- Rental income
- $26,624
- − Mortgage interest
- −$8,122
- − Property taxes
- −$2,209
- − Insurance
- −$725
- − Repairs & maintenance
- −$2,130
- − Management
- −$2,130
- − HOA
- −$1,800
- − Depreciation
- −$4,218
- Taxable income
- $5,289
- Est. tax owed @ 24.0%
- −$1,269
- After-tax cash flow
- $5,904/yr
For passive investors: Depreciation is non-cash, so a rental often shows a tax loss while cash-flowing — sheltering income. Rental losses are passive: they offset passive income freely, and up to $25,000/yr can offset ordinary (W-2) income if you actively participate and your MAGI is under $100k (phasing out to $0 by $150k); unused losses carry forward. On sale, claimed depreciation is recaptured at up to 25%, and gains may owe capital-gains tax (a 1031 exchange can defer both). Figures are a year-1 estimate at your 24.0% rate — not tax advice; consult a CPA.
Schools (NCES district)
- District
- South Middleton SD
- NCES district ID
- 4222050
- Math proficiency
- 45% ▼ -8.00%
- Reading proficiency
- 63% ▼ -7.00%
- Median HH income
- $67,822
- Composite
- 47.74/100
- National rank
- #2236
- State rank
- #106 of 539 in PA
Livability — Carlisle
- Score
- 78/100
- State rank
- #297
- US rank
- #2632
Category grades
Schools grade is shown separately in the Schools card above.
Census & demographics
- County
- Cumberland County · 257,673 people
- City population
- 62,898
- Metro
- Harrisburg-Carlisle, PA
- Population (ZIP)
- 24,385
- Household income
- $86,981
- Rent vs Own
- Severe rent burden
- 172.0
Population outlook (Cumberland County) Hauer SSP2
- Today (2025)
- 267,950 people
- By 2030
- 278,105 · +3.8%
- By 2040
- 296,552 · +10.7%
- By 2050
- 312,937 · +16.8%
- By 2075
- 349,233 · +30.3%
- By 2100
- 361,875 · +35.1%
Race, ethnicity, and origin ACS 2023
- Neighborhood character
- Predominantly White (94%)
- Race & ethnicity
- White 94% Two or more races 2% Hispanic / Latino 2%
- Common ancestry
- Romanian 3% Lithuanian 2% Slovak 2%
- Foreign-born
- 2% · Canada
- Languages at home
- 97% English-only · German/W. Germanic 1% Spanish 1% Other Indo-European 1%
Political lean MEDSL · Cumberland
- 2024 margin
- Lean R (+9.4) · D 44.6% · R 54.1% · Other 1.3%
- 2008→2024 swing
- +4.2pp toward D · 2008: -13.6pp · 2024: -9.4pp
- All cycles
- 2024: R+9.4 2020: R+10.6 2016: R+18.6 2012: R+18.5 2008: R+13.6
Not yet ingested
- Civics
- —
Market trends
- HPI YoY
- ▼ -89.66%
- Current HPI
- 265.9175
- Rent YoY
- —
- Metro
- Harrisburg-Carlisle, PA
- State GDP YoY
- ▲ 1.68%
- F500 in state
- 34
Industry mix (Fortune 500 HQ in PA)
| Industry | F500 HQs | Revenue |
|---|---|---|
| Healthcare | 2 | $309B |
|
||
| Insurance | 2 | $27B |
|
||
| Telecommunications / Media | 1 | $124B |
|
||
| Industrial Distribution | 1 | $22B |
|
||
| Financial Services | 1 | $20B |
|
||
| Chemicals / Materials | 1 | $18B |
|
||
Price history
+123.1% since first listed6 events — show timeline
- 2026-05-12 Listing Removed — BRIGHT MLS
- 2026-05-12 Listed $145,000 BRIGHT MLS
- 2006-12-29 Sold (MLS) $127,900 BRIGHT MLS
- 2006-12-20 Sold (Public Records) $127,900 Public Records
- 2006-11-08 Listed $127,900 BRIGHT MLS
- 1986-09-22 Sold (Public Records) $65,000 Public Records
Property tax history
+3.9%/yrLatest (2026): $2,209 · +4.5% YoY. Source: county tax records.
Cash-flow waterfall
monthlySold comps — $/sqft
last 12 mo · ≤1 miLoading sold comps…