446 Landers Rd · Madison, AL
Flood risk 1/10 · Minimal
- FEMA flood zone
- X (unshaded)
- Chance of flooding over 30 yrs
- 0.0%
- Est. flood insurance / yr
- $507 – $1,088
Fire risk 1/10 · Minimal
- Est. fire insurance / yr
- $916 – $1,700
Heat risk 5/10 · Moderate
- Hot days now (above 106°F)
- 7 days/yr
- Hot days in 30 yrs
- 17 days/yr
Wind risk 4/10 · Minor
- Chance of severe wind over 30 yrs
- 21.0%
Air-quality risk 2/10 · Minimal
- Unhealthy air days now
- 0 days/yr
- Unhealthy air days in 30 yrs
- 2 days/yr
Risk factors via First Street. Map © Google.
Why this score? — see what drove the D grade
The composite is a weighted blend of 9 inputs, each scored 0–100. Each bar is that input's sub-score; the figure is the points it added to the 100-point composite (weight × sub-score).
- ARV discount +15.0/15.0
- Appreciation +10.0/10.0
- Schools +5.6/10.0
- Livability +3.8/5.0
- Rent growth +2.9/5.0
- Cash flow +2.6/30.0
- Condition / age +2.5/5.0
- 1% rule +0.0/10.0
- DSCR +0.0/10.0
$624,900
🖨 Deal sheet (PDF) 📄 Offer letter ✓ Due diligence
Listing remarks MLS
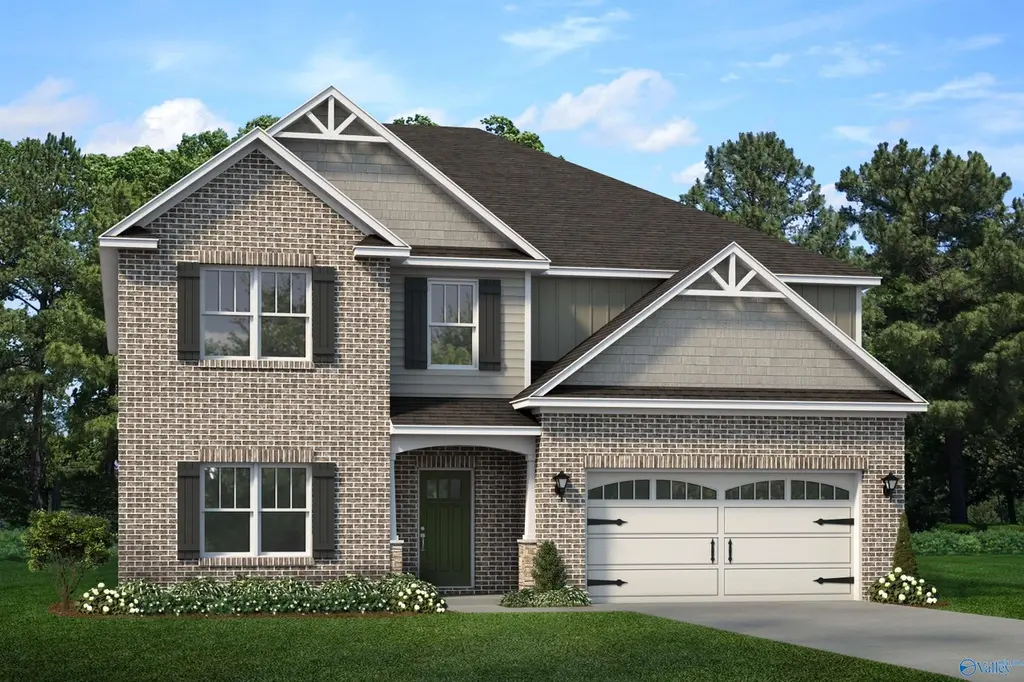
Proposed Construction-*Proposed Construction* Located in the HEART OF MADISON just a short walk to downtown shopping an dining. This Harper floor plan features an open and spacious first floor with the primary ensuite down, dining and study. The second floor has 4 bedrooms and an oversized loft. This floorplan is customizable to fit your families needs. Over 4400 square feet, this home has all the space your family needs. Located in MADISON CITY SCHOOL District!
Key facts
- 0.47 acre lot
- 2 garage spots
- Community pool
Neighborhood map
What this means for you Summary
Snapshot
- This is a 5-bed/3.5-bath single-family listed at $625k.
Deal economics
- At list price, monthly cash flow is $-2k ($-26k/yr) — negative.
- To cash-flow at today's rent, offer at most $314k (49.7% below list).
- To meet the 1% rule (rent ≥ 1% of price), the offer needs to be $280k (55.2% below list).
- Recommended offer: $280k (55.2% below list) — sets the bar for 1% rule.
Location & tenants
- Location reads 76/100 on livability (#12 in AL, #3,280 nationally) — a middle-class / working-renter tenant base. Strengths: employment A+, housing A+, schools A; Watch: amenities F, commute F.
- Madison City (suburban): math 51% / reading 71% proficiency, ranked #4 of 129 in AL (top 3%) — acceptable for families but not a draw, mixed tenant base, ~2y average lease; only 17% free/reduced lunch — higher-income household profile.
- Market conditions: Rents rising (+1.6%/yr); 382 active listings in the ZIP; 4 comparable units currently listed for rent nearby; rentals lingering (median 45d on market — plan ~5-8 weeks vacancy on turnover, expect pricing pressure); 50% of comp listings sitting > 30 days — soft ceiling on asking rent; high-income renter base; 4,709 units permitted in Madison County in 2024 (1,186 in 5+ unit buildings).
Forward outlook
- In year one you build about $67k of equity ($4k loan paydown + $62k appreciation (10.0% local appreciation)).
- Madison County population projected at +18% by 2050 — long-run rental-demand tailwind backs the buy-and-hold thesis.
- By year 2, paydown + projected appreciation supports a ~$107k cash-out refi (75% LTV) — recoverable capital for the next deal without selling this one.
Negotiation context
- It's been on market 74 days — a 6% lower offer ($587k) is reasonable based on typical stale-listing flexibility.
Risks & watch-outs
- Climate carrying-cost: extreme-heat days projected 7→17/yr by 2055 (HVAC capex compounding) — expect insurance premiums to compound above CPI over the hold.
Questions for the listing agent
- What do current leases actually rent for vs. the listed asking? Can we see a recent rent roll and the last 12 months of T-12 income?
- It's been on market 74 days. Have you received any prior offers? Is the seller open to a 55% concession, seller financing, or rate buy-down credit?
- What does the HOA fee cover, when was the last increase, and are there any pending special assessments or reserve-fund shortfalls?
- Why hasn't it sold? Are there any deal-killer items the seller is aware of (foundation, flood, title, zoning, code violations)?
- Is there a deadline driving the sale (1031 exchange, divorce, estate, relocation)? That informs how much negotiation room exists.
- Schools are A-rated — typically a magnet for longer-tenancy family renters. What's the average tenant stay here, and is there a school-zone premium baked into asking?
- The area grade is low — what's the realistic commute time and amenity access for the typical tenant pool here? Any planned neighborhood developments (good or bad) we should know about?
- What's the average days-on-market for RENTAL listings here right now (not sales)? A rising rental-DOM trend means longer vacancies and softer asking-rent achievability than the comps imply.
- What's the recent tenant-quality profile in this submarket — average credit score on applications, eviction rate, late-payment / NSF rate, and stable-employment percentage? A property-management company in the area should have these aggregated.
- How much new for-sale + rental construction is in the pipeline within 1–3 miles? Heavy new supply typically softens prices + rents 12–24 months out; constrained supply supports both.
Investment metrics
- 1% rule
- 0.45% ✗
- Cap rate
- 2.17%
- Cash-on-cash
- -14.73%
- DSCR
- 0.34
- GRM
- 18.6
CMA / ARV
- ARV (median comp)
- $776,159
- List price
- $624,900
- Delta
- -19.49%
- Verdict
- UNDERPRICED
- Comps
- 20 within 1.0 mi
Show comp detail 2 sales within ~0.75 mi
| Address | Dist | Beds/Ba | Sqft | Sold | Price | $/sf | Match |
|---|---|---|---|---|---|---|---|
| 113 Shiloh Creek Dr | 0.68mi | 4/3.5 (-1) | 4,182 (-5%) | 0mo | $820,000 | $196 | 54 |
| 126 Pine Willow Cir | 0.70mi | 5/4.0 | 4,217 (-4%) | 21mo | $790,000 | $187 | 41 |
Match score weights: distance 35% · size 25% · config 20% · recency 20%. Top-matched comps best support the ARV.
Projected returns pro-forma
10.0% appreciation · 1.58% rent growth · sell at horizon
- IRR
- 13.8%
- Equity multiple
- 2.14×
- Total profit
- $199,675
- Equity at exit
- $562,959
- IRR
- 13.7%
- Equity multiple
- 4.93×
- Total profit
- $688,158
- Equity at exit
- $1,214,043
Cash invested: $174,972 (down + closing). Projections, not guarantees.
Landlord ↔ Tenant lean methodology
- Overall (STATE)
- 90 Strongly Landlord-Friendly
- State Alabama
- 90 Strongly Landlord-Friendly · R+15
- County
- — inherits STATE
- City
- — inherits STATE
ZIP-level market 35758
- Home prices YoY
- 4.2%
- Rents YoY
- 1.6%
- Active inventory
- 382
- Price-to-rent
- 18.6×
Monthly cashflow live
- Estimated rent
- $2,801 medium interval (Pro) →
- Mortgage (P&I)
- −$3,277
- Tax est. 1.5%
- −$781 /mo · $9,374/yr
- Insurance
- −$260
- HOA
- −$42
- Vacancy / Maint / Mgmt
- −$588
- Net cashflow
- $-2,148
Break-even live
Sensitivity live
| Price | -10% $-1,716 | -5% $-1,932 | +0% $-2,148 | +5% $-2,364 | +10% $-2,579 |
|---|---|---|---|---|---|
| Rent | -10% $-2,369 | -5% $-2,258 | +0% $-2,148 | +5% $-2,037 | +10% $-1,926 |
| Rate | -1.0pp $-1,833 | -0.5pp $-1,989 | base $-2,148 | +0.5pp $-2,310 | +1.0pp $-2,474 |
UW: 25.0% down · 7.5% · 30yr · 1.5% tax · 5.0% vac · 8.0% maint · 8.0% mgmt
Financing live
Cash to close
- Down payment
- $156,225
- Closing costs
- $18,747
- Reserves months
- —
- Total cash needed
- —
Loan-product check · same deal, 3 products live
Conventional
25% down · 7.5% · 30yr
- Down + closing
- —
- Monthly P&I
- —
- Monthly cashflow
- —
- DSCR
- —
- Eligible?
- —
Personal DTI + credit; lowest rate.
DSCR
20% down · 8.5% · 30yr
- Down + closing
- —
- Monthly P&I
- —
- Monthly cashflow
- —
- DSCR
- —
- Eligible?
- —
No personal income docs; deal must DSCR.
Hard money
10% down · 12.0% · 12mo
- Down + closing
- —
- Monthly P&I
- —
- Monthly cashflow
- —
- DSCR
- —
- Eligible?
- —
Short-term bridge; refi at stabilization.
Rent comps 4 comps
| Address | Beds | Baths | Sqft | Rent | $/sqft | DOM | Units | Dist |
|---|---|---|---|---|---|---|---|---|
| 104 Horseshoe Bnd S Madison, AL | 4.0 | 3.5 | 3100 | $2,650 | $0.85 | 44d | 1 | 0.81mi |
| 240 Heritage Mill Dr Madison, AL | 4.0 | 4.5 | 3600 | $2,975 | $0.83 | 44d | 1 | 1.01mi |
| 101 Mill Ridge Dr Madison, AL | 4.0 | 3.5 | 3453 | $3,100 | $0.90 | 14d | 1 | 1.02mi |
| 137 Cormorant Lndg Madison, AL | 4.0 | 3.5 | 3692 | $3,600 | $0.98 | 24d | 1 | 1.33mi |
HOA detail
- Monthly dues
- $42 · $504/yr
Listing history 15 events
-
2026-06-18days on market $624,900 Active 74 DOM
-
2026-06-17days on market $624,900 Active 73 DOM
-
2026-06-16days on market $624,900 Active 72 DOM
-
2026-06-15days on market $624,900 Active 71 DOM
-
2026-06-14days on market $624,900 Active 69 DOM
-
2026-06-10days on market $624,900 Active 66 DOM
-
2026-06-09days on market $624,900 Active 65 DOM
-
2026-06-08days on market $624,900 Active 64 DOM
-
2026-06-07days on market $624,900 Active 63 DOM
-
2026-06-03days on market $624,900 Active 59 DOM
-
2026-06-02days on market $624,900 Active 58 DOM
-
2026-06-01days on market $624,900 Active 57 DOM
-
2026-05-31days on market $624,900 Active 56 DOM
-
2026-05-30days on market $624,900 Active 55 DOM
-
2026-04-05$624,900 Active 466-char remark
Show marketing remark (466 chars)
Proposed Construction-*Proposed Construction* Located in the HEART OF MADISON just a short walk to downtown shopping an dining. This Harper floor plan features an open and spacious first floor with the primary ensuite down, dining and study. The second floor has 4 bedrooms and an oversized loft. This floorplan is customizable to fit your families needs. Over 4400 square feet, this home has all the space your family needs. Located in MADISON CITY SCHOOL District!
ⓘ Source: listings_history table (triggers on properties + properties_extension) + one-shot
backfill from property_details.listing_events for pre-trigger history.
Climate risk First Street
- Flood 1/10 Low FEMA zone X (unshaded) · 0% chance over 30 yrs
- Wildfire 1/10 Low
- Heat 5/10 Major 7 d/yr ≥106°F today · 17 d/yr by 30 yrs out
- Wind 4/10 Moderate 21% chance of damaging wind over 30 yrs
- Air quality 2/10 Low 0 unhealthy d/yr today · 2 by 30 yrs out
Nearby sold comps map
Loading sold comps map…
Walkable amenities ~0.75 mi
Loading nearby amenities…
Taxation est. · year 1
- Rental income
- $33,614
- − Mortgage interest
- −$35,004
- − Property taxes
- −$9,374
- − Insurance
- −$3,124
- − Repairs & maintenance
- −$2,689
- − Management
- −$2,689
- − HOA
- −$504
- − Depreciation
- −$18,179
- Taxable loss
- −$37,949
- Est. tax savings @ 24.0%
- +$9,108
- After-tax cash flow
- $-16,664/yr
For passive investors: Depreciation is non-cash, so a rental often shows a tax loss while cash-flowing — sheltering income. Rental losses are passive: they offset passive income freely, and up to $25,000/yr can offset ordinary (W-2) income if you actively participate and your MAGI is under $100k (phasing out to $0 by $150k); unused losses carry forward. On sale, claimed depreciation is recaptured at up to 25%, and gains may owe capital-gains tax (a 1031 exchange can defer both). Figures are a year-1 estimate at your 24.0% rate — not tax advice; consult a CPA.
Schools (NCES district)
- District
- Madison City
- NCES district ID
- 0100008
- Math proficiency
- 51% ▼ -25.00%
- Reading proficiency
- 71% ▼ -2.00%
- Median HH income
- $89,091
- Composite
- 55.56/100
- National rank
- #1238
- State rank
- #4 of 129 in AL
Livability — Madison
- Score
- 76/100
- State rank
- #12
- US rank
- #3280
Category grades
Schools grade is shown separately in the Schools card above.
Census & demographics
- Census place
- Madison, AL
- County
- Madison County · 380,832 people
- City population
- 93,742
- Metro
- Huntsville, AL
- Population (ZIP)
- 50,266
- Household income
- $117,380
- Rent vs Own
- Severe rent burden
- 875.0
Population outlook (Madison County) Hauer SSP2
- Today (2025)
- 392,086 people
- By 2030
- 409,788 · +4.5%
- By 2040
- 440,557 · +12.4%
- By 2050
- 460,990 · +17.6%
- By 2075
- 502,872 · +28.3%
- By 2100
- 513,623 · +31.0%
Race, ethnicity, and origin ACS 2023
- Neighborhood character
- Predominantly White (68%)
- Race & ethnicity
- White 68% Black 14% Hispanic / Latino 8% Asian 7% Two or more races 7%
- Hispanic origin (detail)
- Mexican 3% Puerto Rican 2%
- Common ancestry
- Slovak 3% Italian 2% Lithuanian 2%
- Foreign-born
- 9% · Canada, South Korea, Vietnam
- Languages at home
- 87% English-only · Spanish 5% Other Asian/Pacific 2% Chinese 1%
Political lean MEDSL · Madison
- 2024 margin
- Lean R (+9.0) · D 44.7% · R 53.7% · Other 1.6%
- 2008→2024 swing
- +6.0pp toward D · 2008: -14.9pp · 2024: -9.0pp
- All cycles
- 2024: R+9.0 2020: R+8.0 2016: R+16.8 2012: R+18.7 2008: R+14.9
Not yet ingested
- Civics
- —
Market trends
- HPI YoY
- ▲ 14.46%
- Current HPI
- 355.2784
- Rent YoY
- ▲ 1.58%
- Metro
- Huntsville, AL
- State GDP YoY
- ▲ 2.94%
- F500 in state
- 4
Industry mix (Fortune 500 HQ in AL)
| Industry | F500 HQs | Revenue |
|---|---|---|
| Financial Services | 1 | $8B |
|
||
| Healthcare | 1 | $5B |
|
||
Price history
1 event — show timeline
- 2026-04-05 Listed $624,900 VMLS
Cash-flow waterfall
monthlySold comps — $/sqft
last 12 mo · ≤1 miLoading sold comps…